General Data Review and Boundaries
General Analysis projects have been purpose-built from the ground up based on user feedback.
This new project style allows you to quickly open and add datasets from Analyst or other sources. You can then immediately create and review insights from those datasets using the same tools you're already familiar with in Create a Land Use Scenario Project.
Let's walk through an example of this using the contiguous United States as the boundary.
Create a General Analysis Project
Click Create project in the upper right corner of the screen. The Create New Project window appears.
Click General Analysis Type on the left side of the Create Project screen.
Enter project information.
Define your project area. By default, the boundary is set as the United States, which includes all 50 states and D.C. You can select from available boundaries or upload a project area boundary. Project area boundaries can consist of multiple polygons. In this workflow, we've used a simple 4-point bounding box around the US.
Click . Your project will be created. There are no Base Canvas or Analysis layers, so this process should take under 2 minutes.
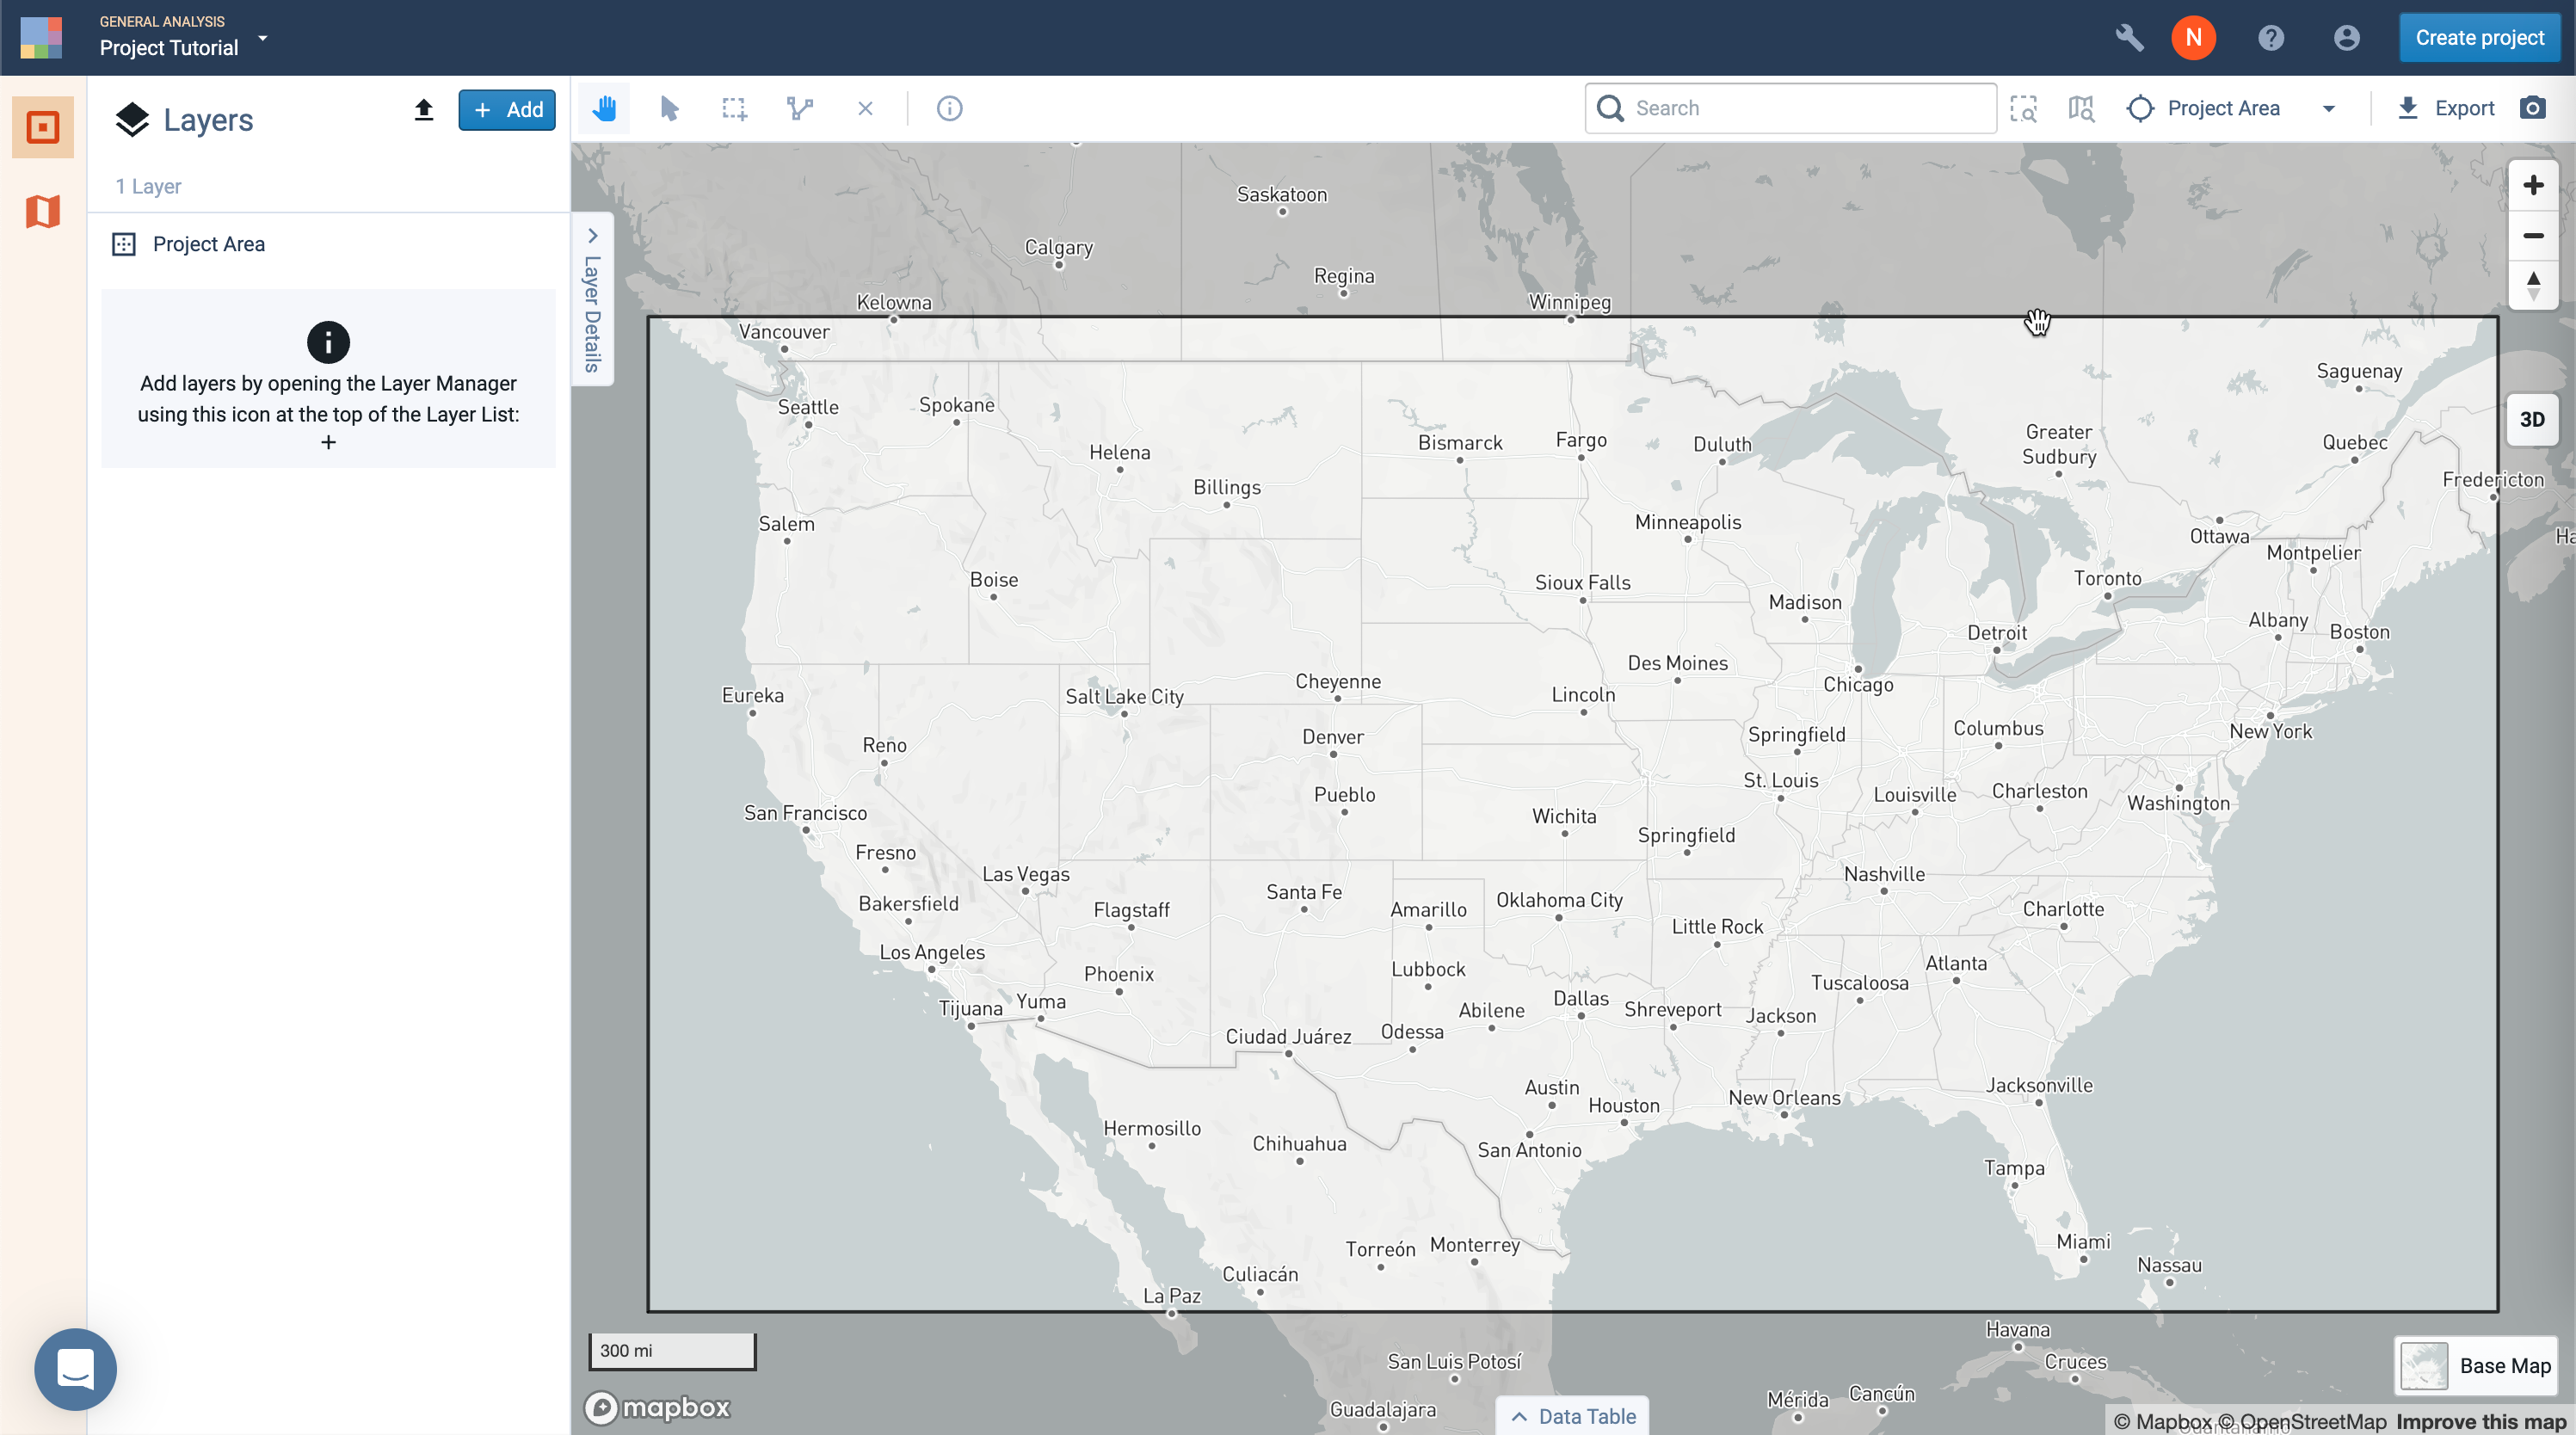
An example of a Nationwide General Analysis Project using a simple bounding box
Note
You can easily create a polygon boundary in GeoJSON or zipped shapefile format at GeoJSON.io.
Add Reference Layers
Now that the project has been created let's set its layer list with some of the fundamental Census Geographic Boundary layers.
Select Add > Add pre-defined layers at the top of the Layers pane to open the Layer Manager.
Search for the layers to add. Use the Search box to find data by title or keyword, or browse the list by category. For the next steps, Select the Blue Category arrow next to Administrative Boundaries to open up and view those layers.
Click on a layer entry to view its information. Metadata for the reference data is shown.
Click the + button next to the following layers to add them to your project:
Census Block (2020)
ZIP Code Tabulation Areas (ZCTAs)
Jurisdiction Boundaries
Census County (2020)
Core Based Statistical Areas (CBSAs)
States
Close the window. The layers will be added to your project and appear in the Layers list. By default, newly added layers will be hidden. Newly added layers will appear in a project's Layers list for all users.
Find your layers in the Layers list and click the Show icon
 . The layer will be displayed on the map. Reference data layers may come with default symbology. See Symbolize Data Layers for details on changing symbology. Layer order, symbology, and visibility are unique to each user.
If you'd like, you can also import and upload an Open Data portal or Local GIS Team datasets.
Build Your Initial View
Select the States layer to make it active.
Change the Display Column and Style No Column (Single Symbol) to outline before moving to the next step.
Select the Core Based Statistical Areas (CBSAs) layer to make it active.
Style the layer to Fill each polygon with color and set it to have a TRANSPARENT Stroke.
Select the Census Counties (2020) layer to make it active.
Style the layer to have No Color fill and a 1 color Stroke.
Drag the States Layer, Above the Census County (2020) layer in the Layers list.
Drag the Core Based Statistical Area (CBSAs) layer, below the Census County (2020) layer in the Layers list.
Adjust the opacity on each layer to refine the view of the overall project.
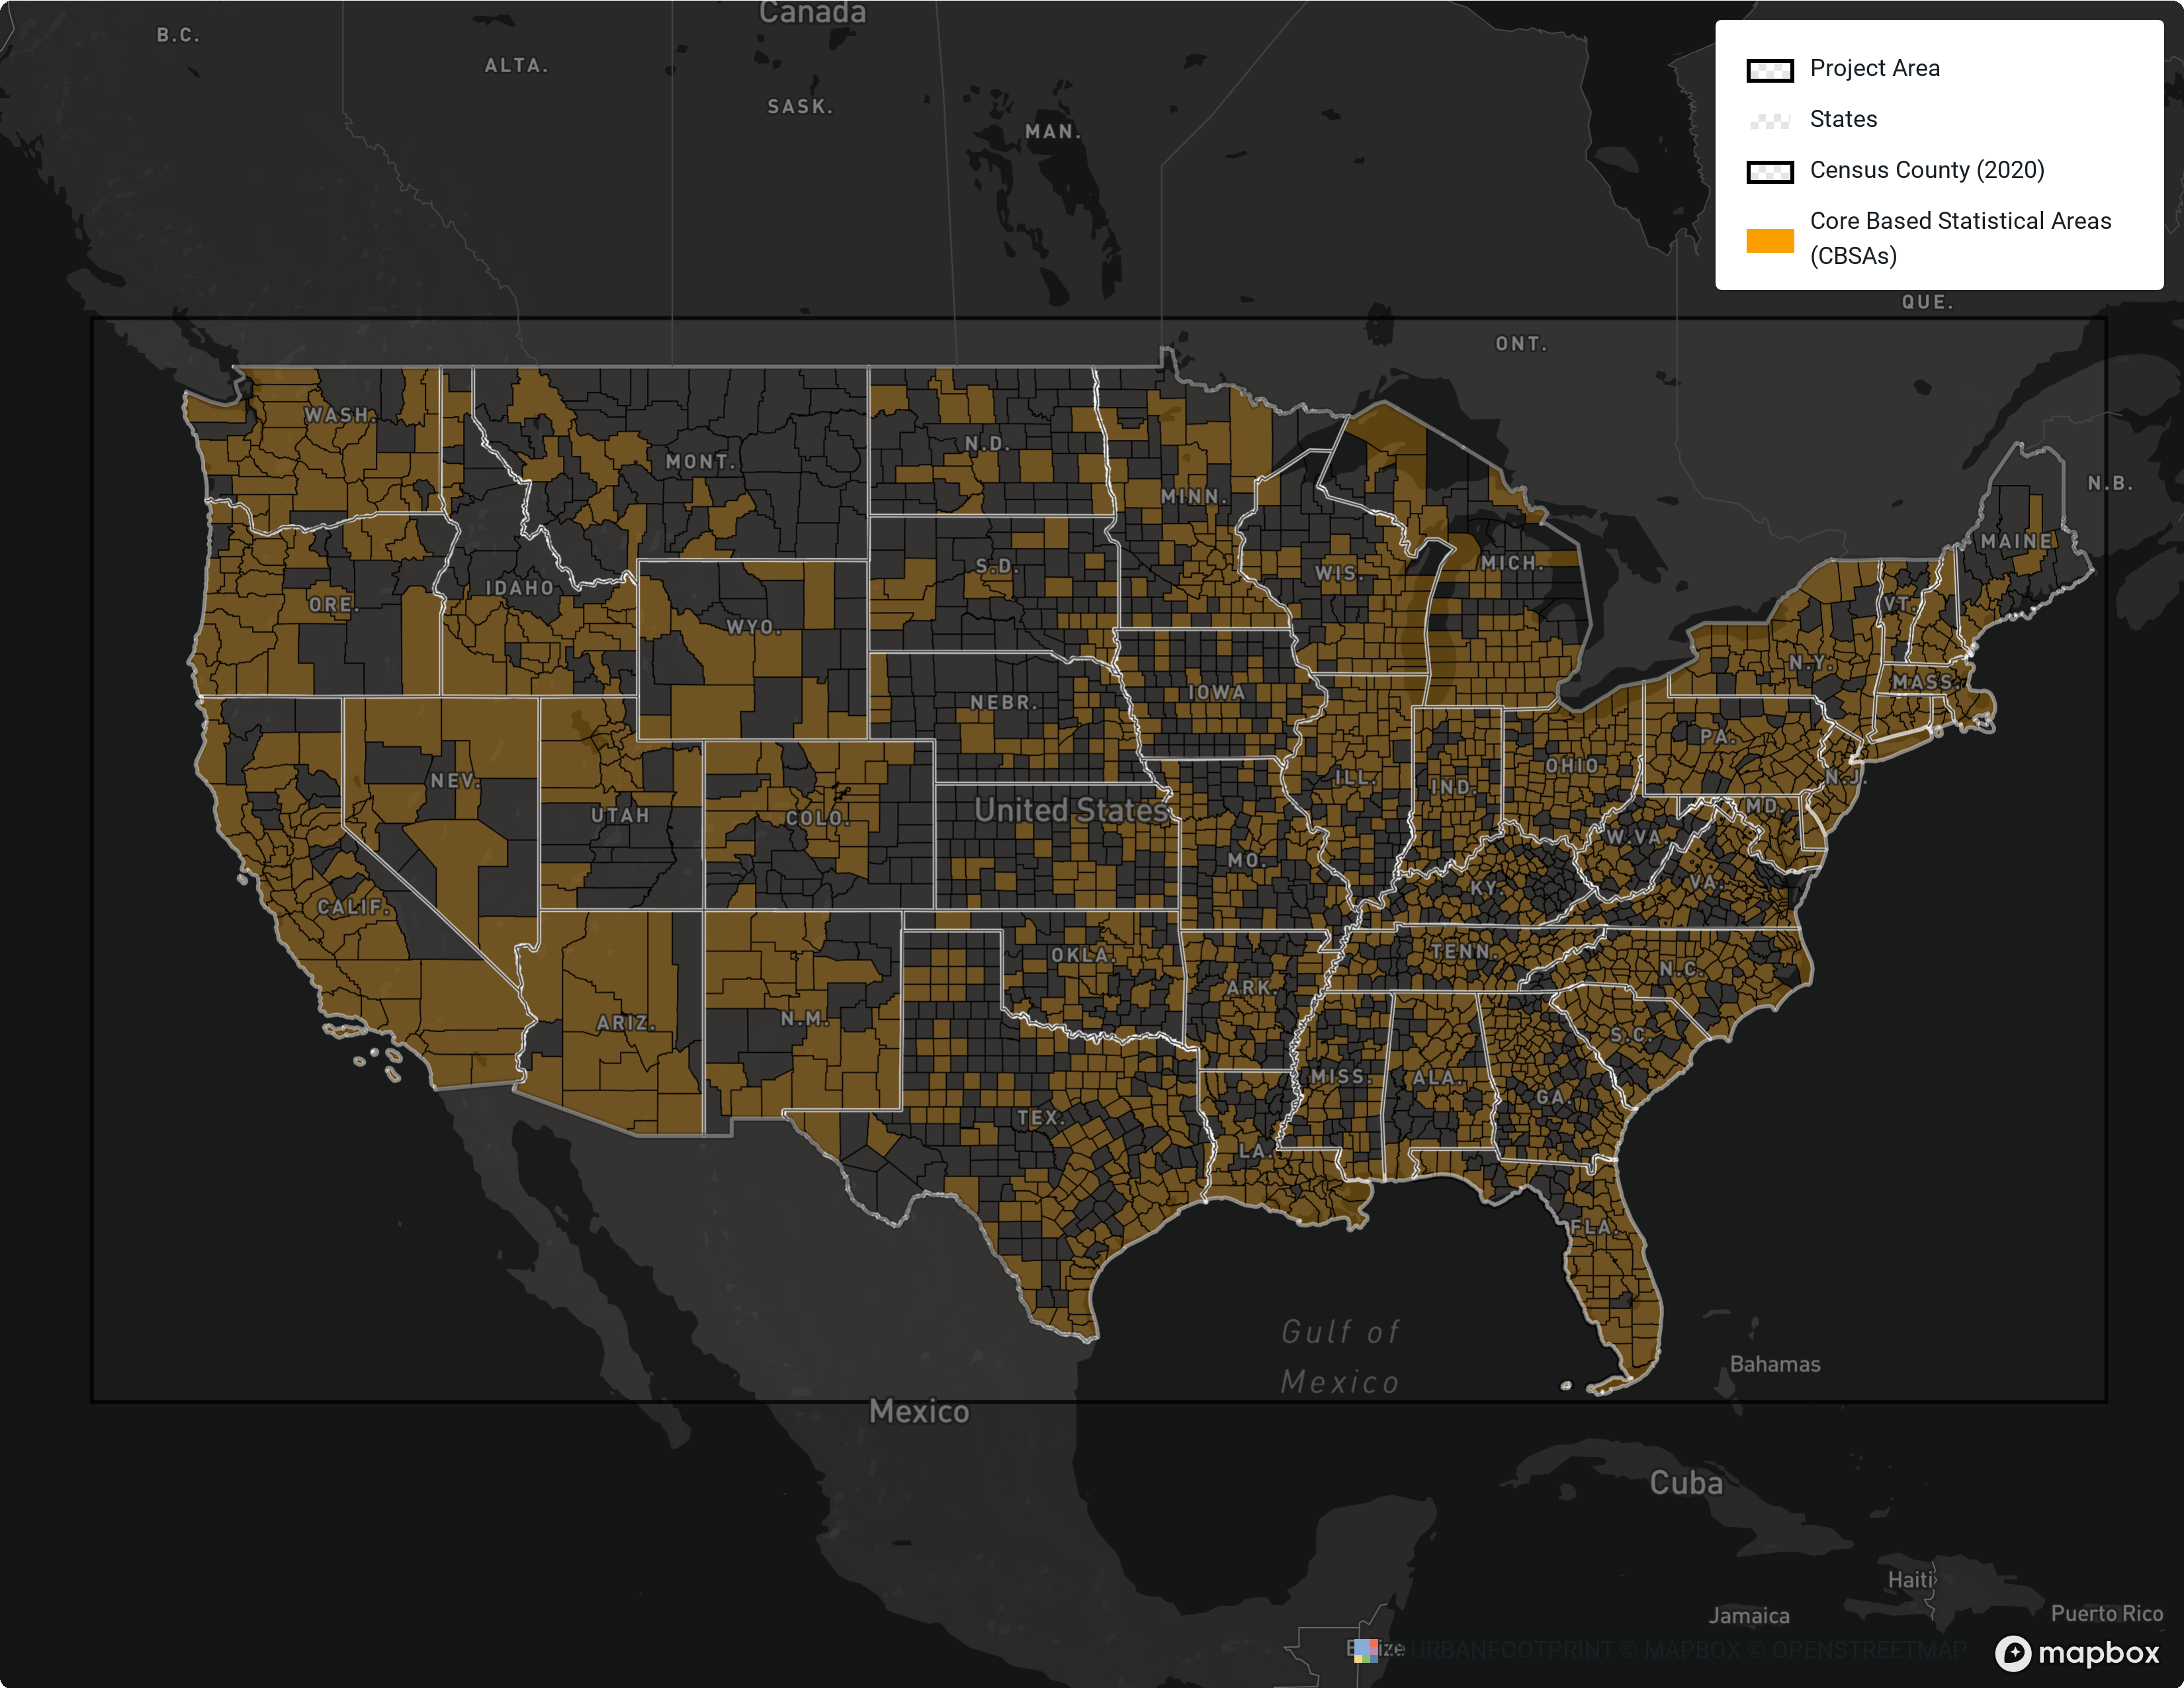
Example result where the State Outlines, sit above the Counties, that sit above Filled in CBSA areas in the Layers list.
You've now styled this project exactly how you would need it. You can close this project now and return to it anytime to review or directly interact with anyone of the data geometries above.
From here, you will focus on how to leverage this project for use in creating your custom project area boundaries.
Use General Analysis to Build Better Project Areas
Many people request help selecting or using the best possible boundary for a Scenario Analysis project that initially brings in the most amount of data, and then is scoped down once a project is won or elaborated upon.
In this example, you'll create a project that covers counties that touch the Pacific Ocean on the West Coast of the United States.
Box-Select the States
Open the States Layer.
Select or use the b key to use the Box Selection tool.
Draw a Box around the three states along the Pacific. Each state's outline will turn blue when it is selected.
Open the Layer Details tab, Select Filter.
You will observe the blue Selection X value in the filter. Hover over to confirm there is only one polygon with 4 points selection.
Use Save as to filter this layer into its independent layer in your layer list. Use a memorable name that is easy to find in the future, for example, States—Along the Pacific Ocean.
Once the filtered layer is created, select the View button on the notification or select the layer directly from the layer list.
Using the Download Layer button at the top of the Layer Details tab, Download this layer into a Shapefile/Geojson/Geopackage.
Create a General Analysis Project using this new Custom Project Area.
Once the new project is in place, bring in all your needed reference layers and start building maps.
Polygon-Select the Counties
Open the Counties layer.
Select or use the r key to use the Polygon Selection tool.
Draw your polygon as precisely as needed, using zoom in and out to adjust the viewport in the best manner.
Open the Layer Details tab, Select Buffer.
With your counties selection in place, Create a Buffer Distance of 1-2 Miles. This will flatten every geometry selected into a single polygon.
Using the Download Layer button at the top of the Layer Details tab, download this layer into a Shapefile/Geojson/Geopackage.
Create a General Analysis project using this new Custom Project Area.
Once the new project is in place, bring in all your needed reference layers and start building maps.
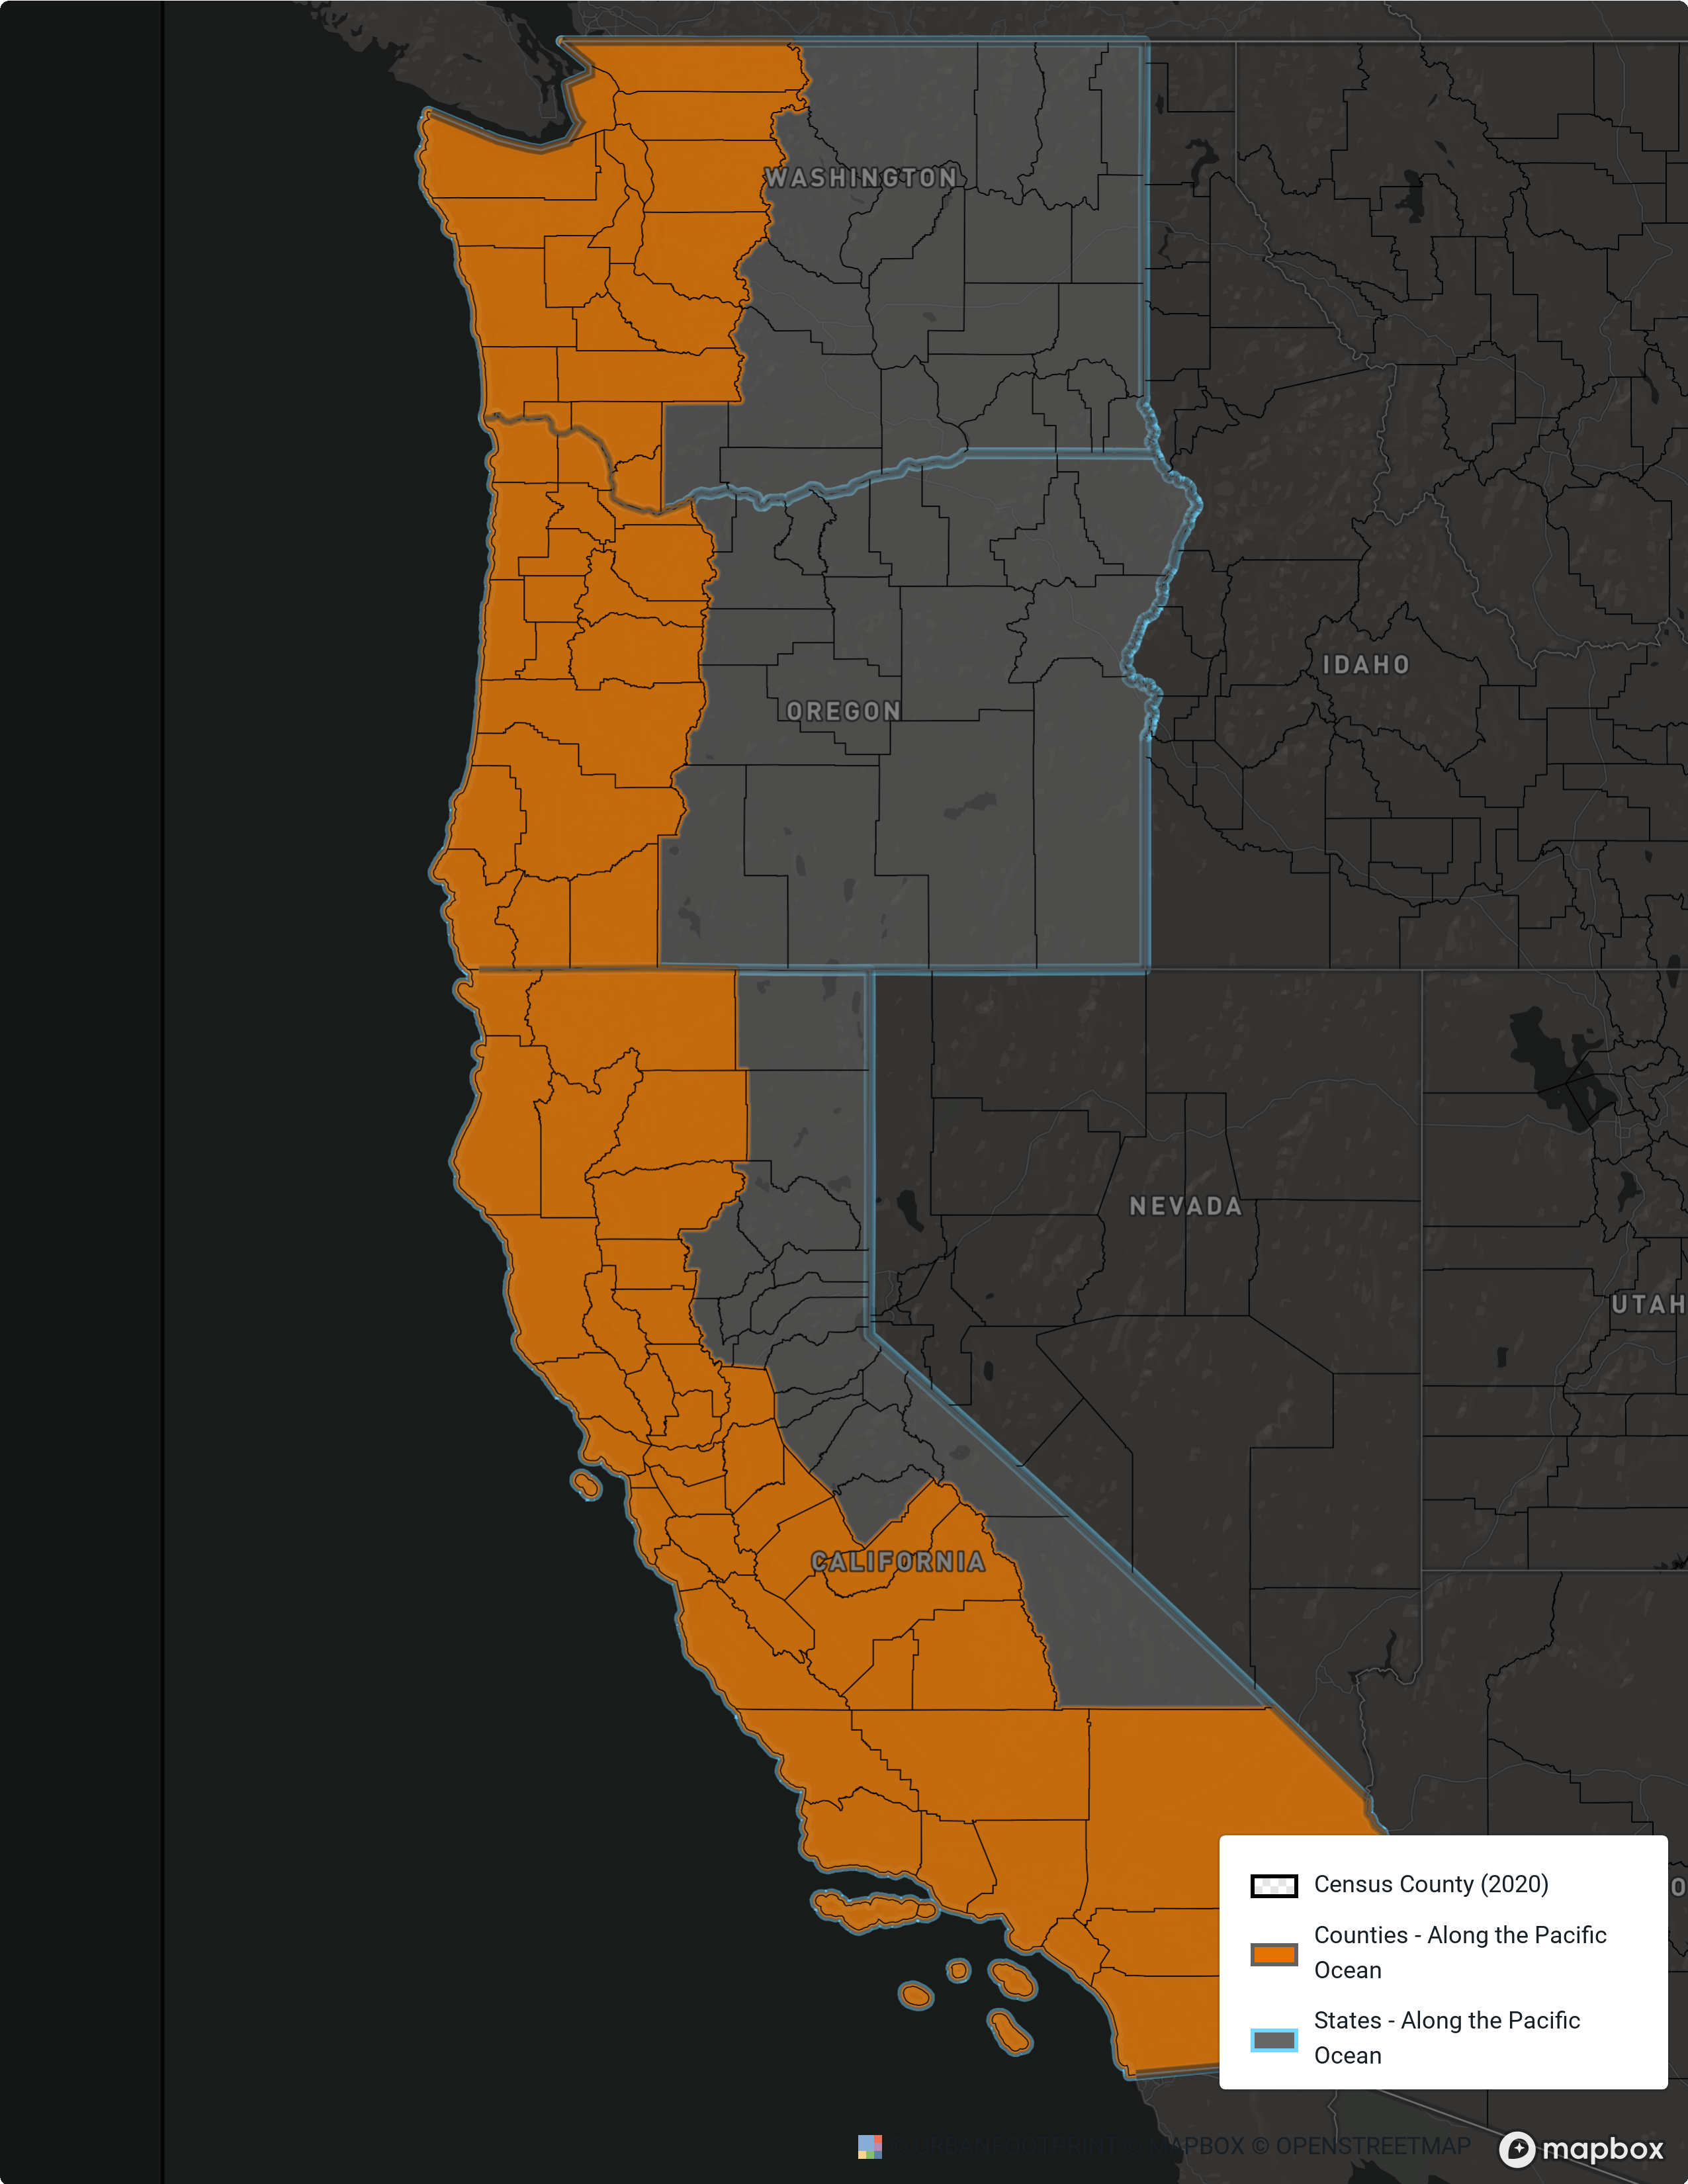
Examples of both the 3 States layer (States in blue/grey) and the multitude of Coastlines & Adjacent Counties (Orange/grey)