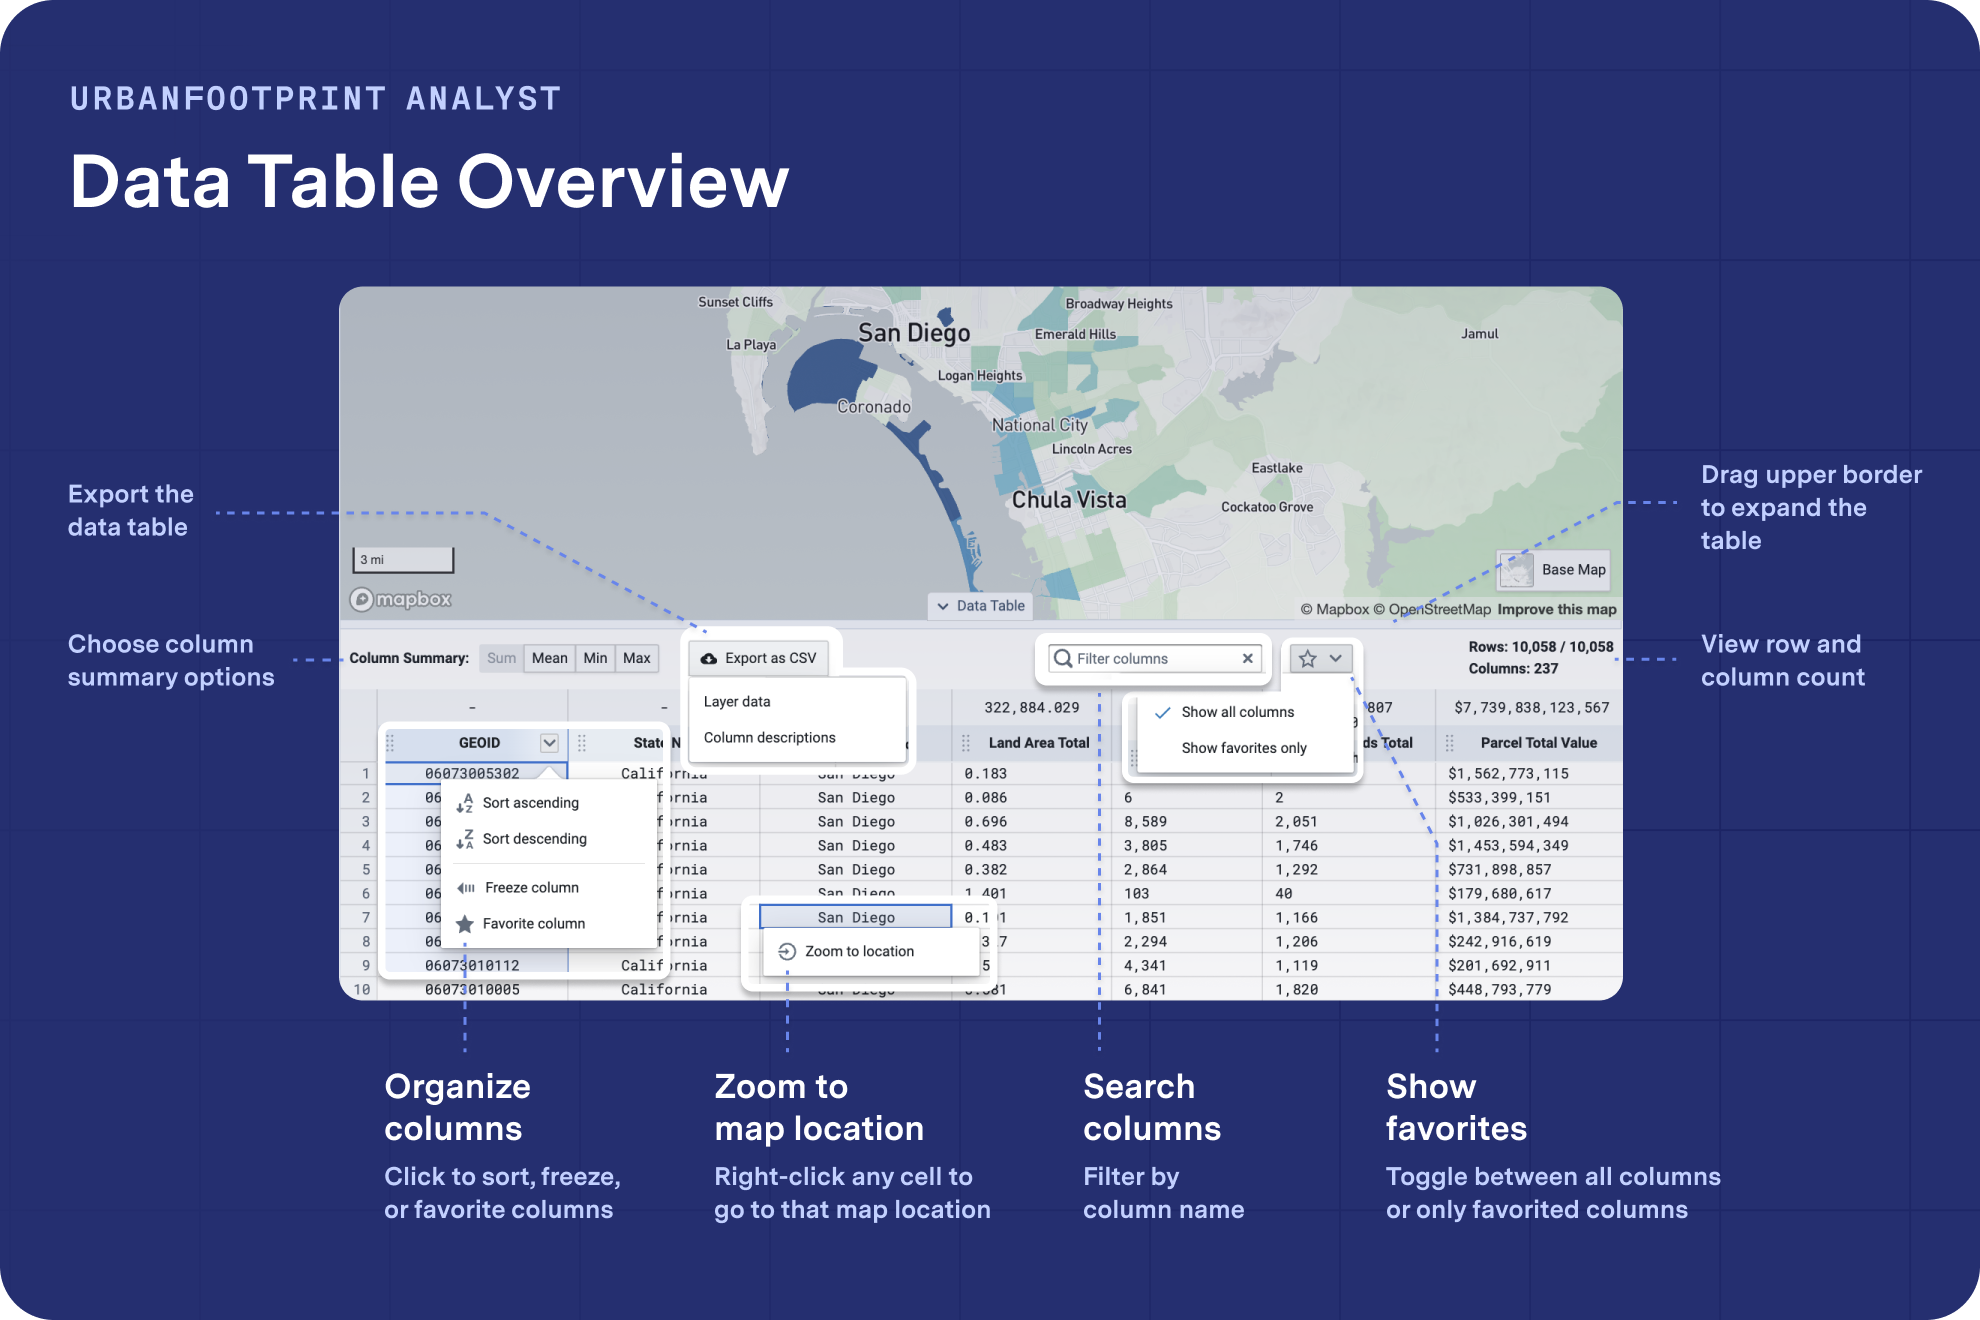
Use the Data Table
The data table for the active layer appears in a pane below the map view. The Data Table shows all attribute data for layer features, supporting data exploration, and tabular data calculations. You can display or hide the data table using the Data Table tab. Resize the data table by clicking and dragging the upper border of the table.
The data table shows data for the first 100 features in a layer, ordered according to the alphanumeric order of values in the first column. If you apply filters to the layer or manually select features on the map, the data table will show only selected features. To see more than 100 features, export the data table.
 |
View Column Summary Statistics
Summary statistics are displayed above the column names. You can display the complete set of summary statistics for a column by hovering over the statistics value or column name, and you can also copy the values to your clipboard. You can select any of the options to change the statistic type, which will be applied to all numeric columns. Options include:
Sum – The total of all values in the column.
Mean – The mean of all values in the column. Note that this is calculated as simple, rather than weighted, mean.
Min – The lowest value in the column.
Max – The highest value in the column.
Filter Columns
You can apply column filters to narrow the data table display to single or multiple columns by searching for a column name. The data table will show only those columns that contain the text entered into the column search box.
View Row Count and Column Count
The row count and column count are found at the top right of the Data Table.
Row Count - The row count includes two numbers. The first indicates the number of features selected, and the second indicates the total number of features in the layer. If you selected features by filtering the data layer or selecting them on the map, the number of selected features is reflected in the first number of the row count.
Column Count - The column count indicates the number of columns in the data table. If you filter for particular columns in the column search, the number of columns you see in the results is reflected in the column count.
Organize Data Table Columns
Organizing columns helps you highlight and compare data. These changes impact the information included when you export data.
Sort columns – Click
 and select Sort ascending or Sort descending to sort the table. Click the selected option again to turn off sorting.
Freeze columns – Click
 next to a column name and select
  Freeze column. Freezing a column keeps it in place so that it remains visible even when you scroll horizontally through the rest of the table, which allows you to compare column values more easily. This feature is also useful to apply to columns that help distinguish records, such as name or identifier columns.
Favorite columns – Click
 and select
  Favorite column. To see only your favorite columns, click the favorites drop-down and select Show favorites only. If you have favorited columns and you export data, the download will only include columns you've favorited or filtered.
Zoom to Map Location
Use Zoom to location to see a data table value reflected on the map. Selecting Zoom to location centers you on the feature.
Choose a feature in the Data Table that you want the map to zoom in on.
Either double-click the cell or right-click and select Zoom to location. This centers you on the feature on the map.
At this point, the data table still shows up to 100 rows for all the layer's features. Using a selection tool, select a feature on the map to make the data table only show that specific feature's row. Manual selection combined with Zoom to location allows you to toggle directly between the map and the data table.
Export Data Table
You can either export Layer Data as a CSV or export Column Descriptions as a CSV. If you have applied filters, favorited columns, or made manual selections on the map, the export of the Layer Data will include only the features in those selections. Otherwise, the export will include all features in the dataset.
Export as a CSV > Layer Data – Clicking this option exports the data table to a CSV file for use in Excel or a different spreadsheet or database application. Export the data to view and work with all the rows in the layer rather than just the 100-row maximum available to view in the data table.
Export as a CSV > Column descriptions – Clicking this option downloads column descriptions and additional information about the type of data available in the data table. This file doesn't contain any data, but it might help you better understand how to interpret the available data. These column descriptions can also be found in the layer's schema, located under Source in the Layer Details pane.