Create Projects
Project creation is the starting point for working in Analyst. You can create two types of projects:
General Location Analysis – Create a regional-scale project with access to core reference data and geospatial tools.
Land Use Planning – Create a site-specific project to propose and analyze land use scenarios using Base Canvas.
 |
Create a General Location Analysis Project
You can create a project spanning larger regional areas, including large cities and Metropolitan Areas and beyond using "General Location Analysis" projects.
These projects allow you to interact with core reference data in the Layer Manager and quickly answer location-based questions using geospatial tools to filter and join other reference layers together to build insights.
Note
Note that General Location Analysis projects will not:
Create Base Canvas or Parcel Reference Data layers.
Create Scenario Tabs or their Scenario Canvas layers.
Allow for access to Analyze mode.
If any of these functions are required for your work, use the Land Use Planning Project instead.
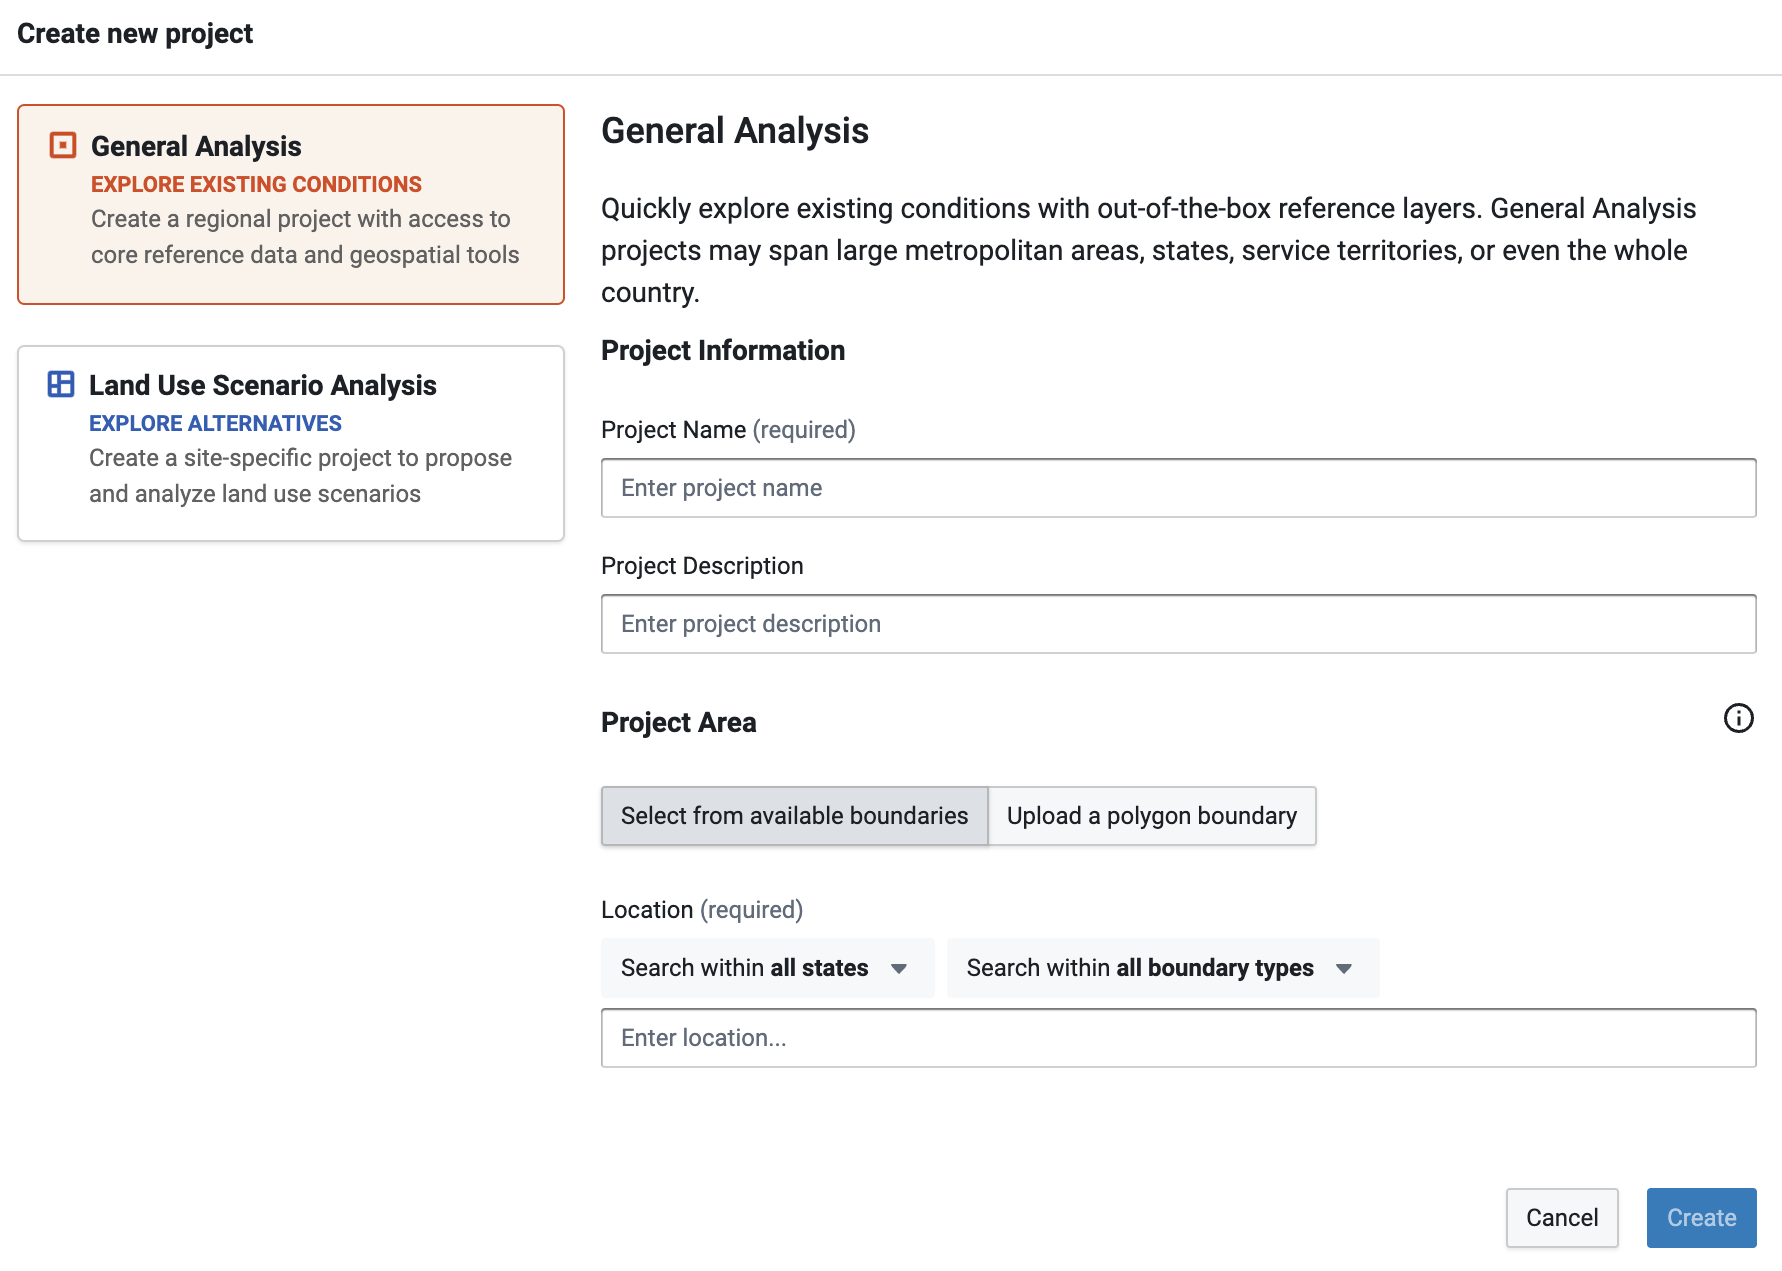
Click Create project in the upper right corner of the screen. The Create New Project window appears.
Click General Location Analysis on the left side of the screen.
Enter project information. The fields include:
Project Name – Enter a name for your project. (After the project is created, it is possible to change the name via Organization Settings if you have an Admin or Owner role.)
Project Description (optional) – Enter a description for your project. This will be displayed in your organization's Projects page.
Define your project area – You can select from available boundaries or upload a project area boundary. Project area boundaries can consist of multiple polygons.
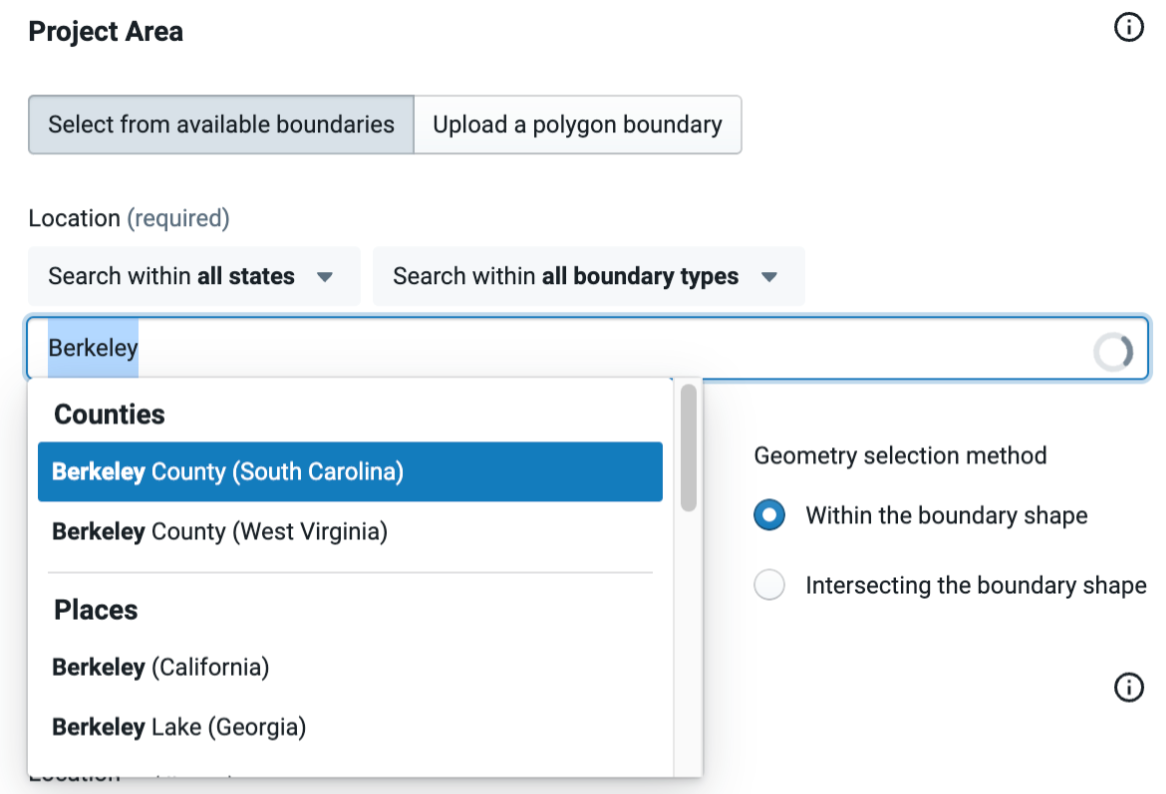
To select from available boundaries: Begin typing the name of your location in the Location field. Analyst will list available places (including cities, towns, and other census-designated places), counties, core-based statistical areas (CBSAs), congressional districts, municipal planning organizations (MPOs), school districts, and others, according to what you type.
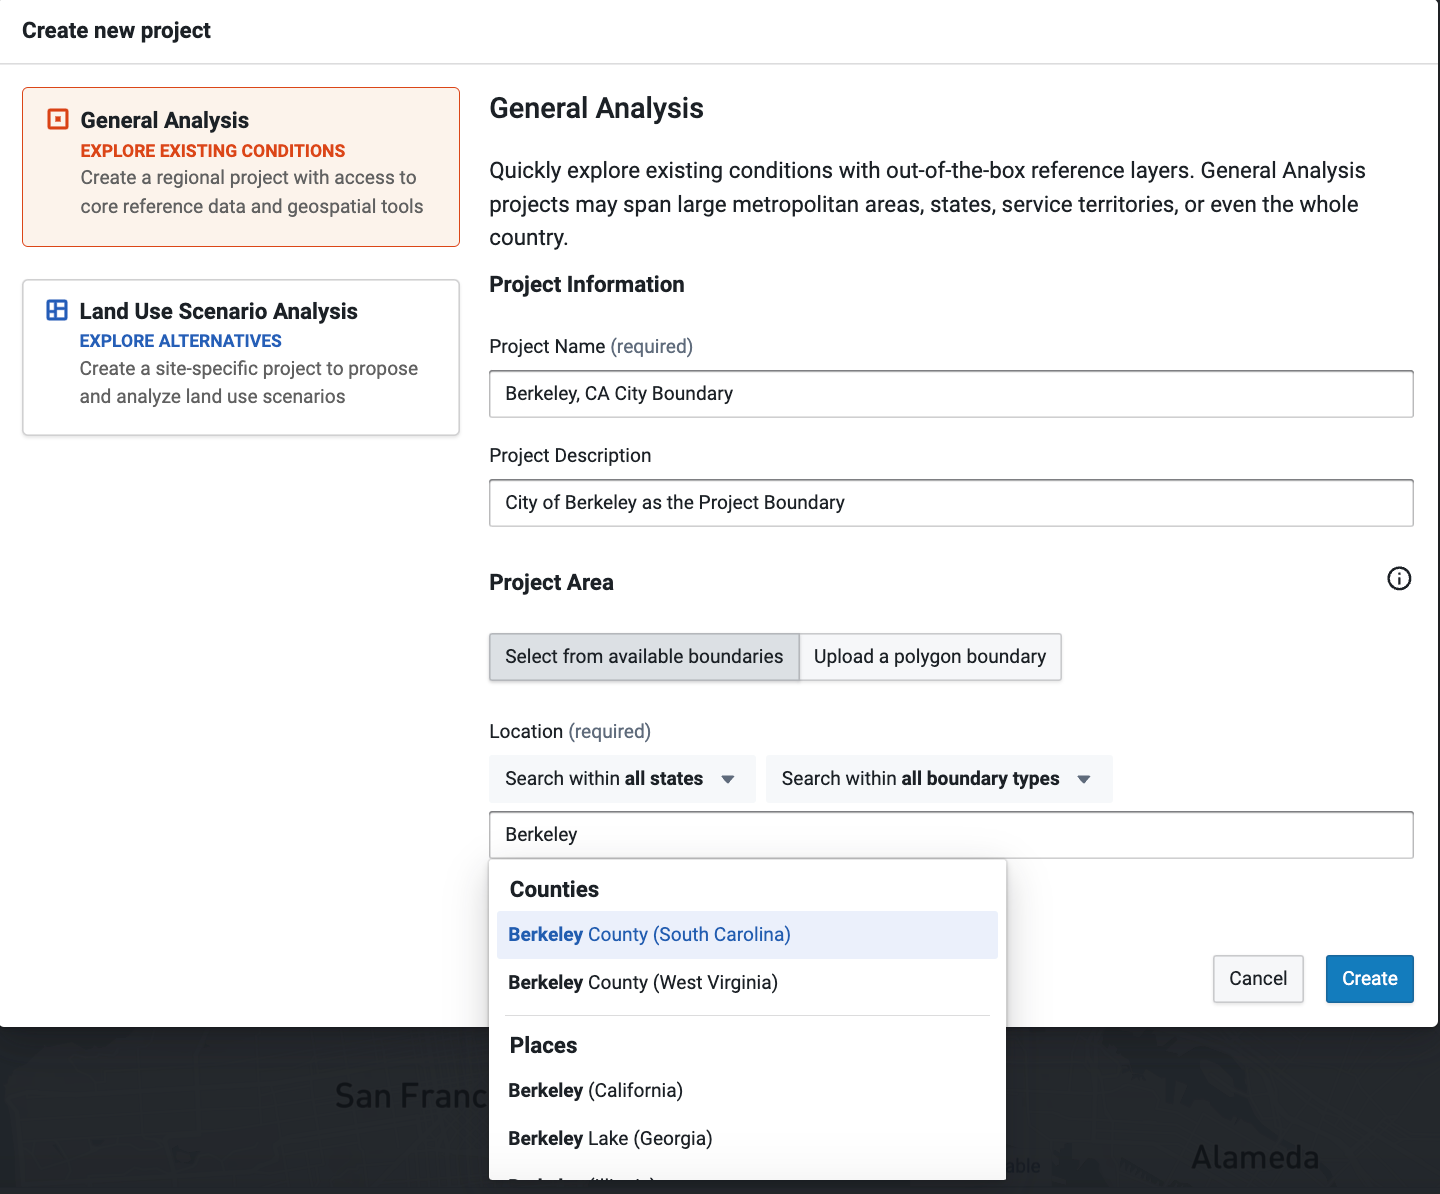
With no filter engaged, the list will contain all boundaries with "Berkeley" within them across the US
To filter the list further: use the Search within State and Search within boundary type options to locate the right boundary from each State and each Boundary Type.
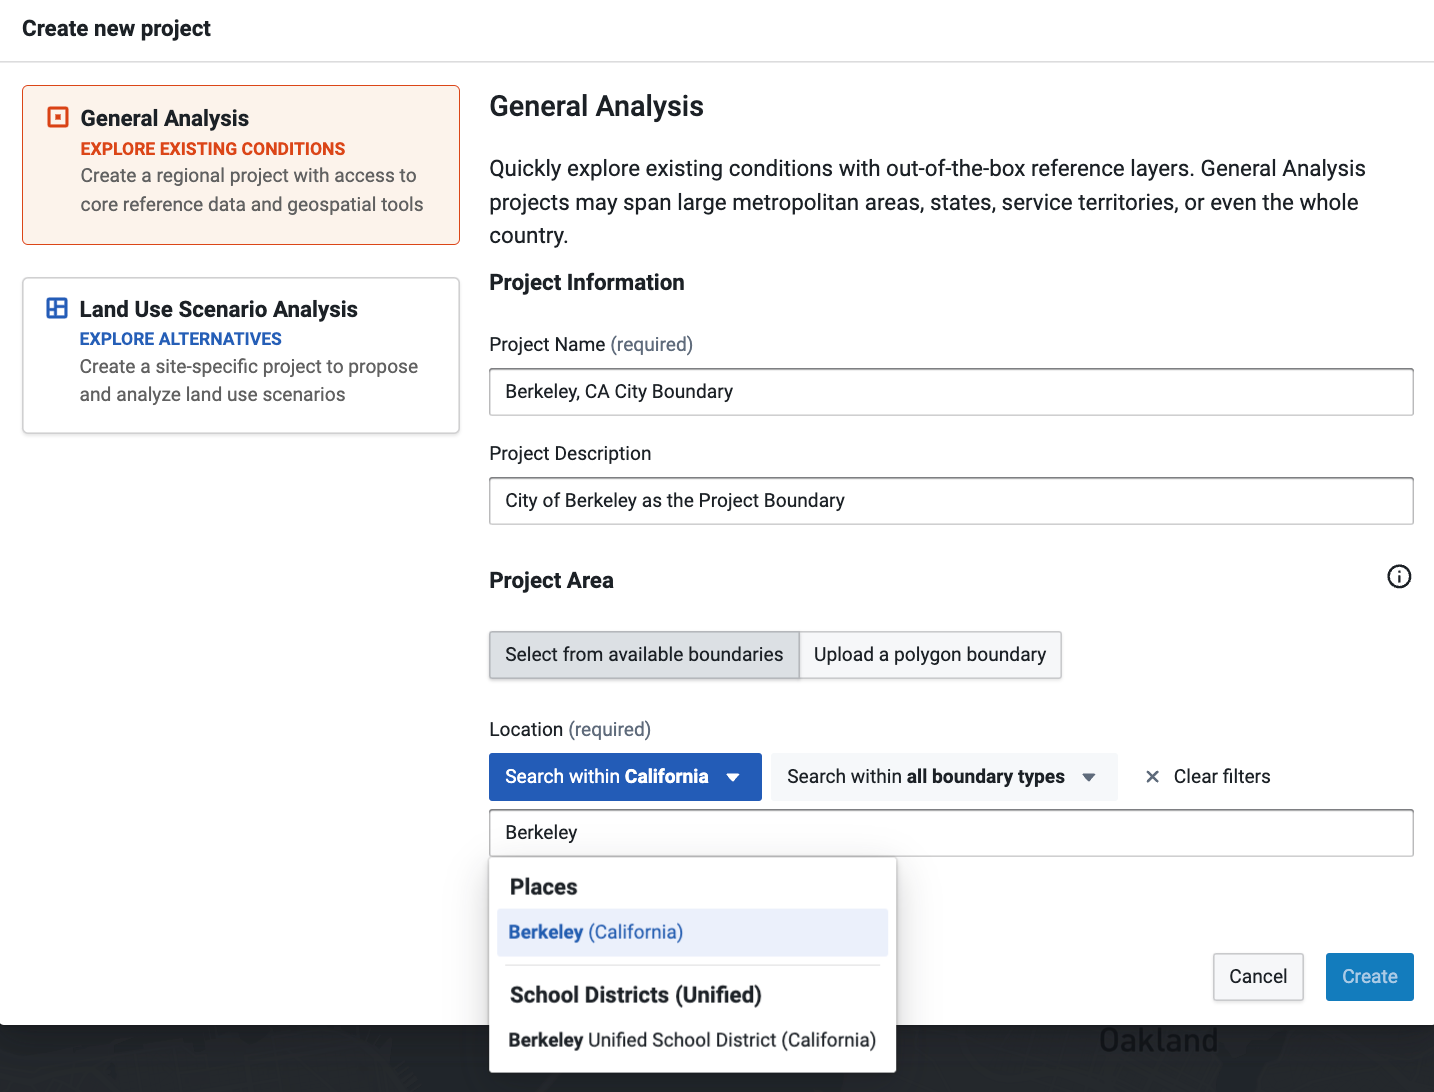
Engaging the Location filter will assist in finding the right boundary
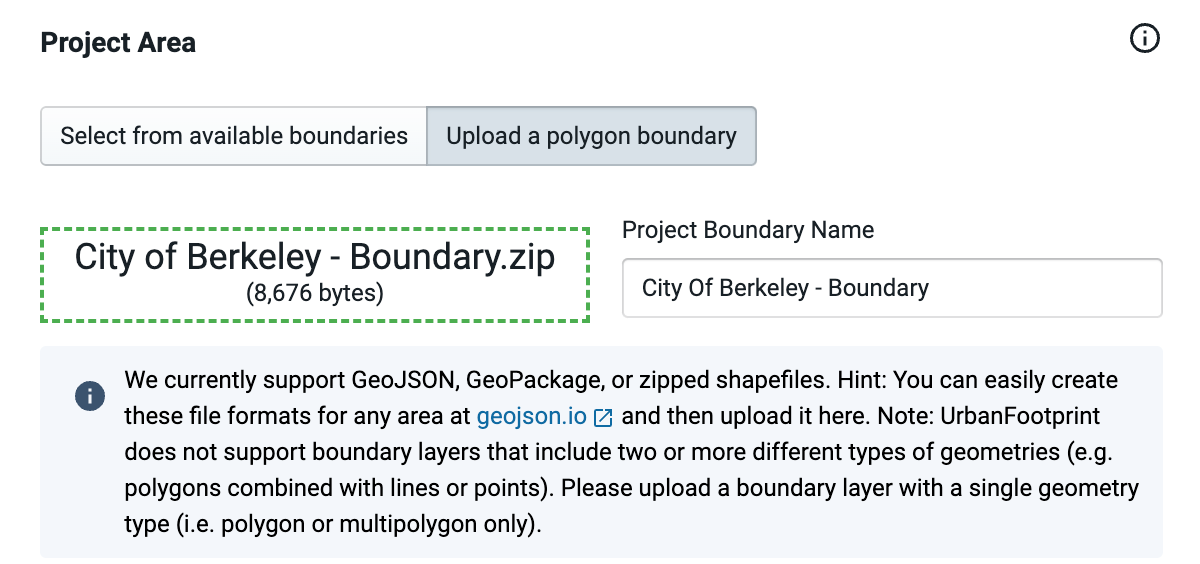
To upload and use a custom project boundary:
Select Upload a polygon boundary.
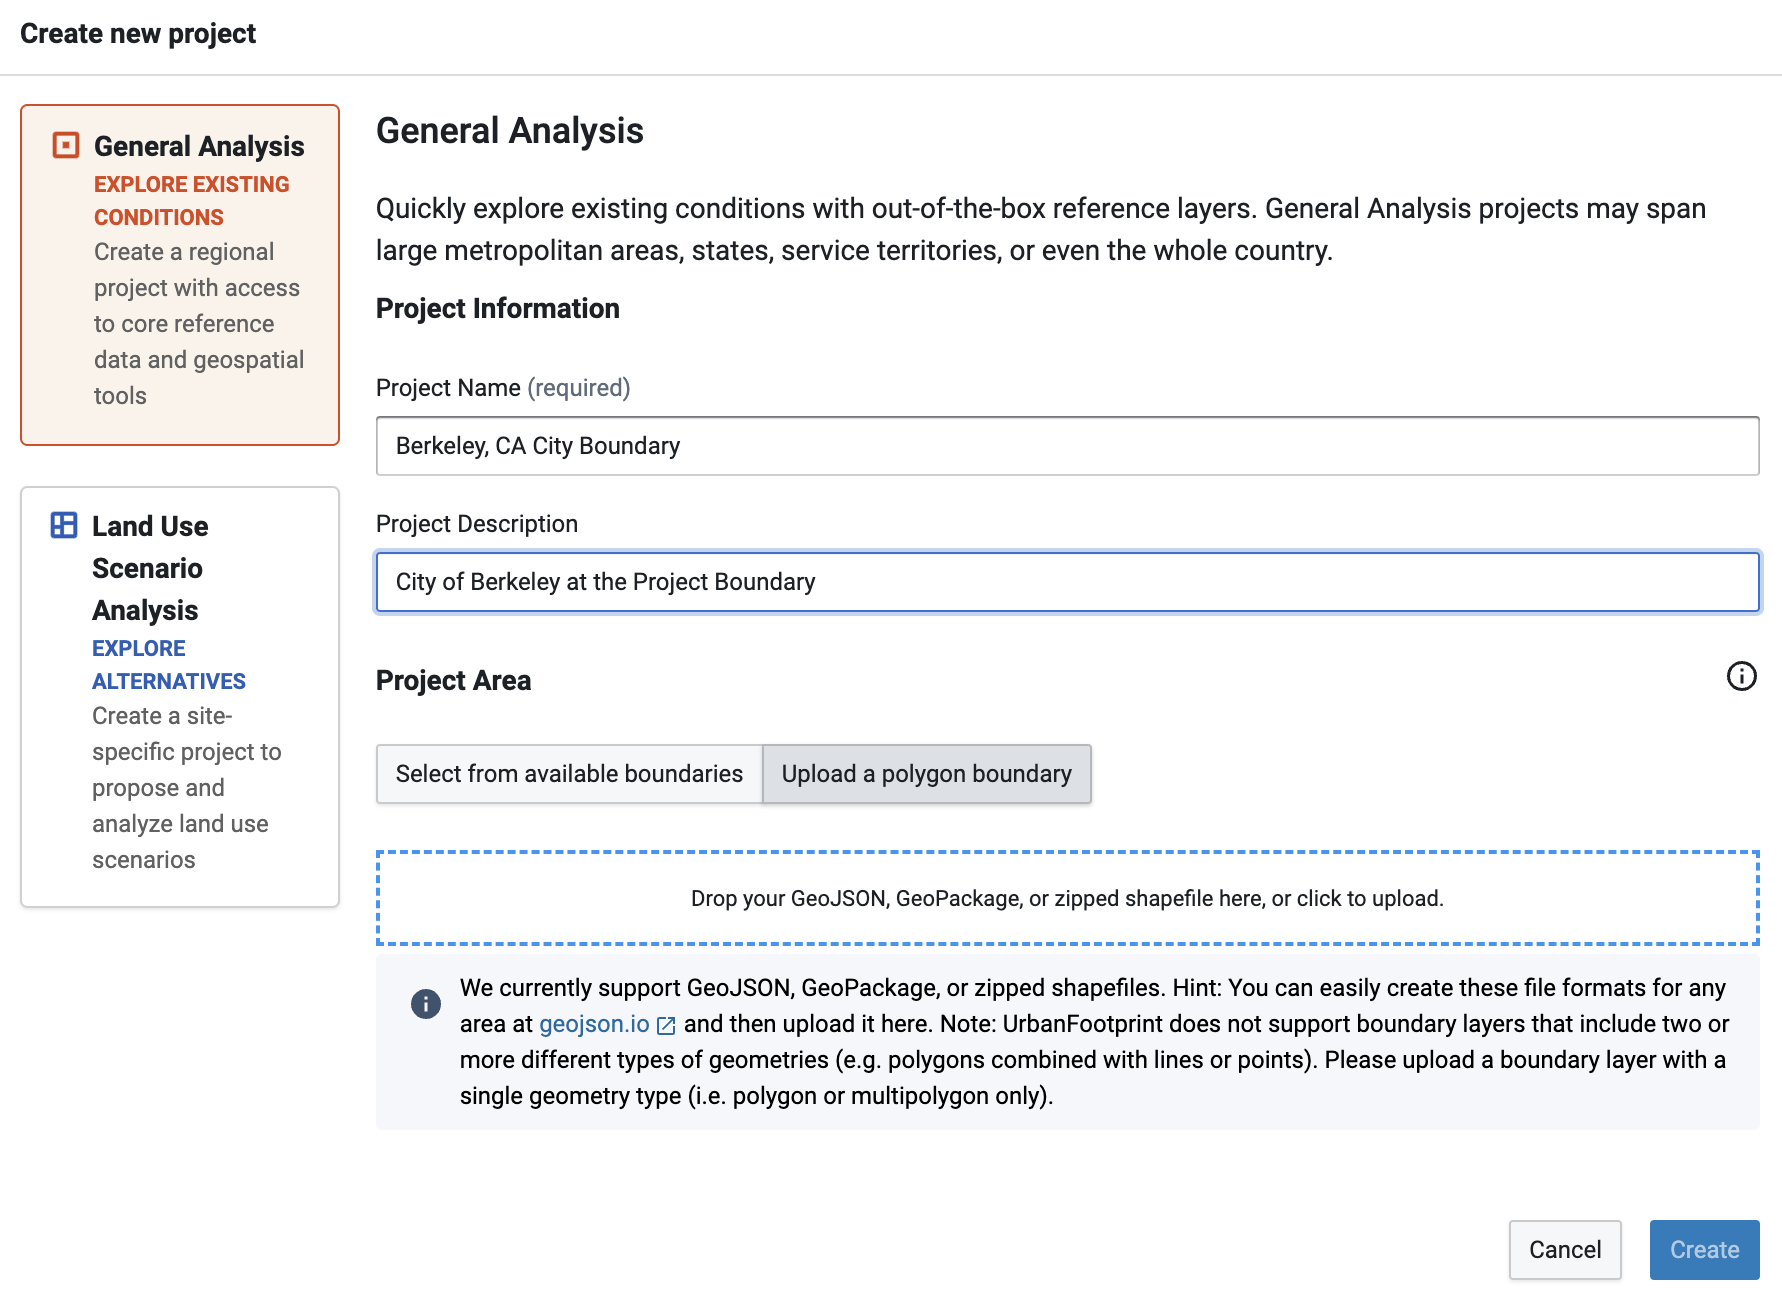
Then, drag and drop your polygon boundary file into the target area that appears or click within the target area to open your operating system's file browser and choose your file.
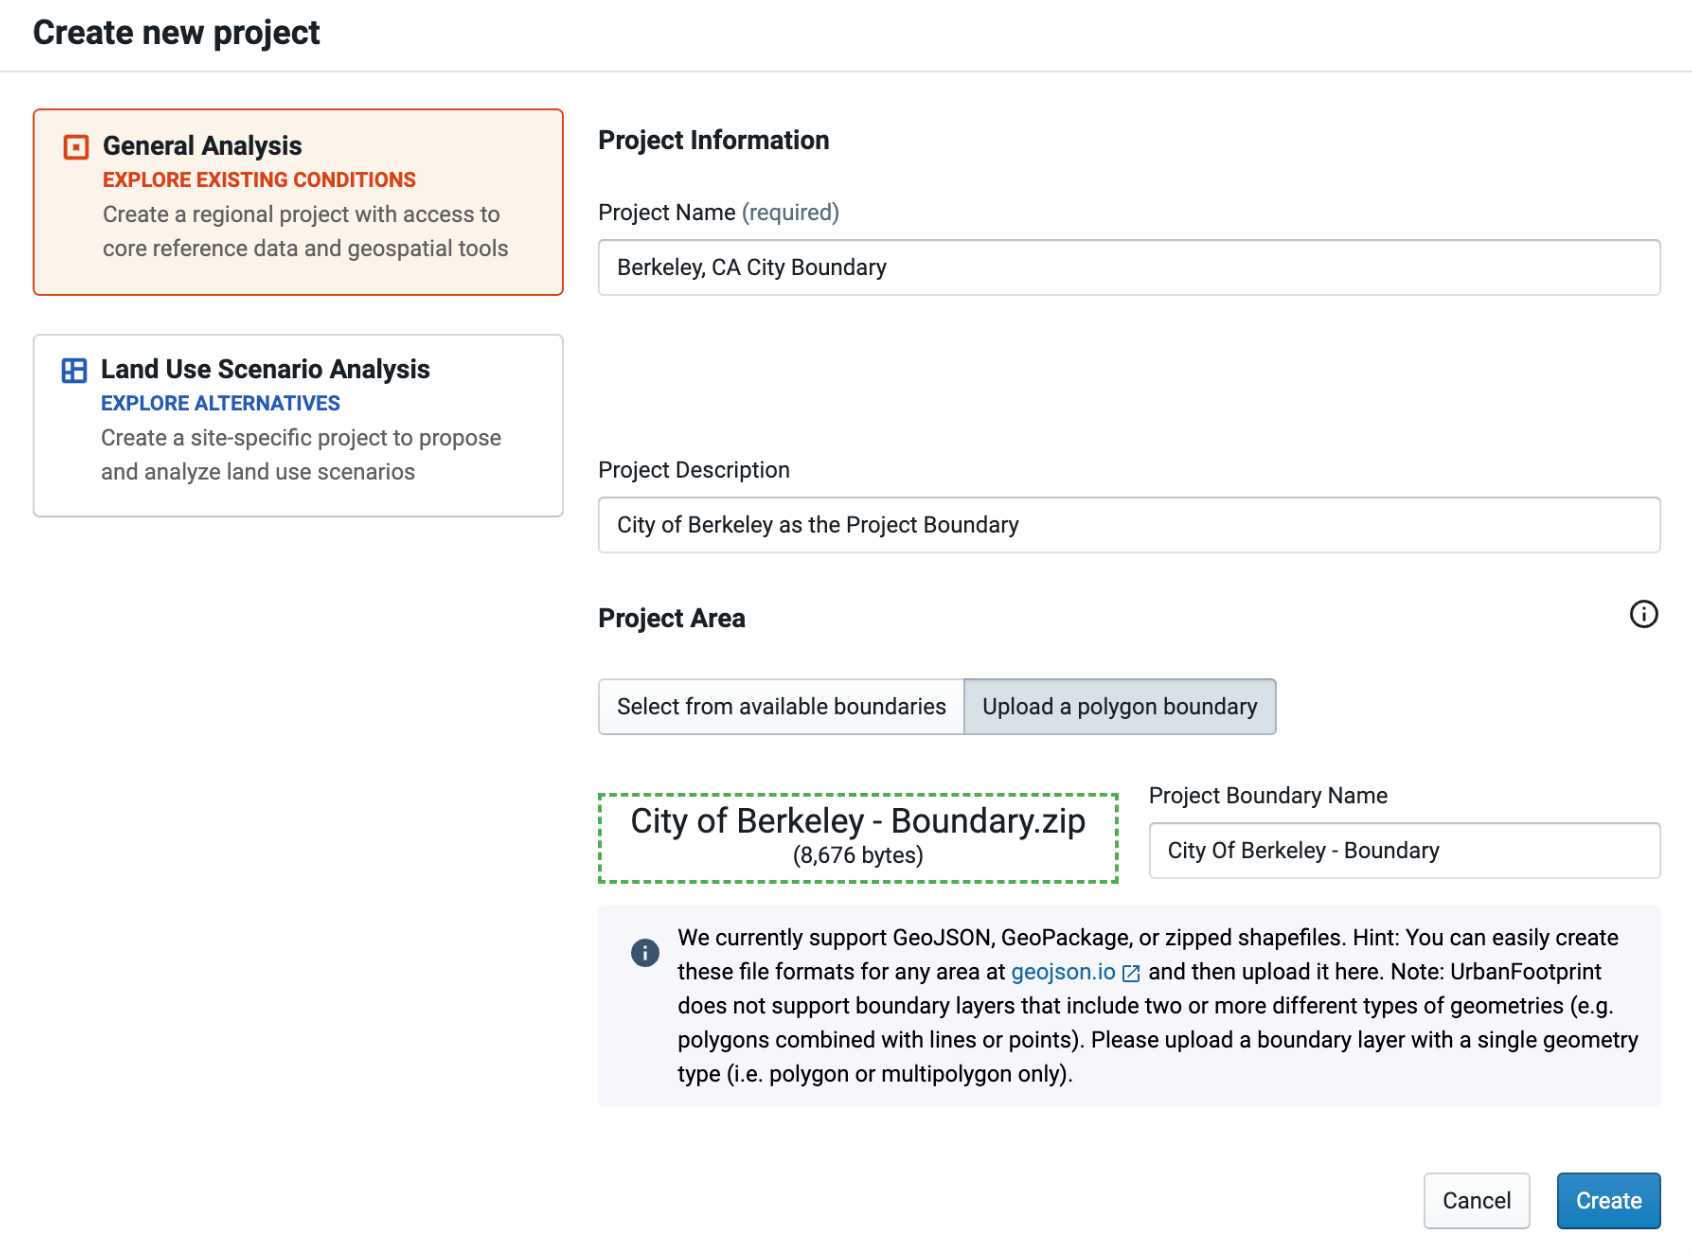
Note
You can easily create a polygon boundary in GeoJSON, GeoPackage, or zipped shapefile format at GeoJSON.io.
Click Create. Your project will be created. The time it takes will vary with the size of your project.
Create a Land Use Planning Project
Click Create project in the upper right corner of the screen. The Create New Project window appears.
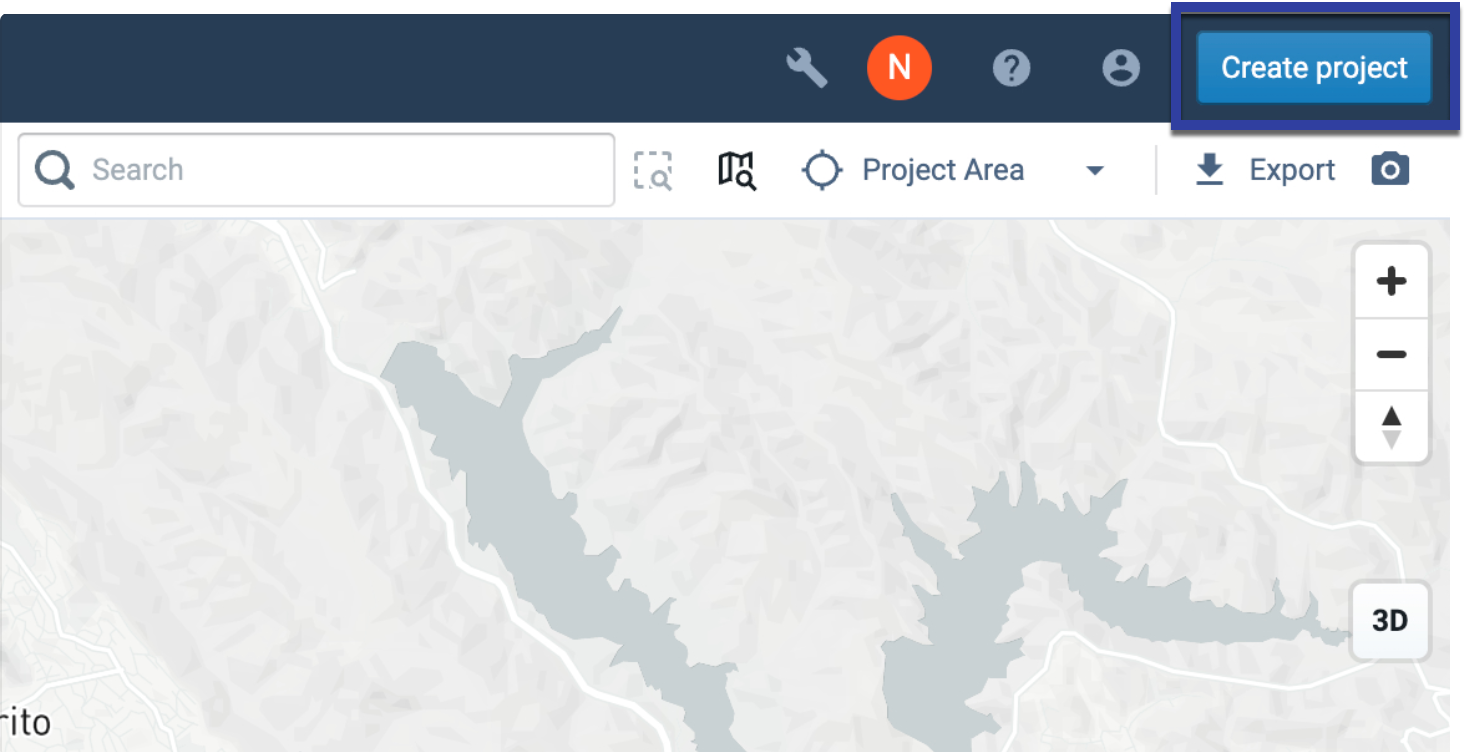
Create project button
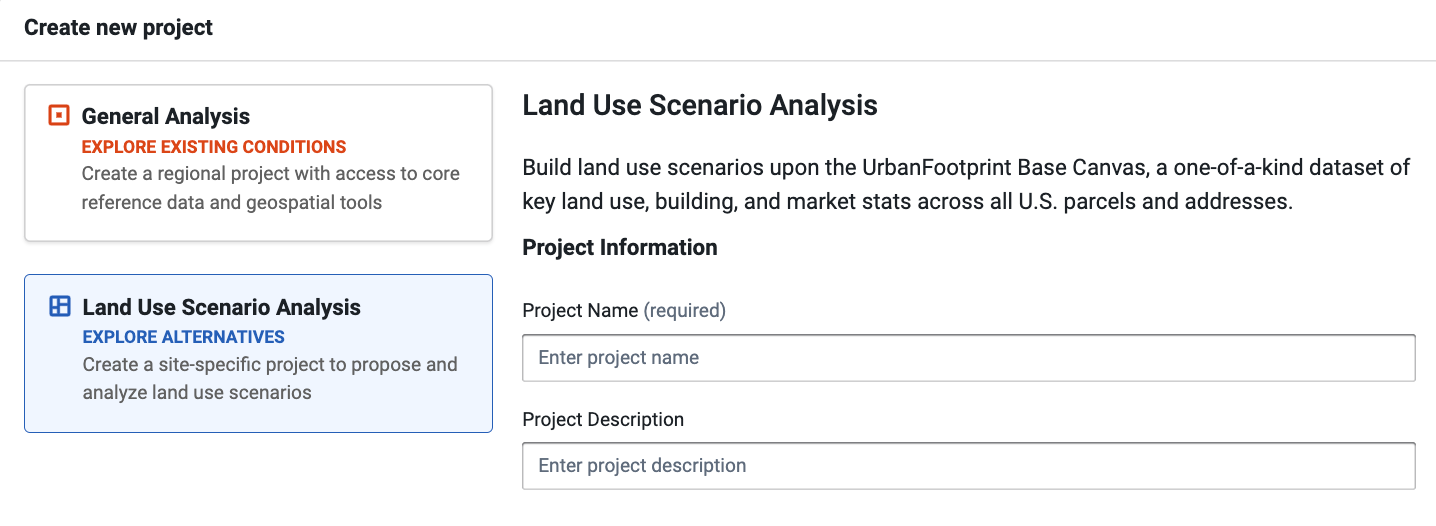
Click Land Use Planning on the left side of the screen.
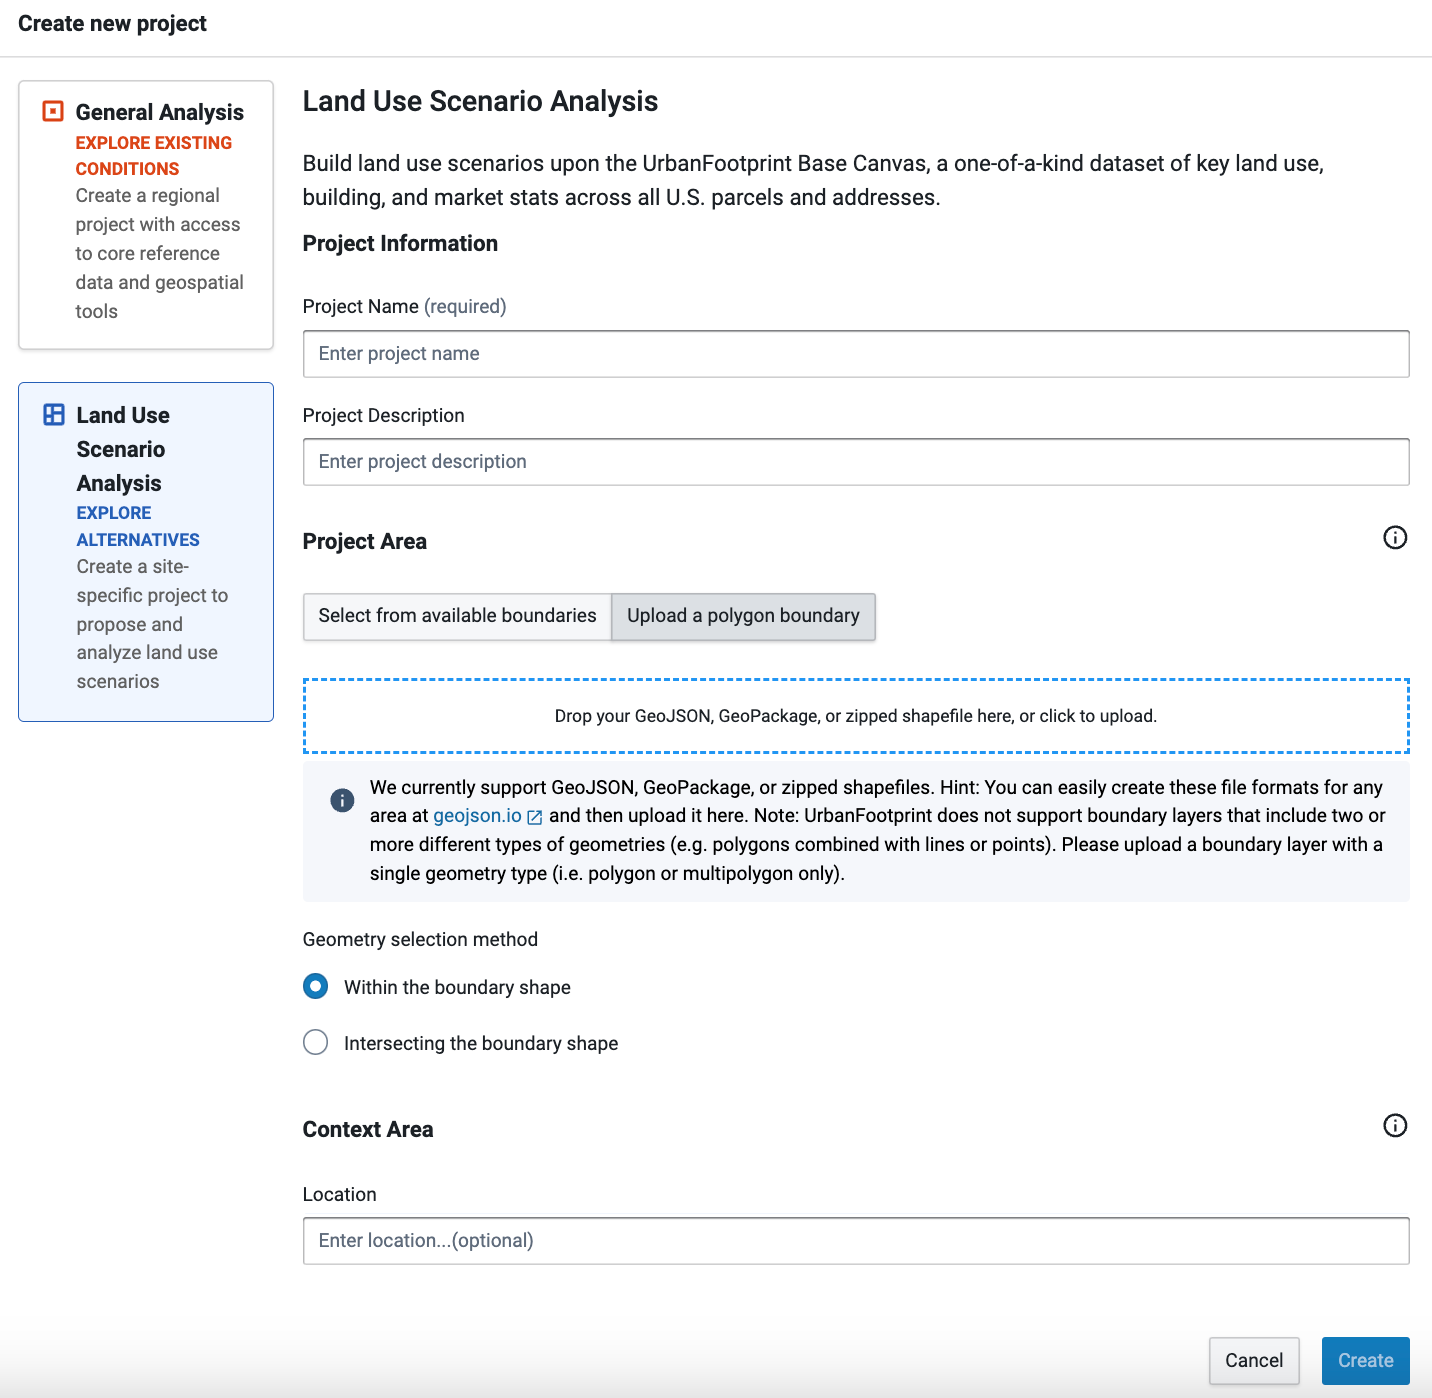
Enter Project Information. The fields include:
Project Name – Enter a name for your project. (After the project is created, it is possible to change the name via Organizational Settings if you have an Admin or Owner role.)
Project Description (optional) – Enter a description for your project. This will be displayed in your organization's Projects page.
Enter a project name
Define your Project Area. You can select from available boundaries or upload a project area boundary.
Project area boundaries can consist of multiple polygons. The maximum size is 50,000 km² or 350 tracts, whichever is smaller. If the land area or tract coverage of your selected or custom project area boundary exceeds the limits, a message will appear. If you need a larger canvas size, contact us for support or create a General Location Analysis project instead.
To select from available boundaries (the default option): Begin typing the name of your location in the Location field. Analyst will list available places (including cities, towns, and other census-designated places), counties, core-based statistical areas (CBSAs), congressional districts, municipal planning organizations (MPOs), school districts, and others, according to what you type.
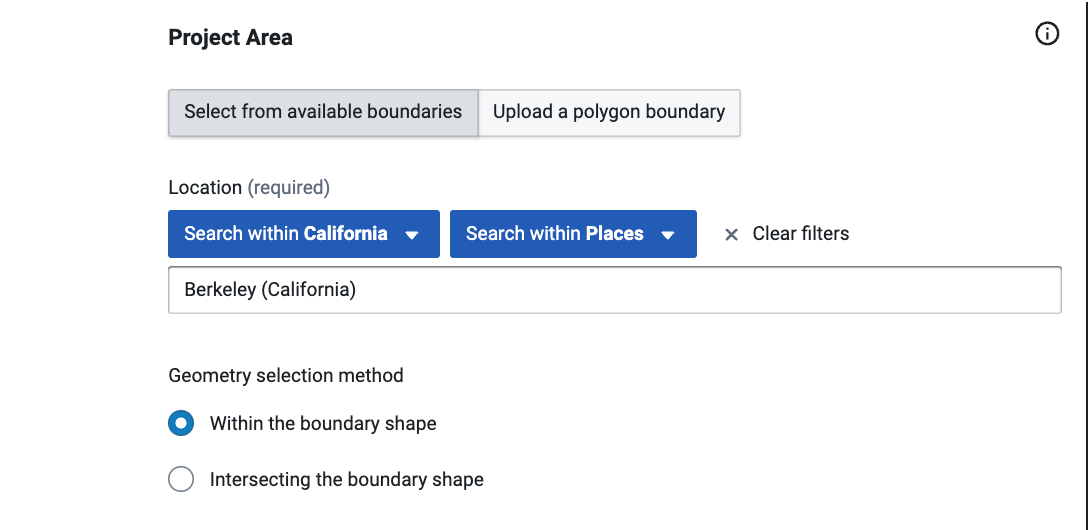
To filter the list down further: use the Search within State and Search within boundary type options to locate the right boundary from each State and Boundary Type.
Note
A project boundary cannot be changed once a project is created.
To upload a custom project boundary: Select Upload a polygon boundary. Then, either drag and drop your polygon boundary file into the target area that appears, or click within the target area to open your operating system's file browser and choose your file. Analyst supports GeoJSON, GeoPackage, or zipped shapefile format.
Note
You can easily create a polygon boundary in GeoJSON, GeoPackage, or zipped shapefile format at GeoJSON.io.
Select the Geometry selection method. You can choose two options for creating the canvas.
Within the boundary shape – Canvas will be made of parcels that are 100% within the Project Area Boundary and are determined by parcels centroid.
Intersecting the boundary shape – Canvas will be made with parcels that intersect with any part of the Project Area Boundary.
Select a Context Area for your project (optional). You can select from available boundaries. Begin typing the name of your location in the Location field, and Analyst will list available places (including cities, towns, and other census-designated places), counties, and core-based statistical areas (CBSAs) according to what you type.
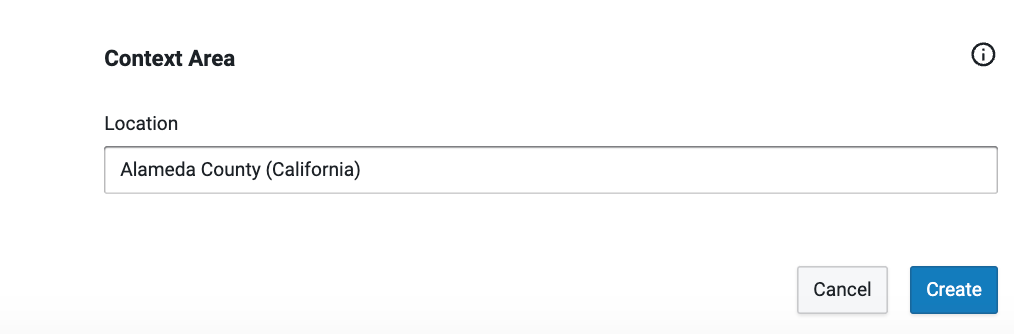
Adding an optional context area canvas
Click Create. Your project will be created. The time it takes will vary with the size of your project.
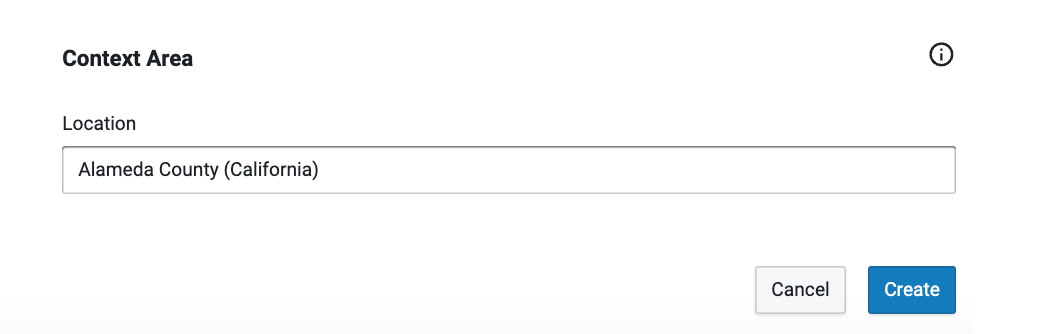
Selecting a Context Area type
Your newly created project will contain the following layers:
Base Canvas – The layer comprised of parcel features that describe existing land use and built form in terms of Building or Place Types and a number of quantitative attributes. For more information, see Base Canvas.
Project Area – A reference layer containing the boundary for the project area.
Context Area Land Use – Reference-only land use for a context area. Included only if a context area is defined.
Context Area – A reference layer containing the boundary for the context area. Included only if a context area is defined.
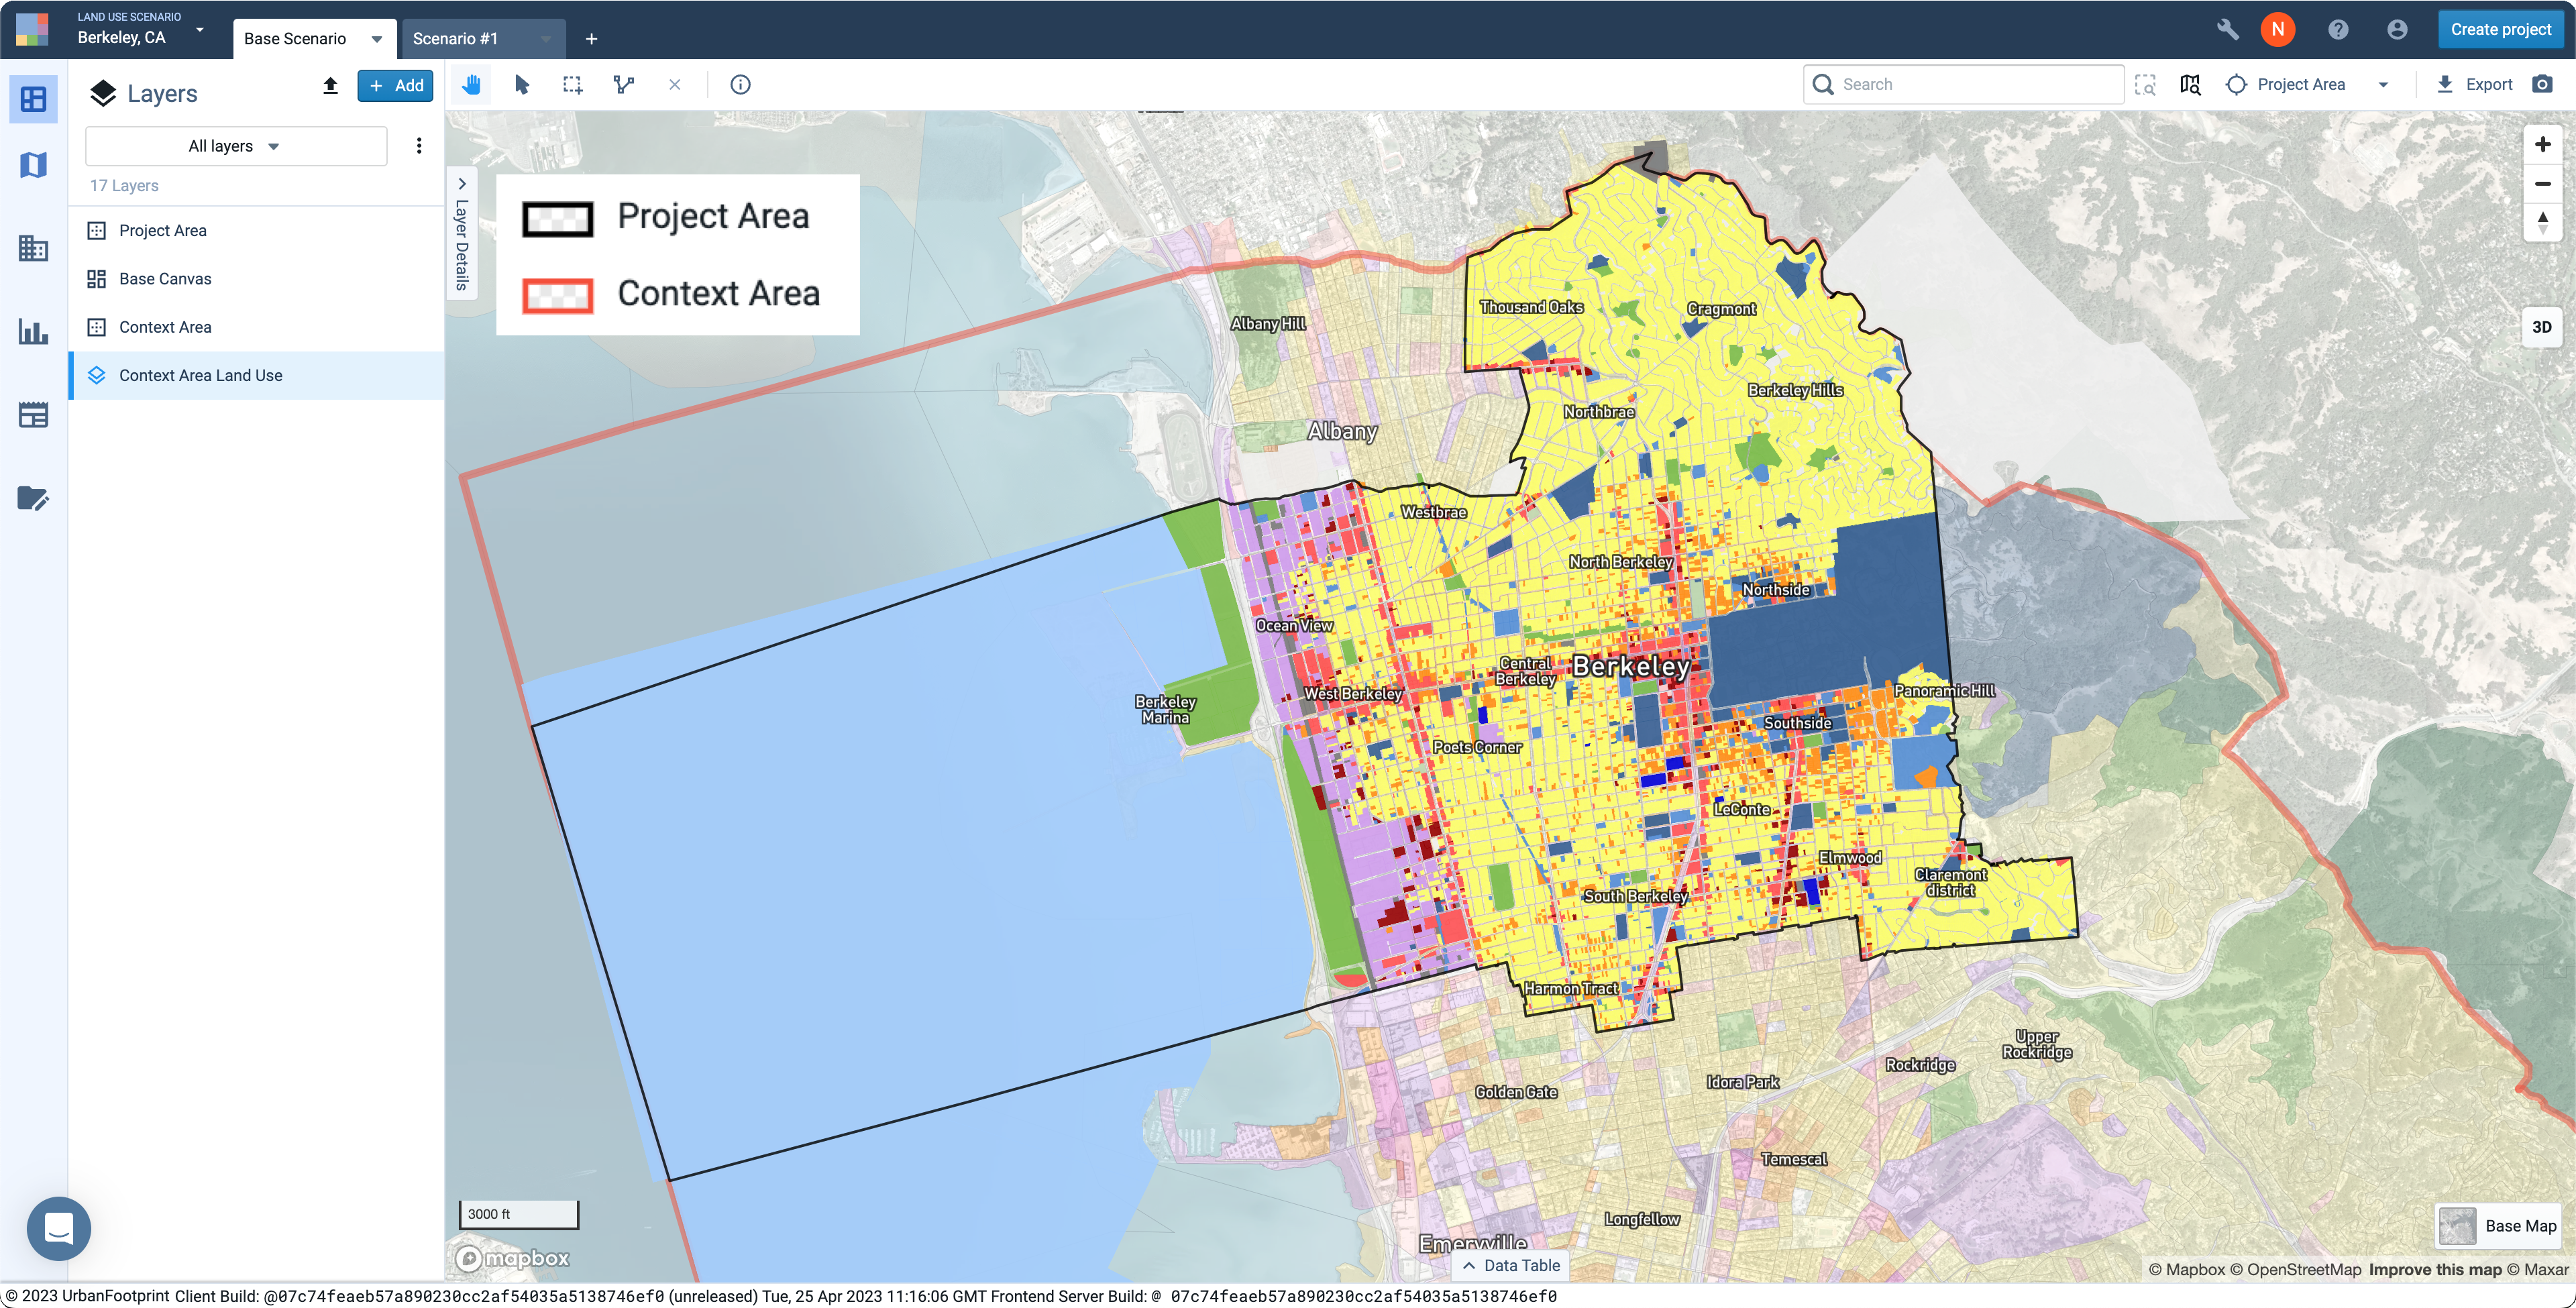 |
A project for Berkeley, California; including an Alameda county context area canvas
Land Use Scenario Project Basics
Define projects in terms of project area and context area.
In Analyst, all work is done within projects. A project contains scenarios, data, analytics, and reports that allow you to explore existing conditions and growth outcomes for a particular area. Projects are defined by an existing jurisdictional boundary or a custom boundary that you upload and can be defined at the parcel resolution.
Project Area
A project area is defined by a polygon boundary. All parcels within your project area boundary will be included in your Base Canvas and scenarios. Upon project creation, you can select from existing boundaries in Analyst or upload your own. Analyst will list available places (including cities, towns, and other census-designated places), counties, core-based statistical areas (CBSAs), congressional districts, municipal planning organizations (MPOs), school districts, and others, according to what you type.
You can instead upload your own boundary to represent, for example, a district or specific plan area. Whether you select an existing boundary or upload your own, project areas can contain one or more separate polygons.
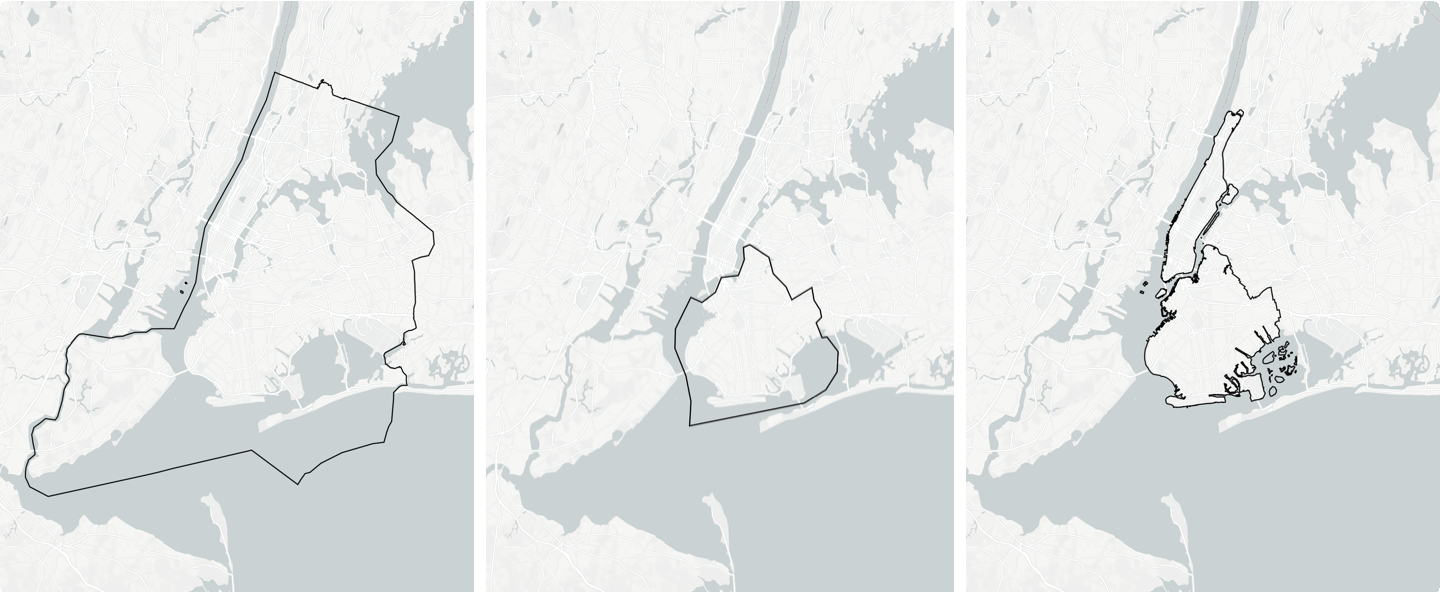 |
New York City boundary; Kings County boundary; multiple polygons for the boroughs of Brooklyn and Manhattan, including smaller islands
Note
Project sizes are constrained by land area and census tract coverage. For parcel canvases, the maximum size is 50,000 km² or 350 tracts, whichever is smaller. If you need a larger project size, please contact Analyst support or create a General Location Analysis project instead.
Context Area
Defining a context area for your project is optional. A context area, as the name implies, is used to provide context information for areas adjacent to or surrounding your project. A context area might be defined, for example, as the city within which a district-scale project is located, or the county within which a city-scale project is located.
If you specify a context area upon project creation, Analyst generates a layer called Context Area Land Use. The Context Area Land Use layer contains the same attributes as a Base Canvas, but cannot be edited or painted on — the layer serves as reference data only. The population, households, jobs, and development associated with the context area are not included in project totals, and analysis does not cover the context area.
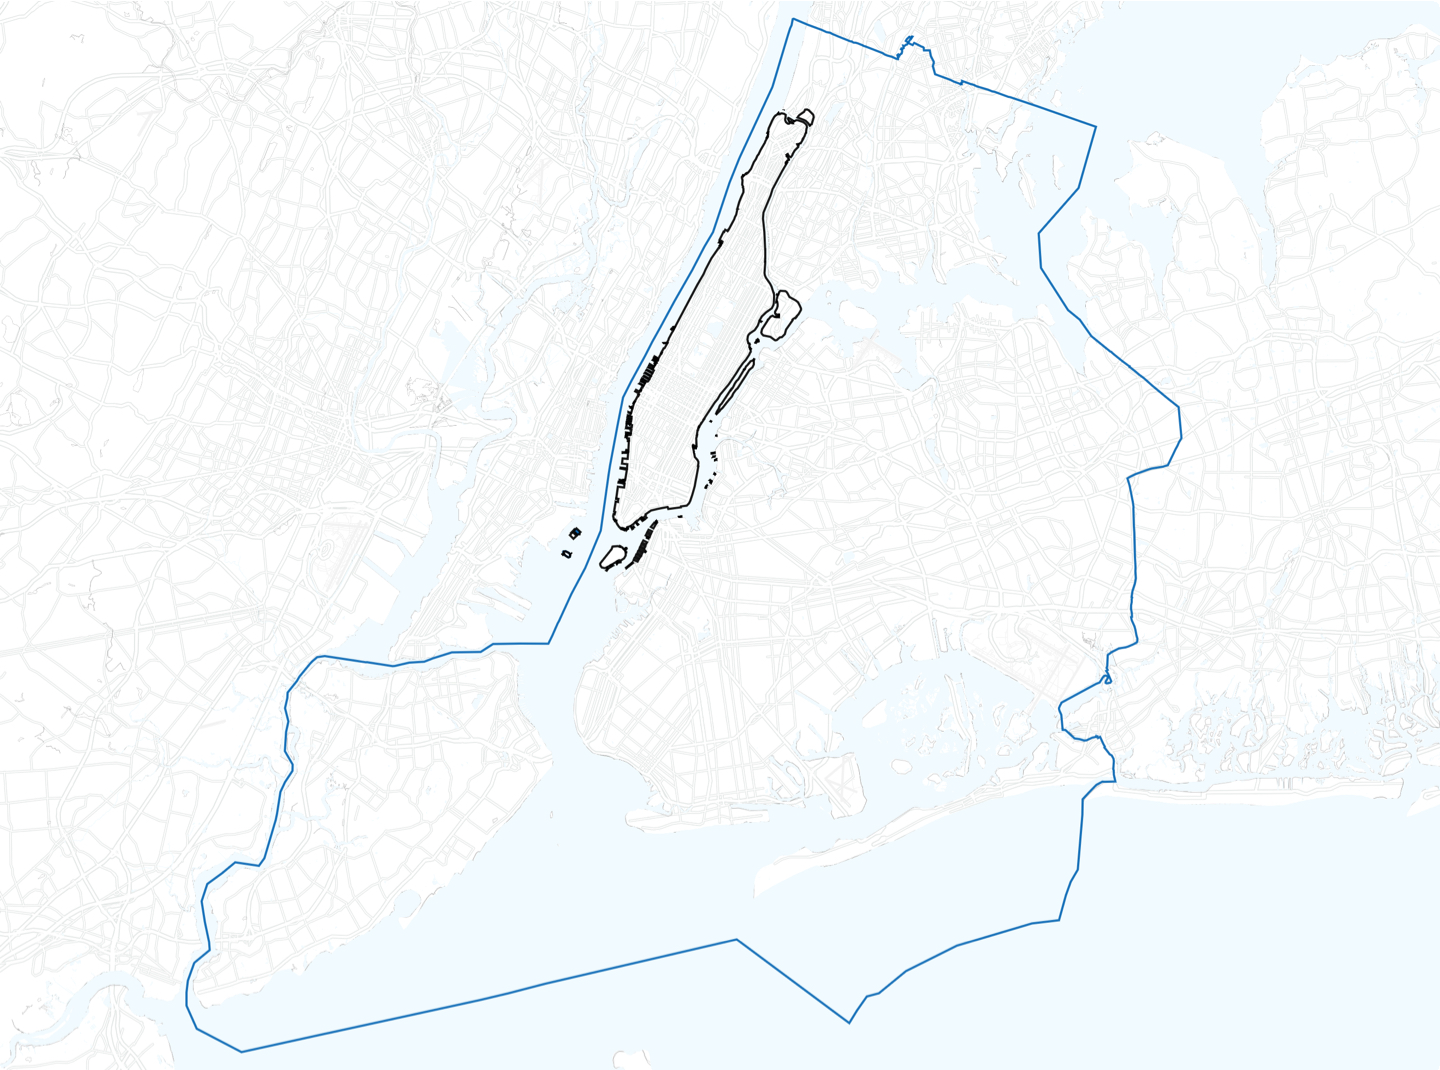 |
Project area surrounded by larger context area