Manage Analysis Inputs
Analysis module parameters are variable input assumptions used to localize analysis and test technology or policy-based targets into the future. Parameters can be varied by scenario, allowing you to test different configurations of assumptions in concert with land use alternatives. Each module comes loaded with a set of default assumptions, which can be changed based on your own data sources.
Analysis Module Parameters Manager
The Analysis Module Parameters Manager is accessed via Manage mode. You can use the manager to view, edit, and export parameters. Click the Analysis Modules tab to open the manager.
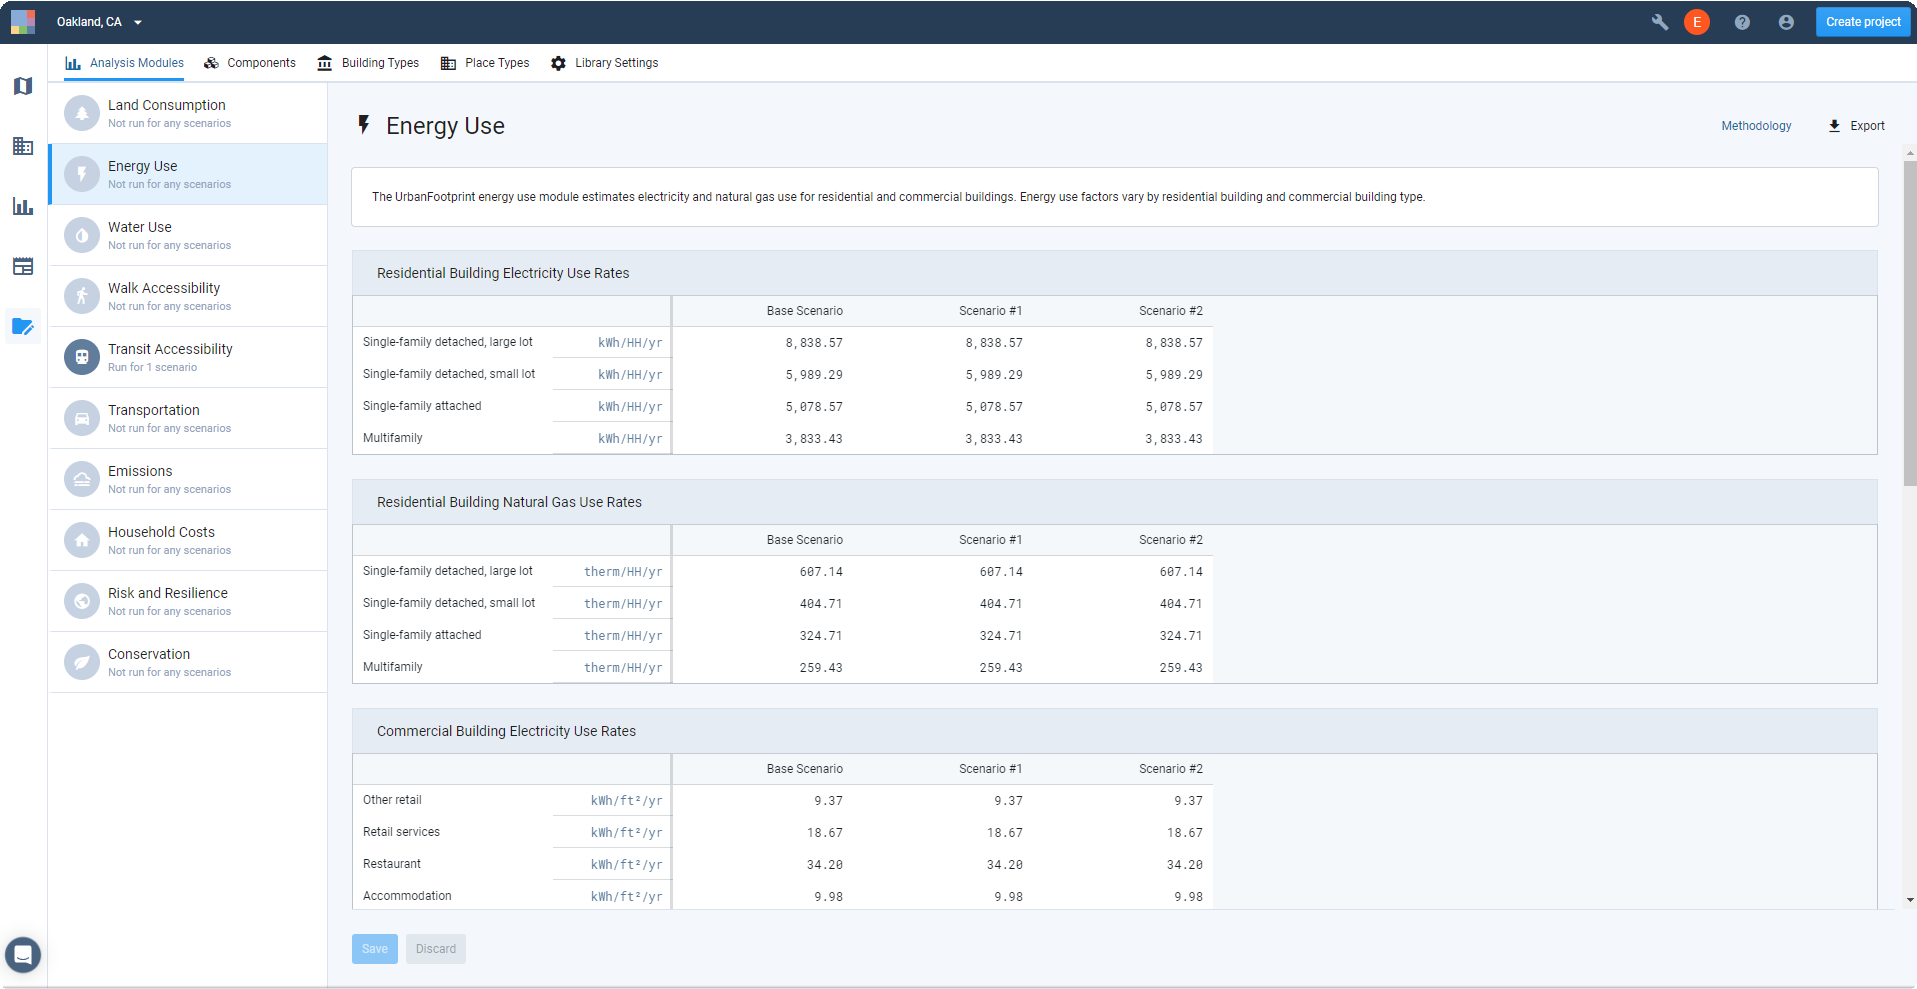 |
View of the Analysis Module Parameters Manager
Along the left side of the screen you'll see a list of the analysis modules. Selecting a module brings up its parameters, grouped by type, with values for each scenario organized into columns. At the top right of the screen are controls to access methodology documentation and export a table of parameter values for the current module.
Parameters
Hovering over the names of the parameters and/or parameter group names (for example, Residential Building Electricity Use Rates) brings up their descriptions. The unit for each parameter is indicated alongside the parameter name. The default units may not be edited.
Parameter Values
Upon project creation, all modules are populated with default values. Defaults are the same for all scenarios, including the Base Scenario. The values may represent data differentiated by climate zone, region, or state, or may apply nationally. For more information about the default parameters used for specific modules, refer to the analysis module methodology documentation.
You can edit any parameter values by double-clicking them and entering new values. If edited, parameter values show up in blue text. Values can always be reset back to the defaults, by group (as shown below for Residential Building Natural Gas Use Rates). Values can also be copied from one scenario to another, by group, using the Copy Values control.
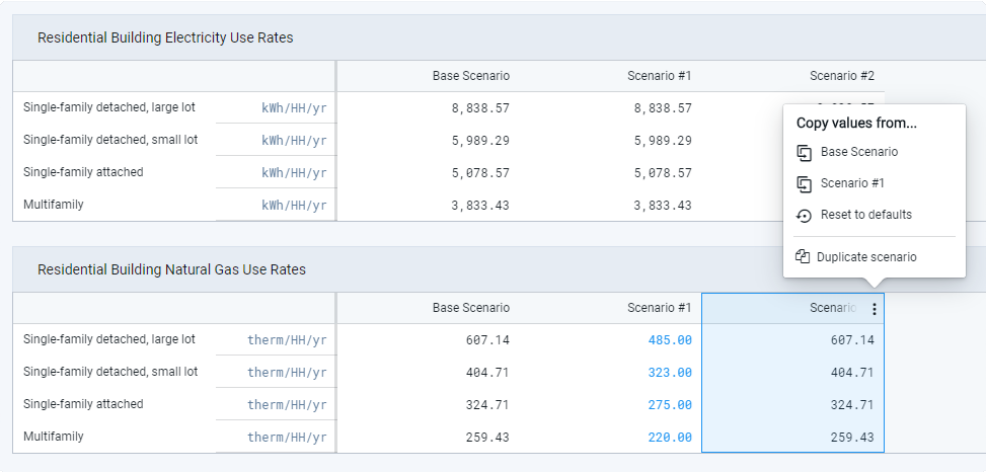 |
Energy Use module parameters
Values must be saved to be applied. Updating values will render any existing analysis runs for the affected module and scenario(s) out of date.
Policy Scenarios
Scenarios may be used to compare the impacts of technological or policy-based changes alone—for example, you may compare the energy use impacts of compact growth coupled with parameters to reflect modest improvements in energy efficiency as compared to strong improvements in energy efficiency as supported by aggressive policy targets.
From this screen, you can create a new scenario as a copy of an existing scenario using the Duplicate scenario option. This will duplicate the land use and analysis module parameters of the selected scenario. From there, you can edit parameters to differentiate the scenario.
Module Dependencies
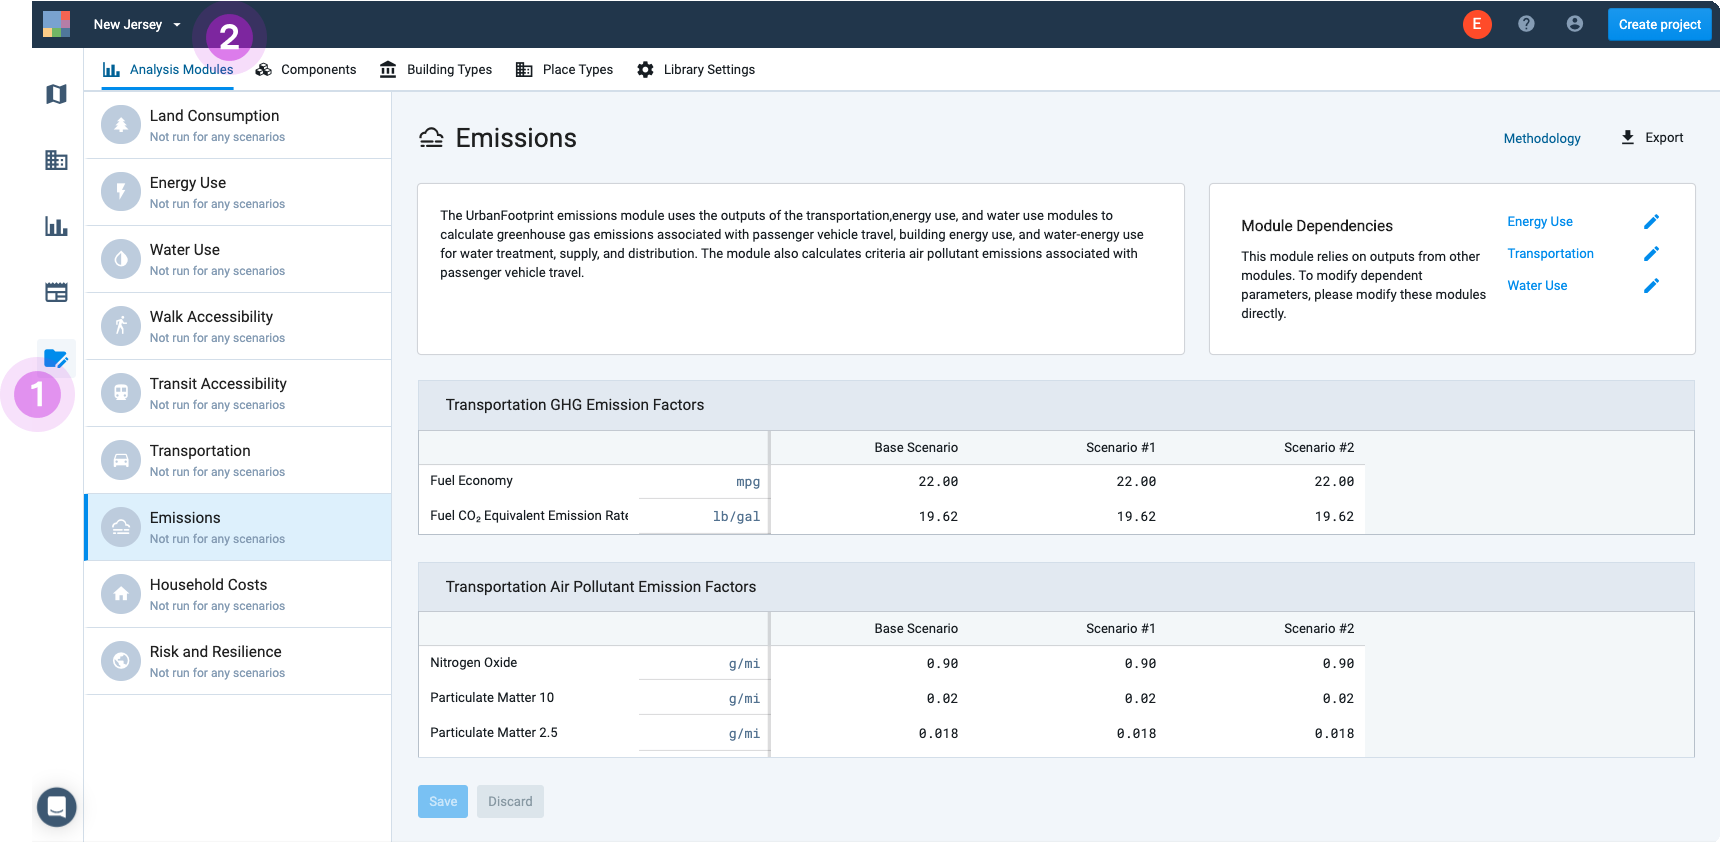
While all modules are run independently, some modules rely on output from other modules. For example, carbon emissions are calculated based on energy use, water use, and transportation. In this and other cases, the parameters management screen will contain links to the other modules.
 |
Module dependencies are noted where applicable
Set Analysis Module Parameters
Enter Manage mode by clicking the Manage mode button
 in the Mode bar. The Manage mode screen appears.
Click the Analysis Modules tab, if it is not active already. The Analysis Module Parameters Manager appears.
Analysis Module Parameters Manager
Select a module from the list at left. The parameter screen for the module appears.
Double-click on values to edit them. Manually enter or adjust values as needed. Edited values appear in blue text.
Editing parameter values
Click Save to save your edits. Otherwise, click Discard to revert values to their previous state.
Run (or re-run) the analysis module to see results. Changing the analysis parameters of a scenario renders any previous analysis as out of date. The module must be run again to apply the new parameters.
To save a copy of the analysis assumptions, click the Export button
 in the upper right corner of the screen. An Excel spreadsheet containing the current module's analysis parameters for all scenarios is downloaded to your computer.
Reset parameter values back to their defaults
Hover over the header for a group of values in a scenario and click the Expand menu button
 that appears.
Select Reset to defaults. The selected group of parameter values are reset to the defaults.
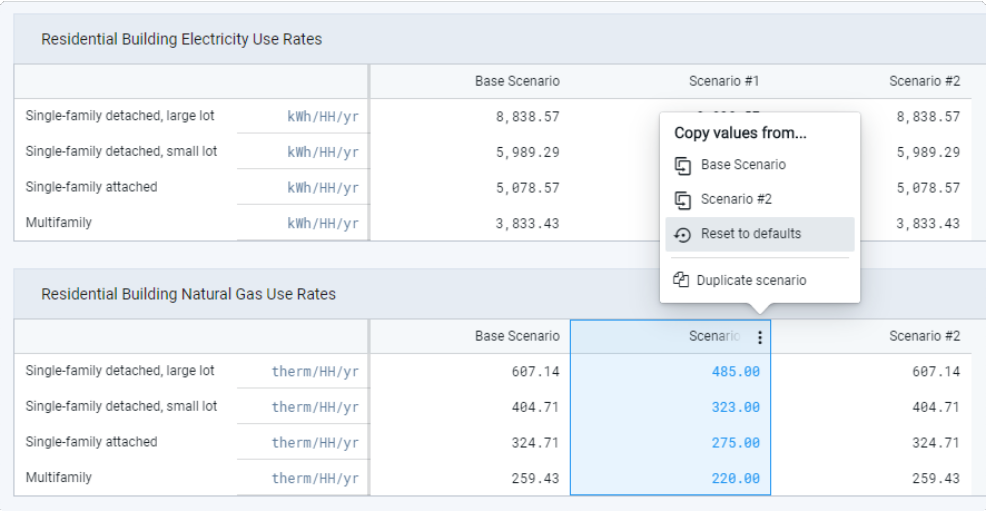
Resetting parameters to use default values
Click Save to save your edits. Otherwise, click Discard to revert values to their previous state.
Copy parameter values between scenarios
Hover over the header for a group of values in a scenario and click the Expand menu button
that appears.Select the scenario from which you want to copy values. The group of parameter values from the selected scenario are copied over.
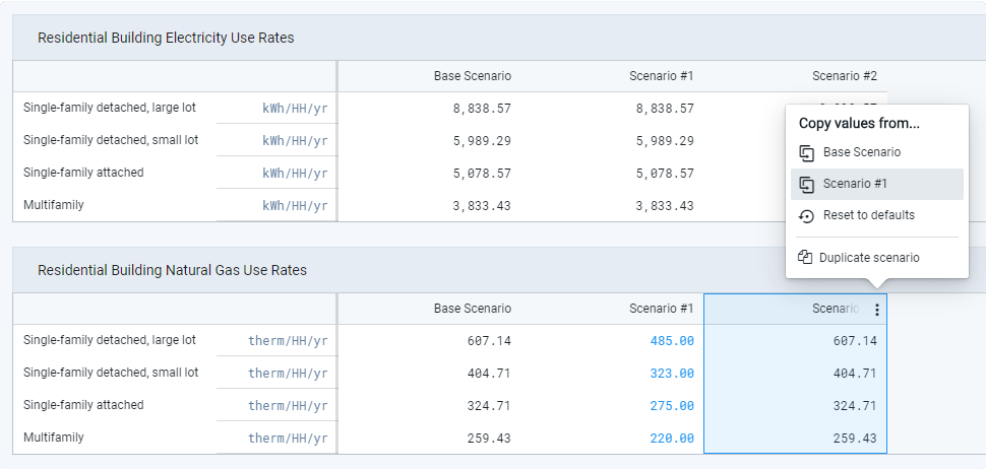
Copying parameter values from one scenario to another
Click Save to save your edits. Otherwise, click Discard to revert values to their previous state.
Analysis Module Parameters
Land Consumption
Minimum Dwelling Unit Density – Expressed in dwelling units per acre. A residential density threshold above which land is considered to be developed or "consumed."
Minimum Employment Density – Expressed in jobs per acre. An employment density threshold above which land is considered to be developed or "consumed."
Energy Use
Residential Building Electricity Use / Natural Gas Use Rates
Electricity rates are expressed in kilowatt-hours (kWh) per household, per year by housing type. Natural gas use rates are expressed in therms. Housing types, as specified in Building and Place Types, include:
Single-family detached, large lot – Refers to lot sizes over 5,500 square feet.
Single-family detached, small lot – Refers to lot sizes under 5,500 square feet.
Single-family attached – Refers to townhomes, rowhomes, and other single-family attached unit types.
Multifamily – Refers to apartments and condominiums in multi-unit buildings.
Commercial Building Electricity Use / Natural Gas Use Rates
Electricity rates are expressed in kilowatt-hours (kWh) per square foot, per year by building use type. Natural gas use rates are expressed in therms. Building use types, which correspond to employment subsectors as specified in Building and Place Types, include:
Other retail
Retail services
Restaurant
Accommodation
Office services
Wholesale
Medical Services
Education
Arts and entertainment
Transportation/Warehouse
Public administration
Adjustment Factors
Adjustment factors are multipliers that are used to adjust total energy use calculations up or down. The factors may be used to broadly calibrate the energy use calculations to local data, or express broad shifts in energy use into the future. A factor of 0.8, for example, is the equivalent of reducing calculated energy use by 20%. The factors can be set by sector and fuel type, including:
Residential Electricity
Residential Natural Gas
Commercial Electricity
Commercial Natural Gas
Water Use
Residential Indoor Water Use Rates
Rates are expressed in gallons per capita, per day by housing type. Housing types, as specified in Building and Place Types, include:
Single-family detached, large lot – Refers to lot sizes over 5,500 square feet.
Single-family detached, small lot – Refers to lot sizes under 5,500 square feet.
Single-family attached – Refers to townhomes, rowhomes, and other single-family attached unit types.
Multifamily – Refers to apartments and condominiums in multi-unit buildings.
Commercial Indoor Water Use Rates
Rates are expressed in gallons per employee, per day by employment subsector. Distributions of employment by subsector are specified in Building and Place Types, including:
Retail services
Restaurant
Accommodation
Arts and entertainment
Other retail
Office services
Education
Public administration
Medical services
Wholesale
Transportation/Warehouse
Construction
Utilities
Manufacturing
Extraction
Military
Agriculture
Reference Evapotranspiration
A measure of water loss to the atmosphere for a "reference crop" of turf grass. Expressed in inches of water per year, this value varies by climate and is used to determine outdoor water use.
Adjustment Factors
Adjustment factors are multipliers that are used to adjust total water use calculations up or down. The factors may be used to broadly calibrate the water use calculations to local data, or express broad shifts in water use due to improved efficiency or conservation into the future. A factor of 0.8, for example, is the equivalent of reducing calculated water use by 20%. The factors can be set by sector for indoor water use and outdoor landscape irrigation (outdoor water use):
Residential Irrigation
Commercial Irrigation
Residential Indoor
Residential Outdoor
Walk Accessibility
Walk Speed – Expressed in miles per hour. The default value is 3.
Retail Location – A number n used to calculate the nth nearest retail location. The default value is 5.
Transit Accessibility
Service Start Time – The Transit Accessibility module accounts for service according to transit schedule data, incorporating services meeting the start and end time parameters specified. The default start time is 7 am.
Service End Time – The Transit Accessibility module accounts for service according to transit schedule data, incorporating services meeting the start and end time parameters specified. The default end time is 10 pm.
Walk Speed – Expressed in miles per hour. The default value is 3.
Retail Location – A number n used to calculate the nth nearest retail location. The default value is 5.
Transportation
School Trip Factor – A multiplier to estimate school trips.
Truck VMT Factor – A multiplier to estimate commercial truck travel relative to total passenger vehicle VMT.
Annualization – A factor indicating the relationship between daily and annual VMT. The default is 350.
Emissions
Transportation GHG Emission Factors
Fuel Economy – On-road average fuel economy, in miles per gallon.
Fuel CO2 Equivalent Emission Rate – Carbon dioxide-equivalent emissions per gallon of fuel, in pounds per gallon.
Transportation Air Pollutant Emission Factors
Nitrogen Oxide – Emissions in grams per mile.
Particulate Matter 10 – Emissions in grams per mile.
Particulate Matter 2.5 – Emissions in grams per mile.
Sulfur Oxide – Emissions in grams per mile.
Carbon Monoxide – Emissions in grams per mile.
Volatile Organic Compounds – Emissions in grams per mile.
Energy Use GHG Emission Factors
Electricity CO2 Equivalent – Carbon dioxide-equivalent emissions per megawatt-hour of electricity, in pounds per gallon.
Natural Gas CO2 Equivalent – Carbon dioxide-equivalent emissions per therm of natural gas, in pounds per gallon.
Water Supply GHG Emission Factors
Indoor Water Use – Electricity use associated with the transport, treatment, and distribution of water and wastewater, in kilowatt-hours per million gallons of indoor water use.
Outdoor Water Use – Electricity use associated with the transport, treatment, and distribution of water, in kilowatt-hours per million gallons of outdoor water use.
Household Costs
Water Use Costs
Residential Water – Cost per thousand gallons, in dollars.
Energy Use Costs
Residential Electricity – Retail cost per kilowatt-hour, in dollars.
Residential Natural Gas – Retail cost per therm, in dollars.
Transportation Costs
Auto Fuel – Retail cost per gallon, in dollars.
Auto Ownership and Maintenance – Cost per mile for auto ownership and maintenance.
Fuel Economy – On-road average fuel economy, in miles per gallon.
Risk and Resilience
Sea Level Rise – Indicates input data used: NOAA Sea Level Rise.
Wildfire Risk – Indicates input data used: USFS Wildfire Hazard Potential (U.S. outside California); CALFIRE Fire Hazard Severity Zones (in California).
Flood Risk – Indicates input data used: FEMA Flood Hazard Areas.
Work with Analysis Module Outputs
The Analyst analysis modules produce a range of outputs:
Output layers that can be examined on the map and in the data table via Explore mode.
Summary results for individual scenarios, accessed via Analyze mode.
Comparative results for multiple scenarios, accessed via Report mode.
For a list of the summary results produced by each module, see Analyze Mode Metrics Reporting. For a list of the output layers, see Analysis Module Output Layers.
View Summary Results for Current Scenario
Click on the tab of the scenario for which you would like to view results.
Enter Analyze mode by clicking the Analyze mode button
 in the Mode bar. The Analysis Modules pane appears. All available modules are listed, and the current state of each is indicated. You can view the outputs of modules for which analysis is complete. If analysis is out of date you can still view your previous results, but it's recommended that you re-run analysis as soon as possible.
Select the completed analysis module for which you want to view results. The summary results for analysis of the current scenario will appear in the Analysis Modules pane. If you select a module that has not been run or for which analysis is in progress, you will receive a message that no charts are available.
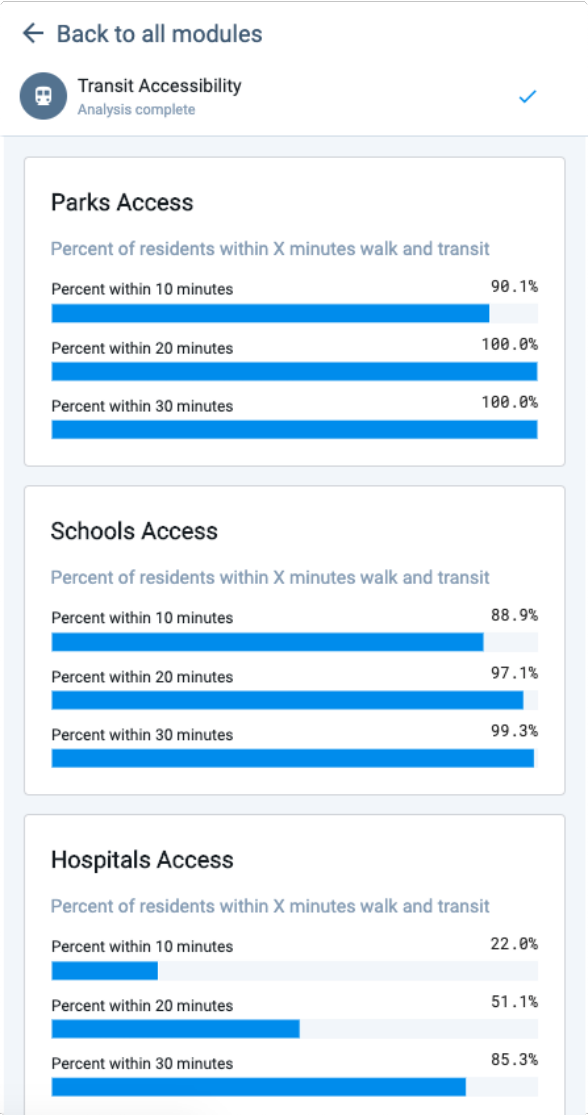 |
View of Transit Accessibility module results in the Analysis Modules pane
Note that some modules include more summary charts than others. You may need to scroll down to view all charts.
View Analysis Output Layers
Analysis output layers appear in the Layers list for a scenario once an analysis run has been completed. Output layers are denoted by the chart icon . To view analysis output layers on the map and in the data table:
Click on the tab of the scenario for which you would like to view results.
Enter Analyze mode by clicking the Analyze mode button
in the Mode bar. The Analysis Modules pane appears. All available modules are listed, and the current state of each is indicated. You can view the outputs of modules for which analysis is complete. If analysis is out of date you can still view your previous results, but it's recommended that you re-run analysis as soon as possible.Select the completed analysis module for which you want to view results. The summary results for analysis of the current scenario will appear in the Analysis Modules pane, and the output layer (or one of the output layers) produced by the module will be activated in your Layers list. The Style tab will open in the Layer Details pane to show the symbology used.
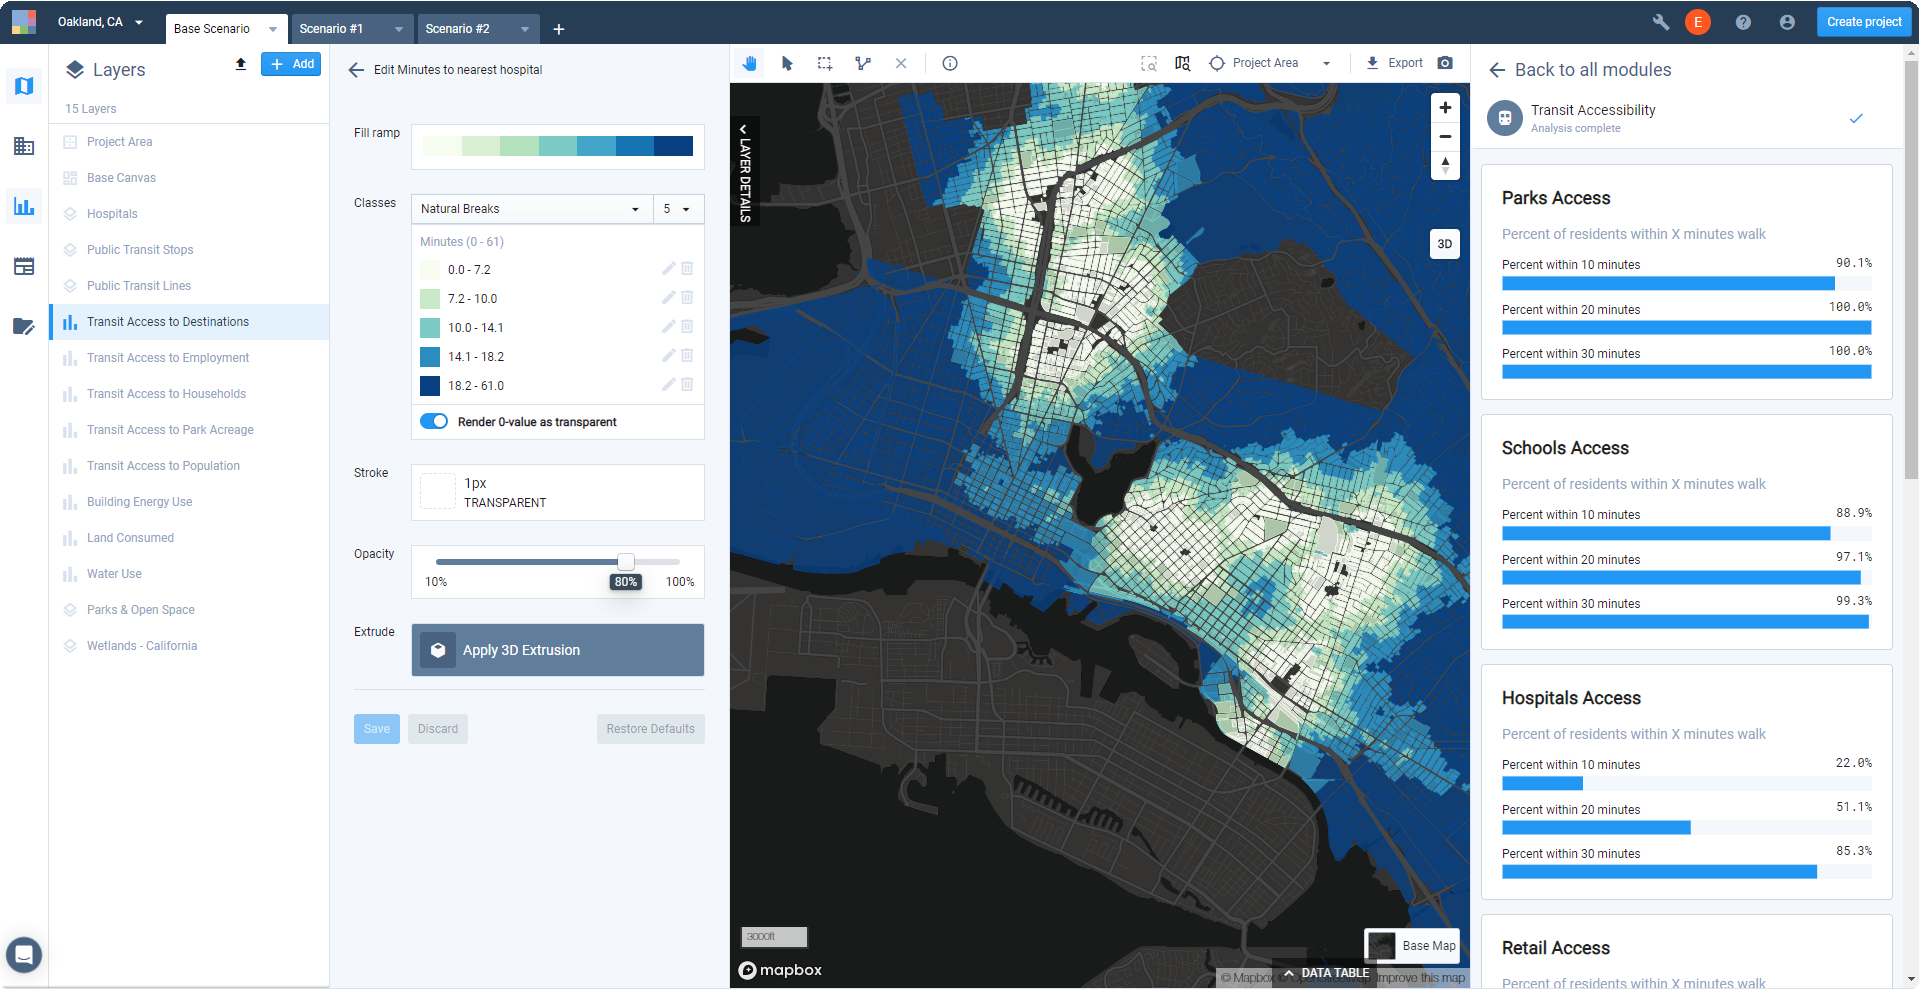
View of Transit Accessibility module outputs in Analyze mode
If necessary, re-order or change the visibility of layers to view the output layer. For modules with multiple output layers—for example, Walk and Transit Accessibility, or Risk and Resilience—you can select another output layer to view.
Explore the mapped module outputs. Each analysis module output layer is symbolized according to a default column selection and style. For example, the Transit Access to Designations layer produced by the Transit Accessibility module defaults to show Minutes to nearest hospital using five classes defined by the Natural Breaks classification method, and a sequential single-hue fill ramp.
You can work with output layers as you would with any other data layers. Change symbology, use filters and joins to create selections and save them as new layers, and export maps or layer data to explore, communicate, and summarize results.
The Source tab of the Layer Details pane includes descriptions of the columns in the output layer, as well as a link to the module methodology.
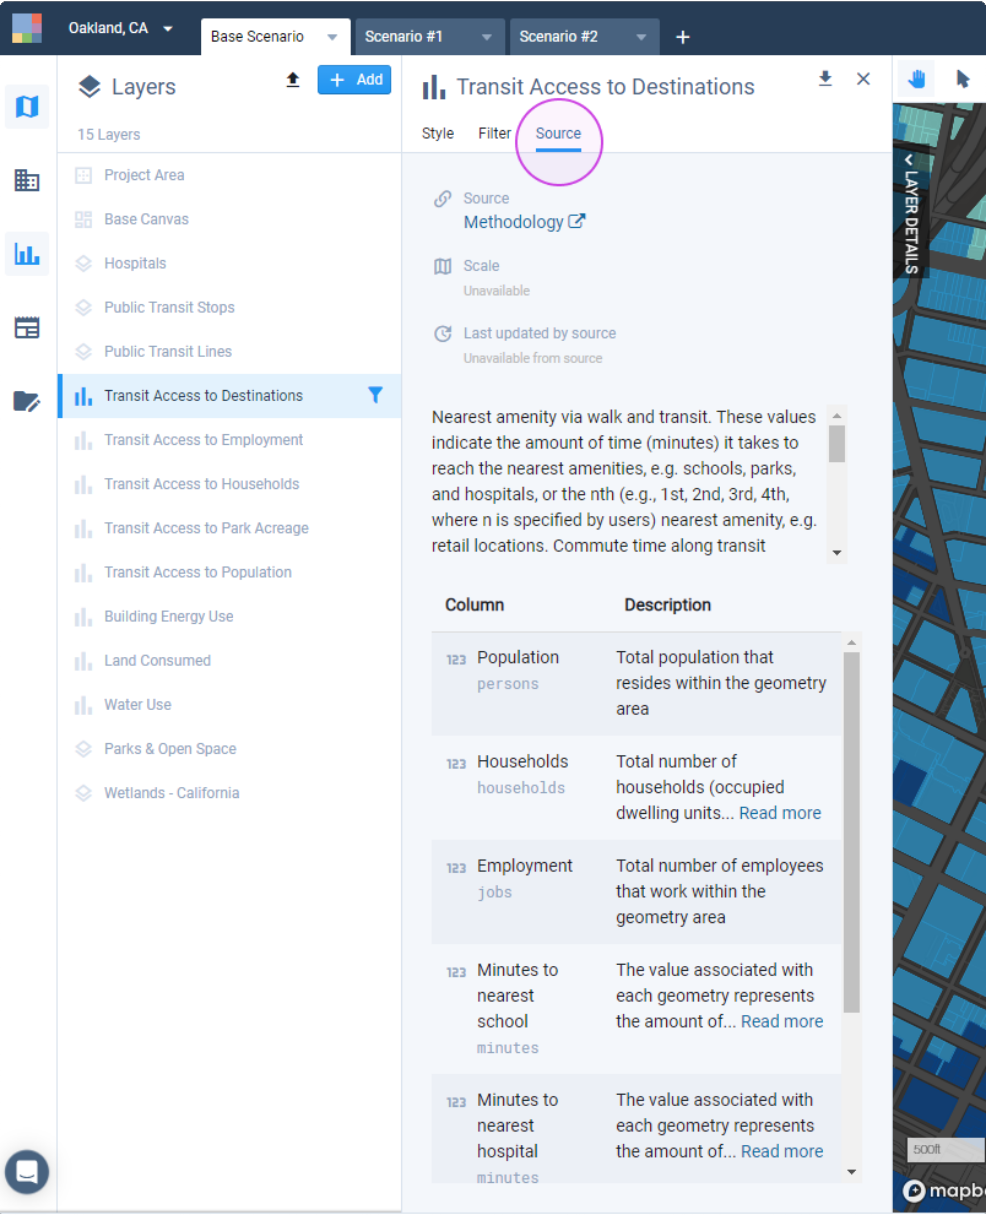
Column descriptions in Source tab
Explore the outputs via the Data Table. You can use the Data Table in concert with your map to summarize data for manually selected subareas, or view filtered selections. Column Summary statistics can be useful for quick summaries. (See Use the Data Table for more information.)
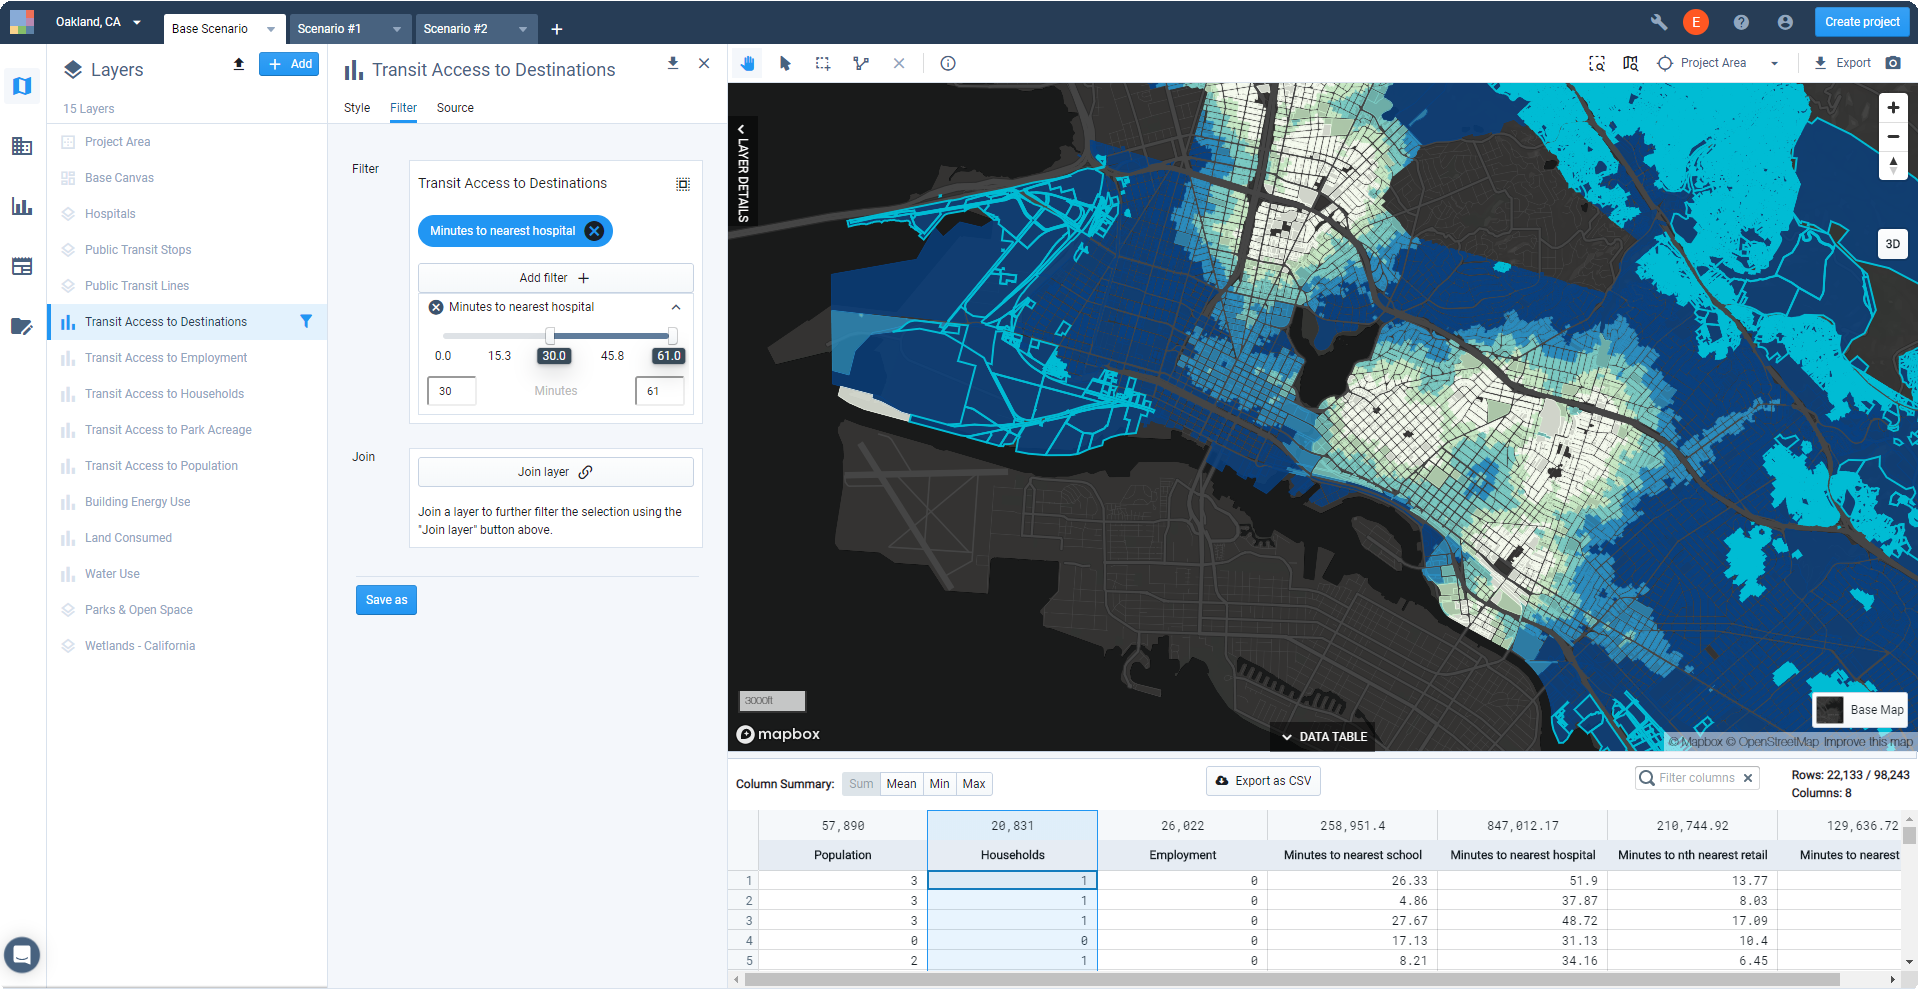
View of Transit Accessibility module outputs with Data Table expanded
To export spatial data for an analysis output layer, click the Download layer button. See Export Layer Data for more details.
To export tabular data for an analysis output layer, click Export as CSV. See Export Table Data for more details.
Analyze Mode Metrics Reporting
Each analysis module produces a range of summary metrics, reported for individual scenarios in Analyze mode and for multiple scenarios in Report mode. The metrics provided in Analyze mode are listed below for reference; see Report Mode Metrics for a list of the metrics provided in Report mode. For more information about the metrics, see the methodology documentation for the individual modules.
Land Consumption
Total Land Consumed – Land cover change in acres.
Land Consumed by Type – Land cover change in acres for Urban Vacant, Urban Redevelopment, Agricultural, Woodland, and Other Greenfield land.
Energy Use
Total Annual Energy Use – Electricity and gas consumed in British thermal units (BTUs) for residential and commercial buildings.
Annual Electricity Use – Electricity consumed in kilowatt-hours (kWh) for residential and commercial buildings.
Annual Natural Gas Use – Natural gas consumed in therms for residential and commercial buildings.
Per Household Annual Energy Use – Average residential electricity and natural gas consumption in BTUs.
Water Use
Total Annual Water Use – Indoor and outdoor water consumed in gallons for residential and commercial buildings.
Per Capita Annual Water Use – Average indoor and outdoor water consumption in gallons for residential (per resident) and commercial (per employee).
Per Household Annual Water Use – Average water consumption in gallons for indoor and outdoor use.
Per Capita Residential Water Use by Land Development Category – Average indoor and outdoor water consumption in gallons.
Walk Accessibility
Parks Access – Percent of residents within a 5, 10, 15, or 20 minute walk.
Schools Access – Percent of residents within a 5, 10, 15, or 20 minute walk.
Hospitals Access – Percent of residents within a 5, 10, 15, or 20 minute walk.
Transit Access: All Stops – Percent of residents within a 5, 10, 15, or 20 minute walk.
Transit Access: High-Quality Stops – Percent of residents within a 5, 10, 15, or 20 minute walk.
Retail Access – Percent of residents within a 5, 10, 15, or 20 minute walk.
Transit Accessibility
Parks Access – Percent of residents within 10, 20, or 30 minutes by transit and walking.
Schools Access – Percent of residents within 10, 20, or 30 minutes by transit and walking.
Hospitals Access – Percent of residents within 10, 20, or 30 minutes by transit and walking.
Retail Access – Percent of residents within 10, 20, or 30 minutes by transit and walking.
Employment Access: 10+ Percent – Percent of residents that can reach 10% or more of the area's jobs within 15, 30, 45, and 60 minutes.
Employment Access: 25+ Percent – Percent of residents that can reach 25% or more of the area's jobs within 15, 30, 45, and 60 minutes.
Employment Access: 50+ Percent – Percent of residents that can reach 50% or more of the area's jobs within 15, 30, 45, and 60 minutes.
Transportation
Travel Mode Share – Percentage of transit, walk/bike, and auto trips by type.
Daily Vehicle Trips – Daily total vehicle trips per the Mixed-Use Development (MXD) trip generation model and Institute of Transportation Engineers (ITE) trip rates.
Annual Vehicle Trips – Annual total vehicle trips per the Mixed-Use Development (MXD) trip generation model and Institute of Transportation Engineers (ITE) trip rates.
Per Capita and Per Household Daily MXD Vehicle trips – Average daily vehicle trips per capita and per household per the MXD model.
Per Capita and Per Household Annual MXD Vehicle Trips – Average annual vehicle trips per capita and per household per the MXD model.
Annual VMT – Total annual passenger vehicle miles traveled.
Per Capita and Per Household Annual Residential VMT – Average annual residential vehicle miles traveled per capita and per household.
Per Capita Residential VMT by Land Development Category – Average annual residential vehicle miles traveled per capita for the Urban, Compact, and Standard Land Development Categories.
Per Household Residential VMT by Land Development Category – Average annual residential vehicle miles traveled per household for the Urban, Compact, and Standard Land Development Categories.
Emissions
Annual GHG Emissions by Source – Annual emissions from passenger vehicle transportation, building energy use, and water energy use, in metric tons of carbon dioxide equivalent (CO2e).
Per Household Annual GHG Emissions by Source – Average annual emissions per household from passenger vehicle transportation, building energy use, and water energy use, in metric tons of carbon dioxide equivalent (CO2e).
Annual Passenger Vehicle Pollutant Emissions by Type – Annual criteria pollutant emissions from passenger vehicle transportation, including nitrogen oxide (NO), particulate matter 10 micrometers and 2.5 micrometers or less (PM10 and PM2.5), sulfur oxides (SOx), carbon monoxide (CO), and volatile organic compounds (VOC).
Household Costs
Annual Household Auto and Utility Costs – Total costs, in dollars, for residential energy use, water use, and passenger vehicle transportation.
Per Household Annual Auto and Utility Costs – Average costs per household, in dollars, for residential energy use, water use, and passenger vehicle transportation.
Per Household Annual Auto Costs by Type – Average costs per household, in dollars, for passenger vehicle fuel and auto ownership and maintenance.
Risk and Resilience
Housing in Hazard Zones – Number of dwelling units in fire, flood, and sea level rise zones.
Population in Hazard Zones – Number of residents in fire, flood, and sea level rise zones.
Jobs in Hazard Zones – Number of jobs in fire, flood, and sea level rise zones.
Land Area in Hazard Zones – Acres in fire, flood, and sea level rise zones.
Canvas Features in Hazard Zones – Number of canvas features (parcels or blocks) in fire, flood, and sea level rise zones.
Housing in Flood Hazard Zones – Number of dwelling units in flood zones, including base and 100- year floodplains.
Population in Flood Hazard Zones – Number of residents in flood zones, including base and 100- year floodplains.
Jobs in Flood Hazard Zones – Number of jobs in flood zones, including base and 100-year floodplains.
Land Area in Flood Hazard Zones – Acres in flood zones, including base and 100-year floodplains.
Canvas Features in Flood Hazard Zones – Number of canvas features (parcels or blocks) in flood zones, including base and 100-year floodplains.
Housing in Fire Hazard Zones – Number of dwelling units in fire zones, including moderate and high risk zones.
Population in Fire Hazard Zones – Number of residents in fire zones, including moderate and high risk zones.
Jobs in Fire Hazard Zones – Number of jobs in fire zones, including moderate and high risk zones.
Land Area in Fire Hazard Zones – Acres in fire zones, including moderate and high risk zones.
Canvas Features in Fire Hazard Zones – Number of canvas features (parcels or blocks) in fire zones, including moderate and high risk zones.
Housing in Sea Level Rise Hazard Zones – Number of dwelling units in sea level rise hazard zones, in classes from 0 to 10 ft.
Population in Sea Level Rise Hazard Zones – Number of residents in sea level rise hazard zones, in classes from 0 to 10 ft.
Jobs in Sea Level Rise Hazard Zones – Number of jobs in sea level rise hazard zones, in classes from 0 to 10 ft.
Land Area in Sea Level Rise Hazard Zones – Acres in sea level rise hazard zones, in classes from 0 to 10 ft.
Canvas Features in Sea Level Rise Hazard Zones – Number of canvas features (parcels or blocks) in sea level rise hazard zones, in classes from 0 to 10 ft.
Conservation (California only)
Increase in Land Cover Area by Landscape Type – Change in acres by type, including Natural and Developed.
Decrease in Land Cover Area by Landscape Type – Change in acres by type, including Natural and Developed.
Net Change in Carbon Stock – Change in metric tons for above- and below-ground carbon stock.
Net Change in Carbon Stock as Equivalent Passenger Vehicle Miles Driven Annually – Change in metric tons for above- and below-ground carbon, expressed in equivalent passenger vehicles driven per year.
Total Carbon Stock – Total above- and below-ground carbon stock, in metric tons.
Net Change in Land Cover: Wetlands – Change in wetland acres by type, including Natural and Developed.
Net Change in Land Cover: Drinking Water Source Watersheds – Change in drinking water source watershed acres by type, including Natural and Developed.
Net Change in Land Cover: Active River Area – Net change in land cover in active river areas, in acres by type, including Natural and Developed.
Net Change in Groundwater Recharge Potential – Volume of water impacted, in acre-feet.
Net Change in Urban Water Demand – Net change in urban water demand, in acre-feet.
Net Change in Total Water Demand – Net change in urban and agricultural water demand, in acre- feet.
Total Watershed Integrity Class Area by Type – Total area in natural catchments, important riparian buffers, and degraded catchments, in acres.
Net Change in Land Cover: Essential Connectivity Areas – Net change in land cover in Essential Connectivity Areas, in acres by type, including Natural and Developed.
Net Change in Land Cover: TNC Priority Areas – Net change in land cover in The Nature Conservancy's Priority Areas, in acres by type, including Natural and Developed.
Net Change in Species Movement Potential – Area by low, medium, and high species movement potential, in acres.
Habitat Change: Amphibians – Average area impacted, in acres.
Habitat Change: Birds – Average area impacted, in acres.
Habitat Change: Mammals – Average area impacted, in acres.
Habitat Change: Reptiles – Average area impacted, in acres.
Habitat Change: Threatened and Endangered Species – Average area impacted, in acres.
Habitat Change: Species Vulnerable to Climate Change (except Birds) – Average area impacted, in acres.
Habitat Change: Birds Vulnerable to Climate Change – Average area impacted, in acres.
Habitat Degraded for Threatened and Endangered Species – Area degraded by species, in acres.
Analysis Module Output Layers
Each module produces one or more spatial output layers. Output layers can be mapped, filtered, joined, and exported from Analyst. Output layer data can also be exported in CSV format from the data table. The output layers for each module are listed below for reference. For more detailed information about the outputs, see the methodology documentation for the individual modules.
Analysis Module Output Layers:
Land Consumption
Land Consumed
Energy Use
Building Energy Use
Water Use
Water Use
Walk Accessibility
Walk Access to Destinations
Walk Access to Employment
Walk Access to Households
Walk Access to Park Acreage
Walk Access to Population
Transit Accessibility
Transit Access to Destinations
Transit Access to Employment
Transit Access to Households
Transit Access to Park Acreage
Transit Access to Population
Transportation
Vehicle Miles Traveled
Vehicle Trip Counts by Type
Emissions
Greenhouse Gas and Pollutant Emissions
Household Costs
Household Costs
Risk and Resilience
All Natural Hazard Risk Areas
Fire Risk Areas
Flood Risk Areas
Sea Level Rise Risk Areas
Conservation (California only)
Painted Changes by Landscape Type