Create an Existing Conditions Dashboard
You need just two things to get started – an Analyst project of any type, and a polygon layer containing the area(s) that you want analyzed. You can use one of the reference data layers already in the platform (for example, Neighborhoods, Jurisdictions, or Zip Code Tabulation Areas), or upload a spatial data layer of your own.
There are some guidelines about input layers and analysis areas:
Parcel-level layers (like the Base Canvas) and those with analysis area polygons smaller than 270 ft2 will not work because the areas are too small.
Estimates for polygons that cover very few census block groups are not recommended for use. Because of the resolution of the Census ACS source data, they will be less accurate than estimates for larger polygons. See Value Estimation by Analysis Area for information about how values are calculated.
Layers with total area coverage larger than 38,600 mi2 (roughly the size of Indiana) will not work because of computing restraints. Consider breaking out the included areas into separate layers.
UrbanFootprint automatically looks for a column containing names for the included areas. If you're uploading a layer and have the ability to configure your data, use a column called
location_nameto specify area names.
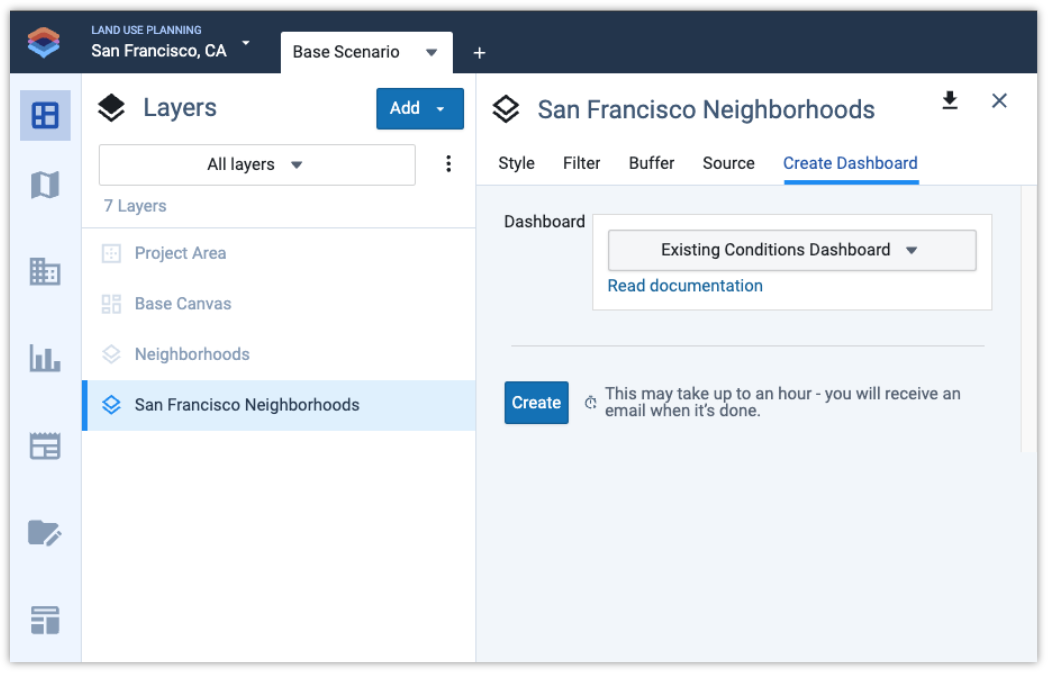
Once you have a project and a layer:
Select the layer, which opens the Layer Details pane.
Click on the Create Dashboard tab.
Click Create.
It takes about 15 minutes to create a dashboard, or a bit longer if you have large areas. When the dashboard is complete you'll receive an email with a link to view it. You can also access dashboards through the Dashboard mode in Analyst:
Click the Dashboards icon at the bottom of the navigation panel on the left side of the Analyst screen.
Select your dashboard from the menu at the top left of the screen. The menu includes all dashboards created by users in your organization, grouped by project.