Use Reference Data
Analyst provides ready access to a wealth of curated reference data layers, allowing you to get to work quickly in any area of the United States. Using the Layer Manager, you can browse the data available for your project area, view metadata, and instantly load them to your project.
Reference Data Categories
Reference data layers are organized into the categories listed below. The availability of reference data varies based on project location.
Administrative Boundaries – Includes jurisdictional boundaries, census boundaries, congressional districts, school districts, and traffic analysis zones (TAZs).
Conservation – Includes protected environmental areas as used by the Conservation module (available in California only).
Education – Includes public and private schools, colleges, universities, and daycare centers.
Environment & Land Cover – Includes data describing environmental conditions or environmentally sensitive areas, such as critical habitat, wetlands, hydrography, terrestrial ecoregions, watersheds, and wildlife corridors. Data availability varies from state to state.
Equity & Environmental Justice – Includes data describing existing land use or demographic conditions relevant to equity and environmental justice analysis, as well as federal and other designations used for equitable planning and implementation.
Health – Includes locations of healthcare facilities as well as public health data.
Infrastructure – Includes locations of energy-related infrastructure.
Land use – Includes building footprints, points of interest, and reference data for the parcel canvas.
Parks & Open Space – Includes parks, open space, and conservation easements.
Risk & Resilience – Includes areas at risk of wildfire, earthquakes, sea level rise, floods, and toxic release.
Socio-Demographic – Includes census socio-demographic information in individual layers.
Transport & Circulation – Includes infrastructure data for all forms of transportation, including public transit, active transportation, roads, rail, ports, and airports. Also includes household transportation survey data.
Reference Data Information
Metadata is provided for each reference data layer, allowing you to browse and view a description, source, scale, last updated date, and a summary of the included columns. The information is also available via the Source tab of the Layer Details pane.
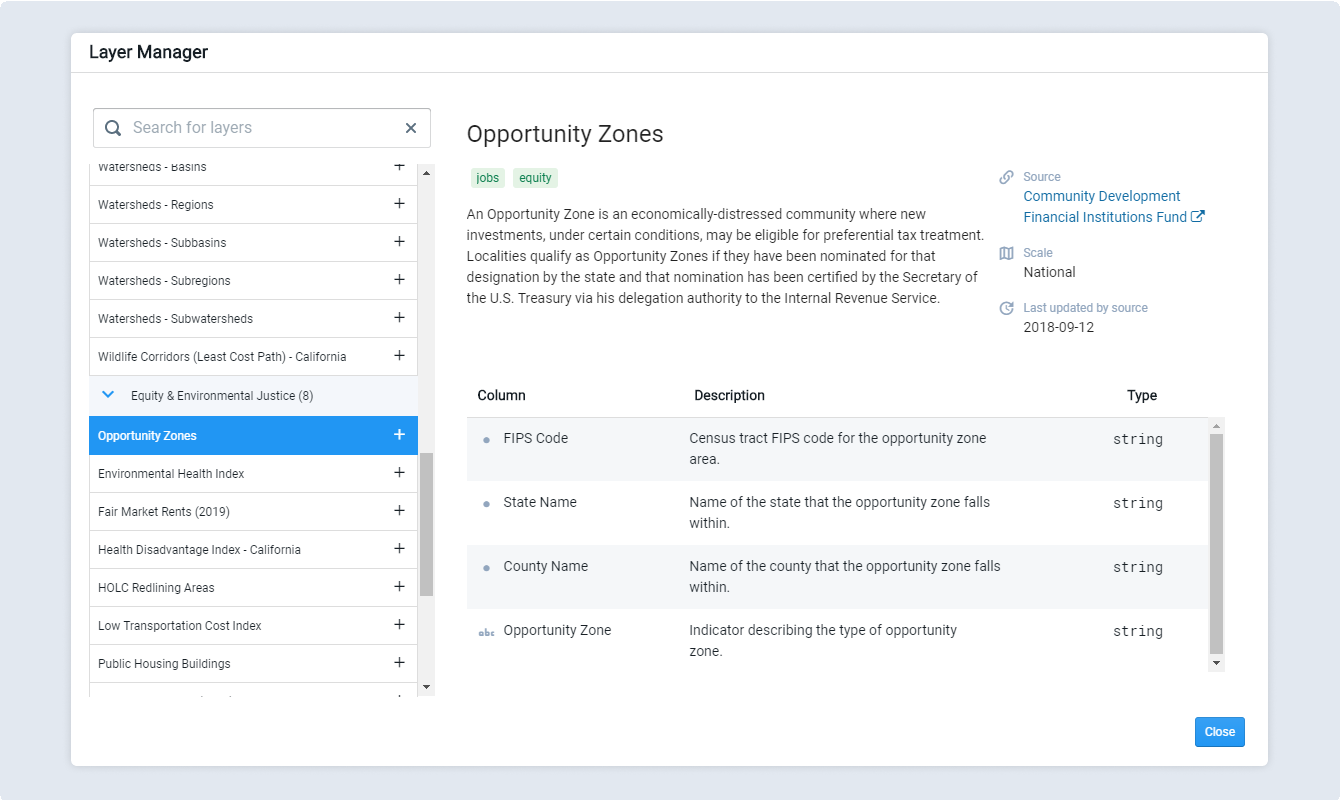 |
Source – The name and link (if available) to the data source.
Scale – Reference data is typically at the national or state scales.
Last updated by source – The last updated date according to the data source.
Summary Table – Includes information for each attribute column.
Column – Includes the names of all columns in the data table.
Description – A short description of each column, if provided by the source.
Type – The data type of each column. Options include string (general text), int (integer, or whole number), and float (floating-point, or number with a decimal point). The column types determine how columns can be symbolized and queried in filters.
Reference Data Updates
The catalog of reference data is ever-expanding. Analyst makes frequent updates to incorporate new datasets, and new releases of existing datasets. While users always have the option of uploading their own data, we can also add new datasets as reference data to make them more easily accessible. Data can be made available through the Layer Manager to a single organization, or (given appropriate permissions) made available to all Analyst users. Contact Customer Support for information.
Add Reference Data Layers
Select Add > Add pre-defined layers at the top of the Layers pane to open the Layer Manager.
Search for a layer to add. Use the search box to find data by title or keyword, or browse the list by category.
Click on a layer entry to view its information and see metadata for the reference data.
Click the + button next to any layers you want to add. You can add multiple layers at once.
Close the window. The layer(s) will be added to your project and appear in the Layers list. By default, newly added layers will be hidden. Newly added layers will appear in a project's Layers list for all users.
Find your layer(s) in the Layers list and click the Show icon
 . The layer will be displayed on the map. Reference data layers may come with default symbology. See Symbolize Data Layers for details on changing symbology. Layer order, symbology, and visibility are unique to each user.
Set Favorite Layers
In your work, you may find that there is a set of layers that you regularly use in your projects. You can mark a layer as a “Favorite” to automatically add it to every new project that you create. Note that Favorites are user-based, so they will not apply to other users within your organization. Different users can have different sets of Favorites.
To set a layer as a Favorite:
Select Add > Add pre-defined layers at the top of the Layers pane to open the Layer Manager.
Search for a layer to select. Use the search box to find data by title or keyword, or browse the list by category.
Click on a layer entry to view its information. Metadata for the layer is shown.
Click the Star icon
 next to the layer name. The layer will now appear in the Favorites category of the Layer Manager. Any new projects you create will include all your Favorite layers. Existing projects will remain the same.
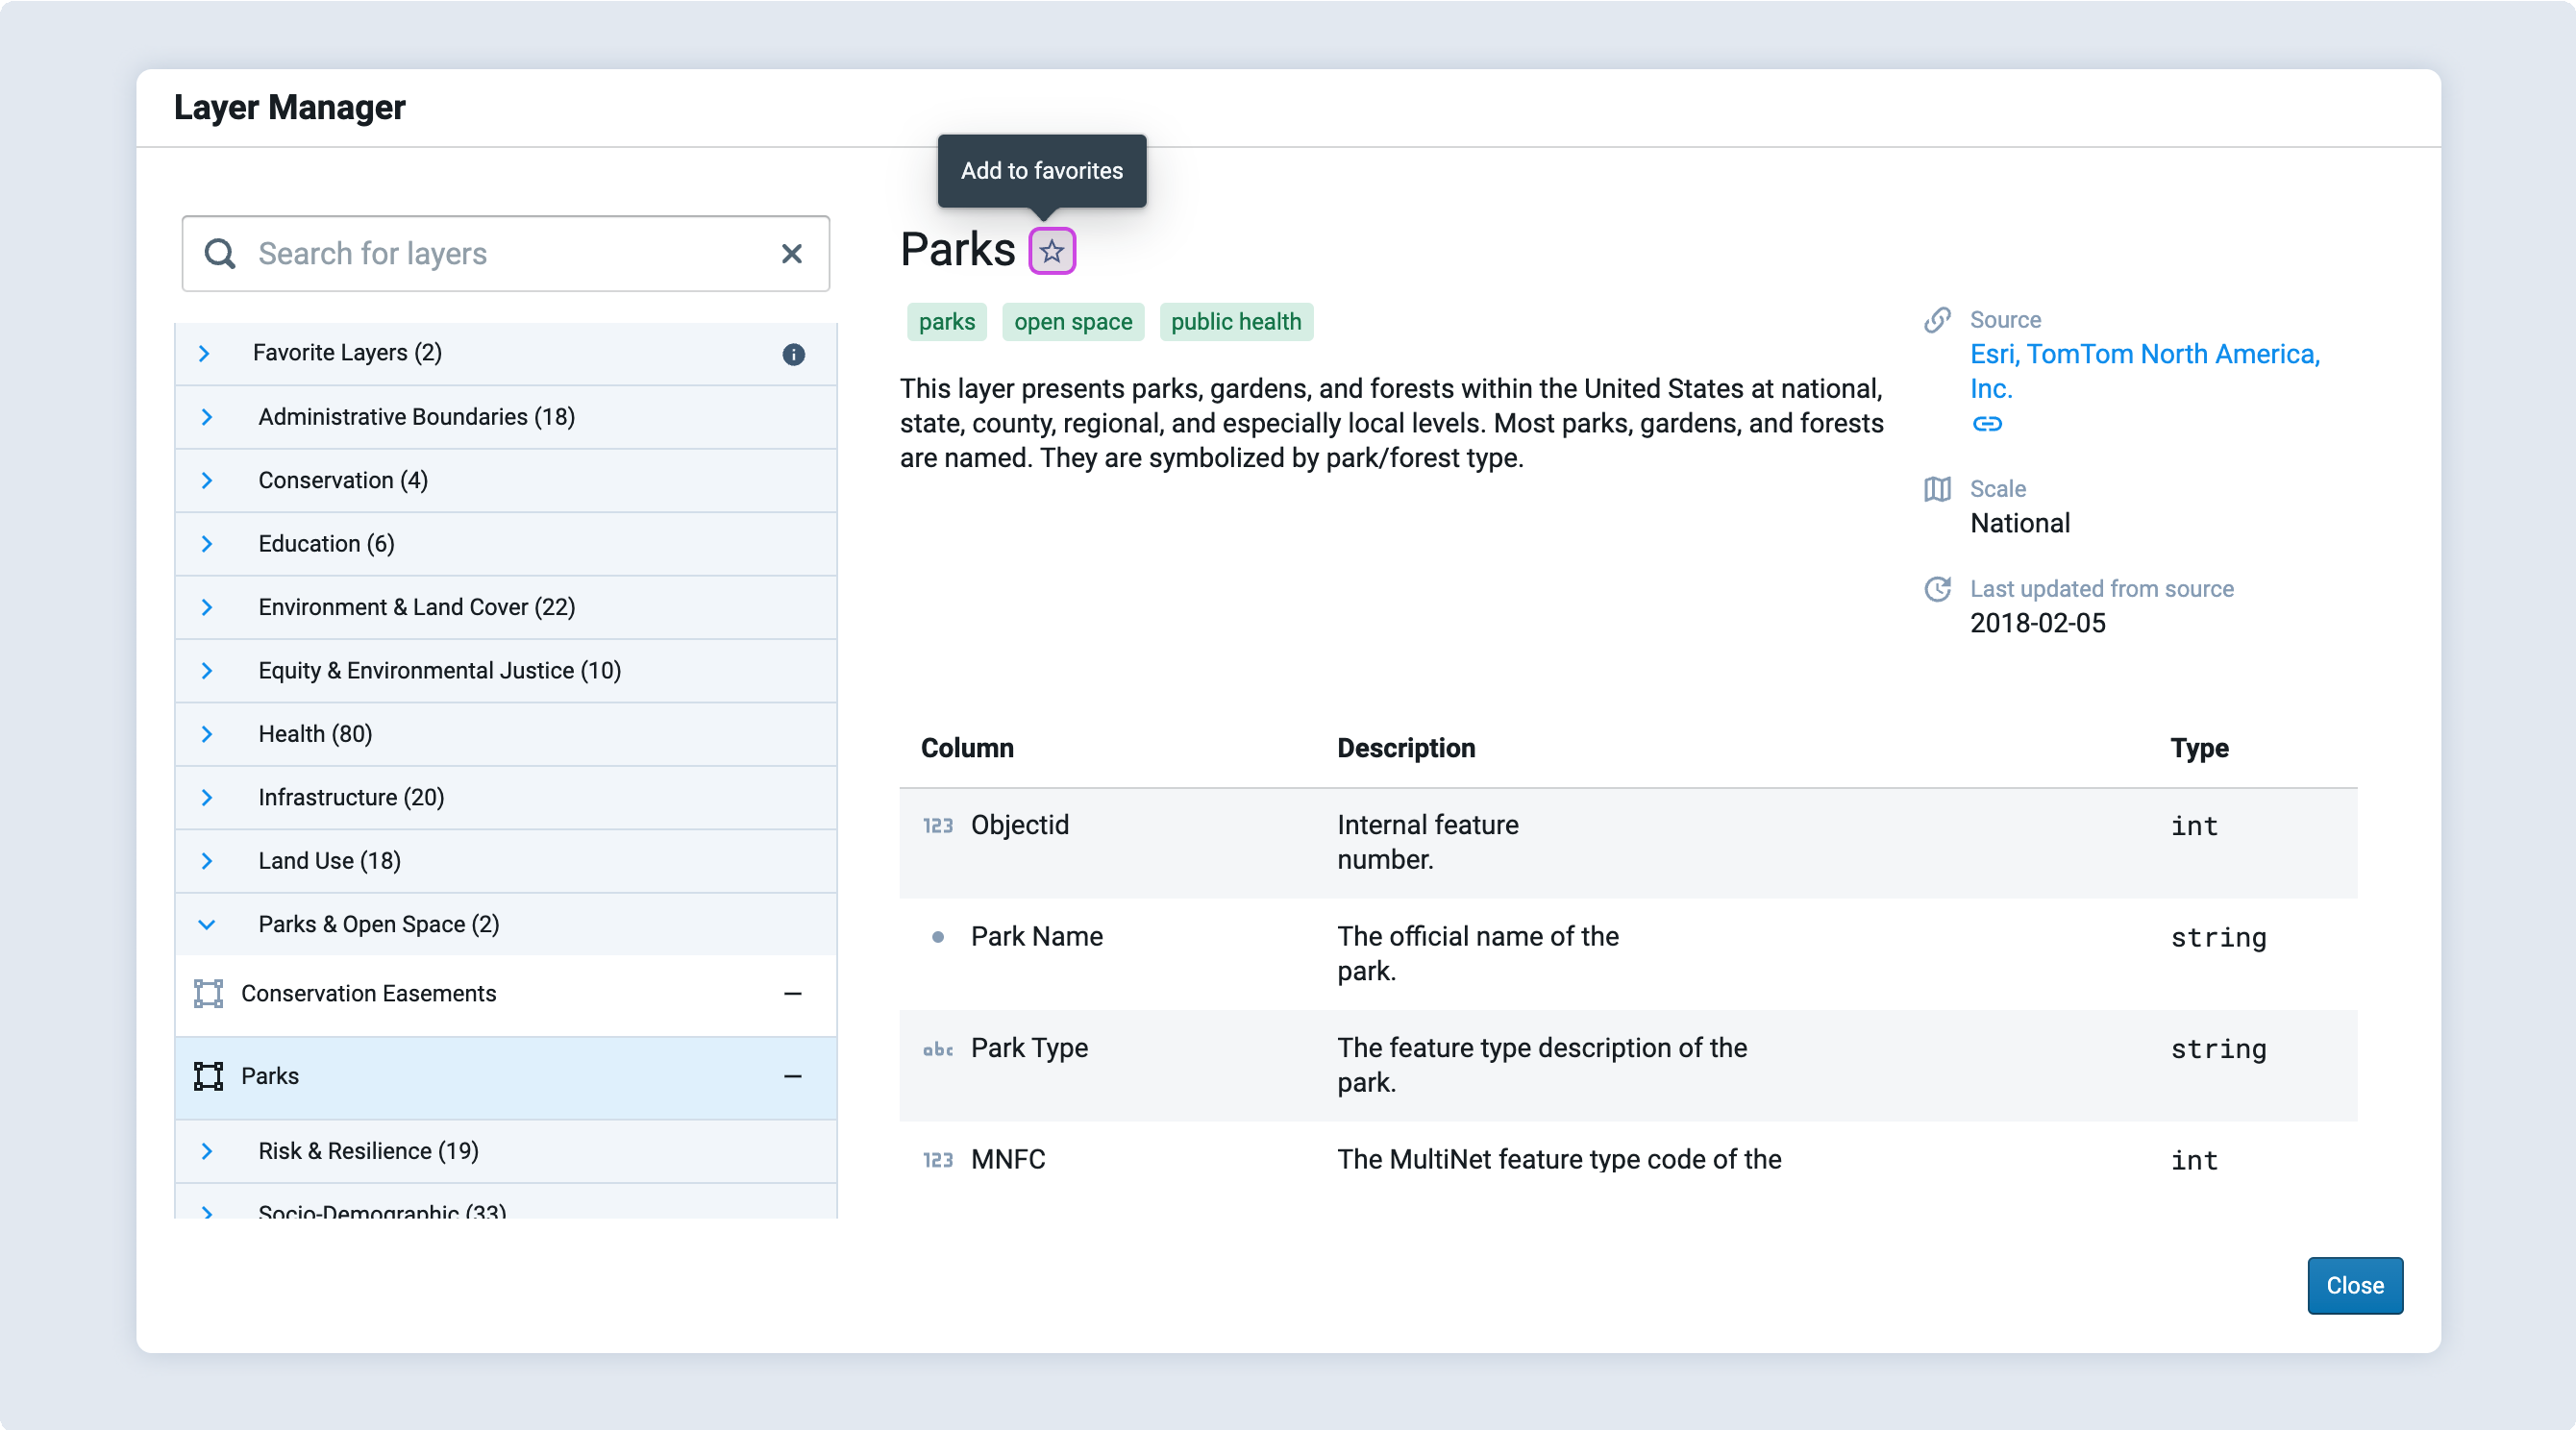
Setting a Favorite layer
To remove a Favorite, click the Star icon
again to deselect. Once you do so, the layer will no longer be added to new projects by default. Removing a Favorite will not change whether layers are included in existing projects.
Favorite Layers will appear in a Favorite Layers category at the top of the Layer Manager list. The number of Favorite Layers is indicated next to the category name.