Report Mode - Analysis Module Summary Statistics
The Analyst analysis modules produce a range of outputs:
Comparative results for multiple scenarios, accessed via Report mode.
Output layers that can be examined on the map and in the data table via Explore mode.
Summary results for individual scenarios, accessed via Analyze mode.
Compare Analysis Results for Multiple Scenarios
Comparative analysis module results for multiple scenarios are accessed via Report mode. To view, compare, and export comparative results:
Enter Report mode by clicking the Report mode icon
 in the Mode bar. The Report screen appears.
Select an analysis module from the list on the left side of the screen. The report screen for the selected module appears.
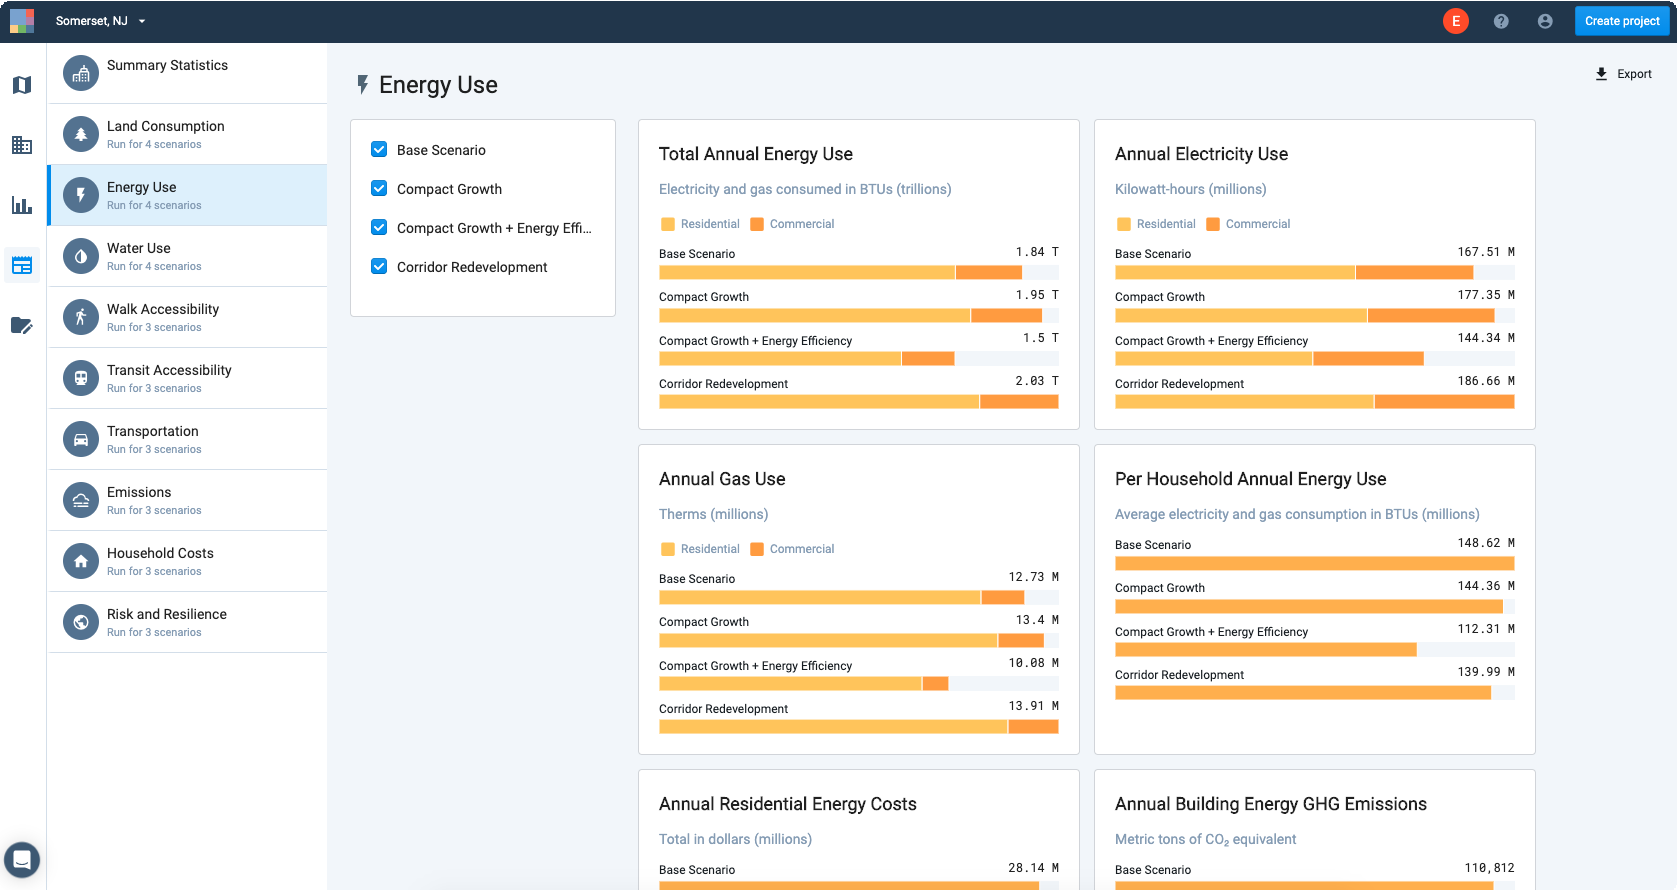
View of Energy Use report screen
Select the scenarios for which you would like to view results. By default, all scenarios for which the chosen module has been run are checked. If analysis has not been run for a module and scenario, you will not be able to select it.
View and compare results. The number of summary charts varies by module; you may need to scroll down to see them all.
Hovering over the individual sections of stacked bar charts displays sub-category values.
The charts created in Analyst are dynamically generated and cannot be downloaded. However, you can export the summary results to develop custom charts in other programs.
To export scenario results, click the Export
 button. An Excel report containing all data as represented by the charts will be downloaded to your computer.
Each analysis module produces a range of metrics for individual scenarios in Analyze mode and are compiled for review across multiple scenarios in Report mode. The metrics provided for Analysis Module's Summary Statistics are found below.
Note
For more information about each, see the methodology documentation for the individual modules.
Summary Metrics for each Analysis Module in Report Mode
Each analysis module produces a range of metrics for individual scenarios in Analyze mode and are compiled for review across multiple scenarios in Report mode. The metrics provided for Analysis Modules are found below.
Land Consumption
Total Land Consumed – Land cover change in acres.
Land Consumed by Type – Land cover change in acres for Urban Vacant, Urban Redevelopment, Agricultural, Woodland, and Other Greenfield land.
Energy Use
Total Annual Energy Use – Electricity and gas consumed in British thermal units (BTUs) for residential and commercial buildings.
Annual Electricity Use – Electricity consumed in kilowatt-hours (kWh) for residential and commercial buildings.
Annual Natural Gas Use – Natural gas consumed in therms for residential and commercial buildings.
Per Household Annual Energy Use – Average residential electricity and natural gas consumption in BTUs.
Annual Residential Energy Costs – Total costs, in dollars, for residential energy use. This analysis is produced by the Household Costs module.
Annual Building Energy GHG Emissions – Annual emissions from building energy use, in metric tons of carbon dioxide equivalent (CO2e). This analysis is produced by the Emissions module.
Water Use
Total Annual Water Use – Indoor and outdoor water consumed in gallons for residential and commercial buildings.
Per Capita Annual Water Use – Average indoor and outdoor water consumption in gallons for residential (per resident) and commercial (per employee).
Per Household Annual Water Use – Average water consumption in gallons for indoor and outdoor use.
Per Capita Residential Water Use by Land Development Category – Average indoor and outdoor water consumption in gallons.
Walk Accessibility
Parks Access – Percent of residents within a 5, 10, 15, or 20 minute walk.
Schools Access – Percent of residents within a 5, 10, 15, or 20 minute walk.
Hospitals Access – Percent of residents within a 5, 10, 15, or 20 minute walk.
Transit Access: All Stops – Percent of residents within a 5, 10, 15, or 20 minute walk.
Transit Access: High-Quality Stops – Percent of residents within a 5, 10, 15, or 20 minute walk.
Retail Access – Percent of residents within a 5, 10, 15, or 20 minute walk.
Transit Accessibility
Parks Access – Percent of residents within 5, 10, 15, or 20 minutes by transit and walking.
Schools Access – Percent of residents within 5, 10, 15, or 20 minutes by transit and walking.
Hospitals Access – Percent of residents within 5, 10, 15, or 20 minutes by transit and walking.
Transit Access: All Stops – Percent of residents within 5, 10, 15, or 20 minutes by transit and walking.
Transit Access: High-Quality Stops – Percent of residents within 5, 10, 15, or 20 minutes by transit and walking.
Retail Access – Percent of residents within 5, 10, 15, or 20 minutes by transit and walking.
Employment Access: 10+ Percent – Percent of residents that can reach 10% or more of the area's jobs within 15, 30, 45, and 60 minutes.
Employment Access: 25+ Percent – Percent of residents that can reach 25% or more of the area's jobs within 15, 30, 45, and 60 minutes.
Employment Access: 50+ Percent – Percent of residents that can reach 50% or more of the area's jobs within 15, 30, 45, and 60 minutes.
Transportation
Travel Mode Share – Percentage of transit, walk/bike, and auto trips by type.
Daily Vehicle Trips – Daily total vehicle trips per the Mixed-Use Development (MXD) trip generation model and Institute of Transportation Engineers (ITE) trip rates.
Annual Vehicle Trips – Annual total vehicle trips per the Mixed-Use Development (MXD) trip generation model and Institute of Transportation Engineers (ITE) trip rates.
Per Capita and Per Household Daily MXD Vehicle trips – Average daily vehicle trips per capita and per household per the MXD model.
Per Capita and Per Household Annual MXD Vehicle Trips – Average annual vehicle trips per capita and per household per the MXD model.
Annual VMT – Total annual passenger vehicle miles traveled.
Per Capita and Per Household Annual Residential VMT – Average annual residential vehicle miles traveled per capita and per household.
Per Capita Residential VMT by Land Development Category – Average annual residential vehicle miles traveled per capita for the Urban, Compact, and Standard Land Development Categories.
Per Household Residential VMT by Land Development Category – Average annual residential vehicle miles traveled per household for the Urban, Compact, and Standard Land Development Categories.
Emissions
Annual GHG Emissions by Source – Annual emissions from passenger vehicle transportation, building energy use, and water energy use, in metric tons of carbon dioxide equivalent (CO2e).
Per Household Annual GHG Emissions by Source – Average annual emissions per household from passenger vehicle transportation, building energy use, and water energy use, in metric tons of carbon dioxide equivalent (CO2e).
Annual Passenger Vehicle Pollutant Emissions by Type – Annual criteria pollutant emissions from passenger vehicle transportation, including nitrogen oxide (NO), particulate matter 10 micrometers and 2.5 micrometers or less (PM10 and PM2.5), sulfur oxides (SOx), carbon monoxide (CO), and volatile organic compounds (VOC).
Household Costs
Annual Household Auto and Utility Costs – Total costs, in dollars, for residential energy use, water use, and passenger vehicle transportation.
Per Household Annual Auto and Utility Costs – Average costs per household, in dollars, for residential energy use, water use, and passenger vehicle transportation.
Per Household Annual Auto Costs by Type – Average costs per household, in dollars, for passenger vehicle fuel and auto ownership and maintenance.
Risk and Resilience
Housing in Hazard Zones – Number of dwelling units in fire, flood, and sea level rise zones.
Population in Hazard Zones – Number of residents in fire, flood, and sea level rise zones.
Jobs in Hazard Zones – Number of jobs in fire, flood, and sea level rise zones.
Land Area in Hazard Zones –Acres in fire, flood, and sea level rise zones.
Canvas Features in Hazard Zones – Number of canvas features (parcels or blocks) in fire, flood, and sea level rise zones.
Housing in Flood Hazard Zones – Number of dwelling units in flood zones, including base and 100- year floodplains.
Population in Flood Hazard Zones – Number of residents in flood zones, including base and 100- year floodplains.
Jobs in Flood Hazard Zones – Number of jobs in flood zones, including base and 100-year floodplains.
Land Area in Flood Hazard Zones – Acres in flood zones, including base and 100-year floodplains.
Canvas Features in Flood Hazard Zones – Number of canvas features (parcels or blocks) in flood zones, including base and 100-year floodplains.
Housing in Fire Hazard Zones – The number of dwelling units in fire zones, including moderate and high risk zones.
Population in Fire Hazard Zones – The number of residents in fire zones, including moderate and high risk zones.
Jobs in Fire Hazard Zones – Number of jobs in fire zones, including moderate and high risk zones.
Land Area in Fire Hazard Zones – Acres in fire zones, including moderate and high risk zones.
Canvas Features in Fire Hazard Zones – Number of canvas features (parcels or blocks) in fire zones, including moderate and high risk zones.
Housing in Sea Level Rise Hazard Zones – Number of dwelling units in sea level rise hazard zones, in classes from 0 to 10 ft.
Population in Sea Level Rise Hazard Zones – The number of residents in sea level rise hazard zones, in classes from 0 to 10 ft.
Jobs in Sea Level Rise Hazard Zones – The number of jobs in sea level rise hazard zones, in classes from 0 to 10 ft.
Land Area in Sea Level Rise Hazard Zones – Acres in sea level rise hazard zones, in classes from 0 to 10 ft.
Canvas Features in Sea Level Rise Hazard Zones – Number of canvas features (parcels or blocks) in sea level rise hazard zones, in classes from 0 to 10 ft.
Conservation (California only)
Increase in Land Cover Area by Landscape Type – Change in acres by type, including Natural and Developed.
Decrease in Land Cover Area by Landscape Type – Change in acres by type, including Natural and Developed.