Coastal Flood
Coastal flooding typically occurs during seasonal high tides and storms. As sea level rises, floods are expected to happen more frequently and during less extreme events. Low-lying coastal areas are most susceptible to these changes, and no datasets are publicly available that demonstrate comprehensive coastal flood risk with:
Sufficient spatial resolution to effectively represent property scale risk and damage.
Information about inundation depth and frequency of flooding.
Future inundation projections from the combined effects of storm surge and sea level rise.
The UrbanFootprint Coastal Flood dataset comprehensively assesses coastal flood risk by integrating storm surge, hurricane-induced surge, and sea level rise. It offers depth annual probabilities at the parcel scale, accounting for present-day and future horizons and climate conditions.
Example Maps in Analyst
This pair of images showcases how you can visualize coastal flood in Analyst. In these examples, there is an increased annual probability of 3 feet or more coastal flooding, with more areas exposed to coastal flooding in the future scenario.
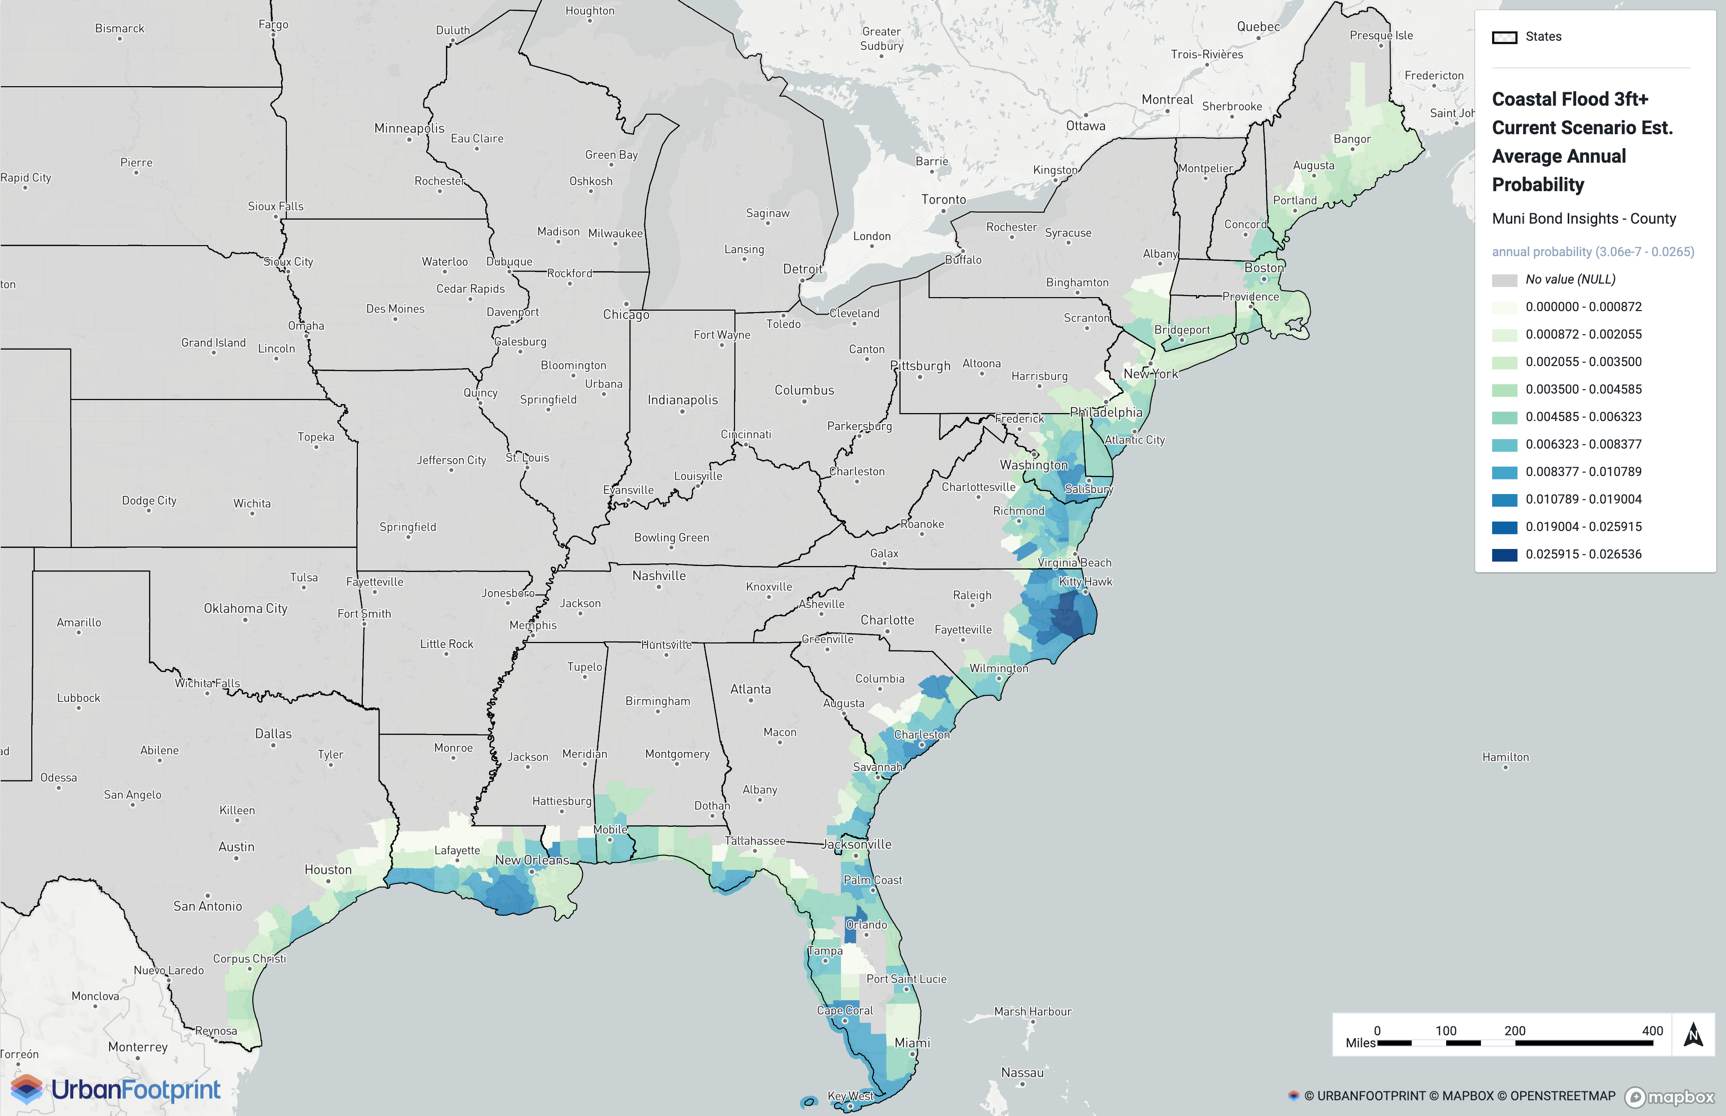
Current scenario
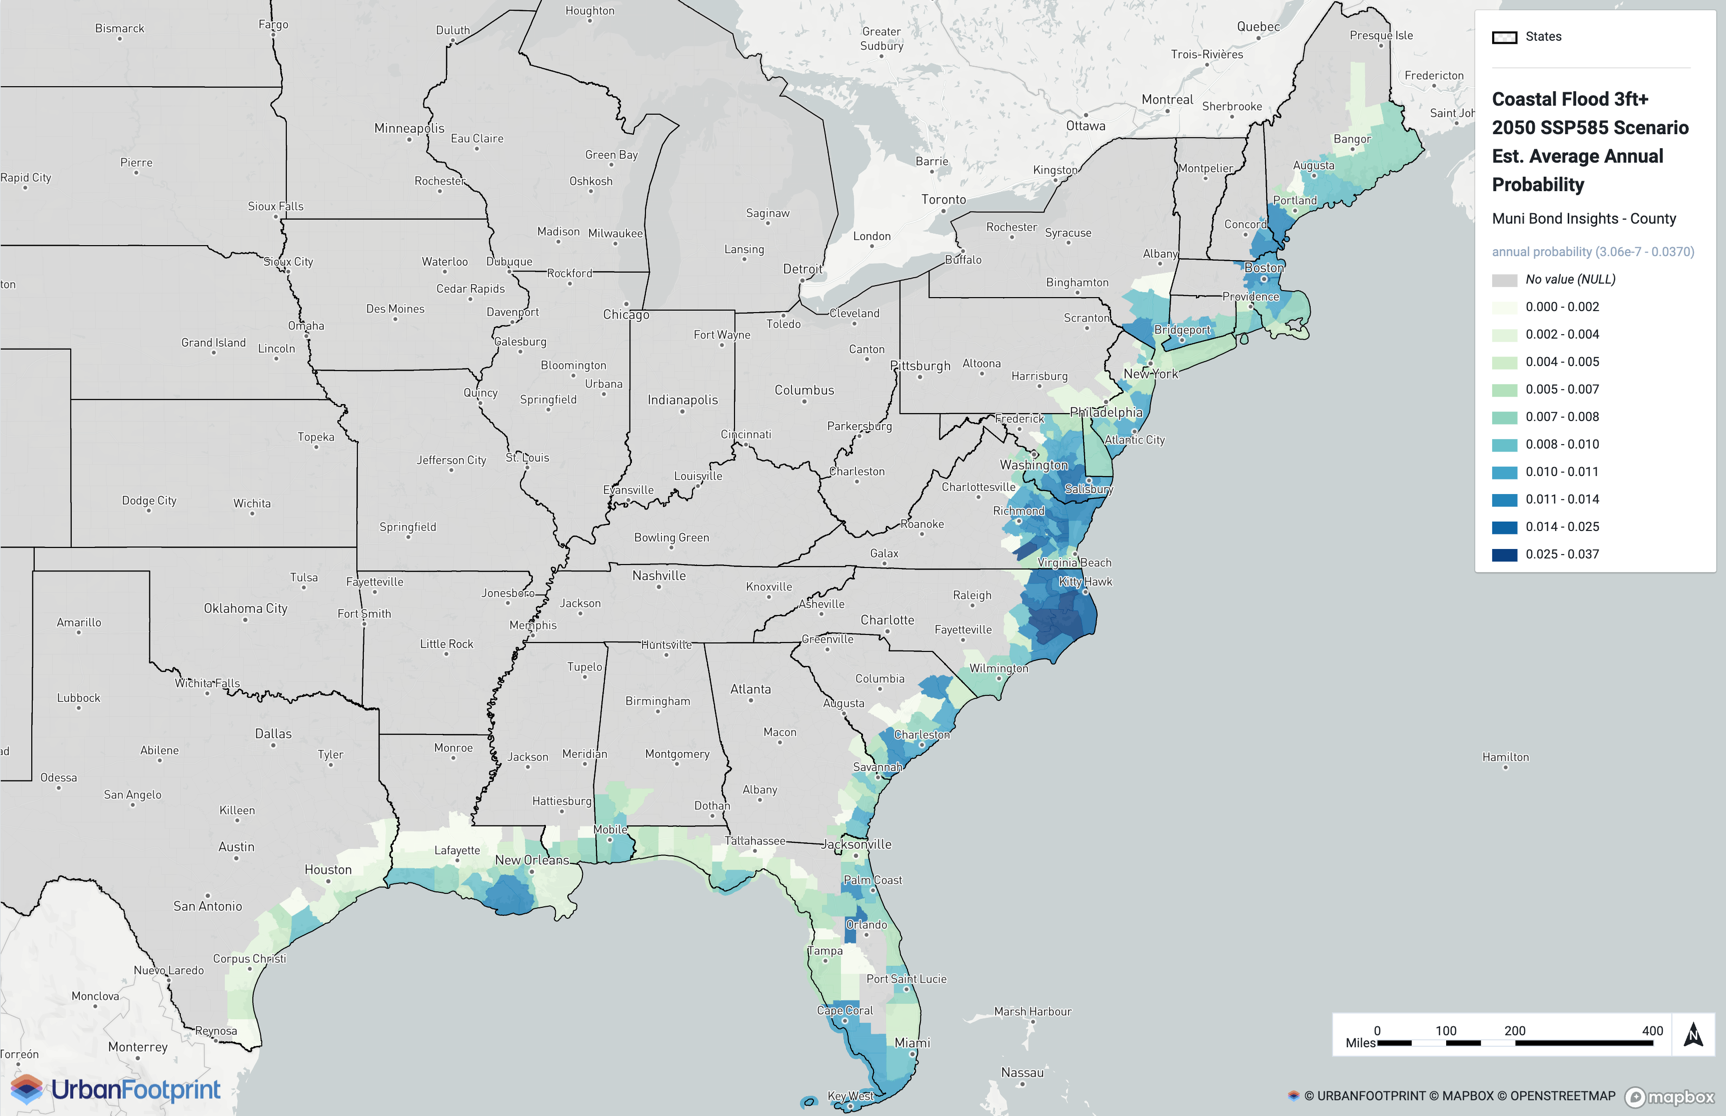
SSP5-8.5 2050 scenario
Details
UrbanFootprint Coastal Flood uniquely estimates both present and future coastal flood risk for the Gulf Coast and East Coast (specifically, from Texas to Maine) in the United States. This dataset accounts for the variability inherent in environmental factors, and the future scenario is calibrated to account for sea level rise adjustments. Our model calculates the exposure risk of parcels and community attributes to comprehensive flood inundation depths for present and future scenarios.
Our model combines these datasets:
NOAA National Storm Surge Risk – provides the Maximum Envelope of Water (MEOW) depths or worst snapshot of the basin for Saffir-Simpson Category 1-5.
NOAA Sea Level Rise Project – provides mean sea level rise.
UrbanFootprint Hurricane Winds – provides wind speed exceedance probabilities aligned with the Saffir-Simpson categories.
UrbanFootprint Base Canvas – Coastal flood metrics are presented at the parcel, aligned with UrbanFootprint Base Canvas.
We combine storm surge inundation depth data with hurricane probabilities of exceedance to assess the impact of hurricanes on surge depths and calculate the annual probability of exceedance for any flood depth. In this context, we assume that the surge depth for a given category (Saffir-Simpson Category 1-5) results from the induced surge from the corresponding hurricane category. Therefore, we assume that the surge exceedance probabilities equal the hurricane exceedance probabilities at the location, which accounts for differences in topography, location, and timing of the hurricane and surge.
We calculate annualized probabilities for different surge depths for current and future scenarios based on UrbanFootprint Hurricane Winds. For future time horizons, we adjust storm surge depths with local sea level rise inundation before fitting to account for climate change-driven compounding effects accurately.