Risk and Resilience Analysis
The Analyst Risk and Resilience module measures the potential impacts of natural hazards, supporting analysis of flooding and fire risk across the United States, and sea level rise risk in coastal areas. For a given project area, the module reports the acreage, population, number of dwelling units, number of jobs, and number of canvas geometries put at risk for each type of natural disaster.
Risk assessments for existing conditions and alternative land use scenarios yield insight into how natural hazards can impact regions now and into the future.
Analysis is run at the scale of the project canvas, generally parcels, yielding a mapped spatial output layer and corresponding data table; both can be used within Analyst for mapping and data exploration, and exported. The module also reports individual and comparative scenario results via summary charts, and generates a spreadsheet summary in Excel format.
Methodology
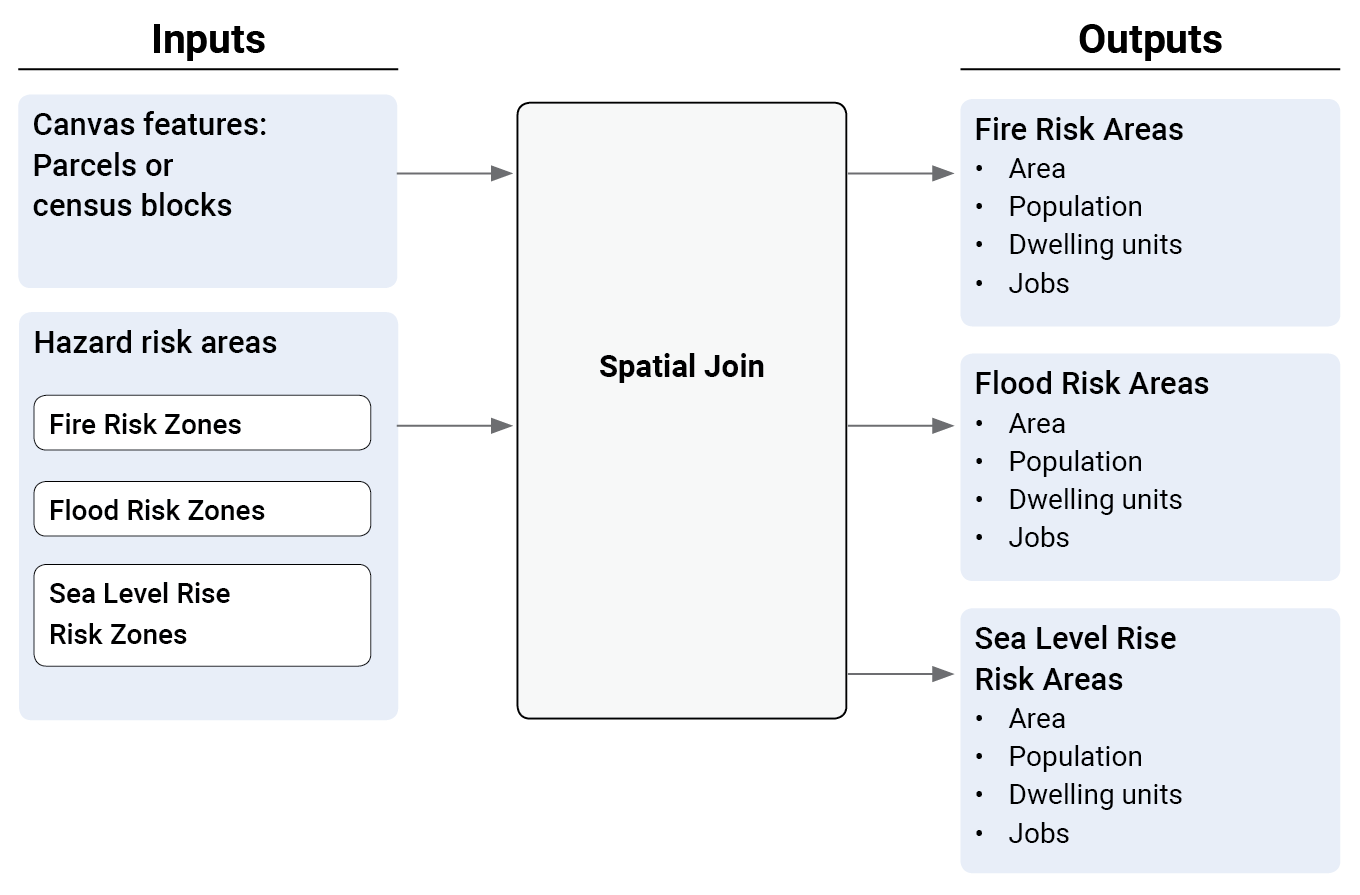
The module assesses hazard risk with respect to existing and future development by performing a spatial join between the base or scenario canvas and the various hazard zones. While conceptually straightforward—the land area, population, jobs, and development that intersect spatially with hazard areas are considered at risk—technical aspects of the analysis process are discussed here to convey a better understanding of the module outputs. Risk and Resilience Analysis Flow summarizes the analysis flow from inputs to outputs.
 |
Spatial Joins
The analysis uses spatial joins to determine whether canvas features lie within hazard areas. Depending on the size of the project area and corresponding number of canvas geometries (ranging from a few to hundreds of thousands of features), a spatial join can take a significantly long time. (A spatial join is the process by which data from one spatial layer gets associated with another based on how the features in the two layers intersect with each other—in this case, the attributes of scenario canvas features get associated with hazard zones.) To speed up the spatial joins, each canvas feature, by definition a polygon, is first converted to a representative point22, which is used in turn to determine whether the feature falls within a hazard zone. If so, the feature’s attributes are counted towards that hazard zone.
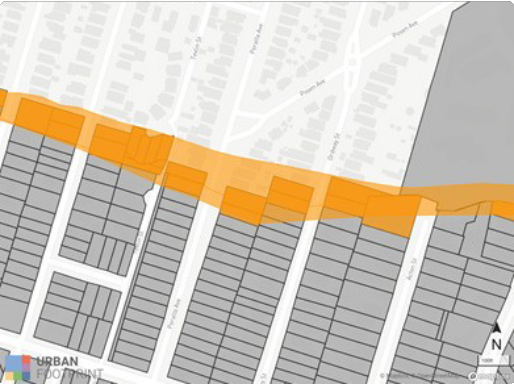
This approach does sacrifice some accuracy for speed. While it captures all canvas features that fall completely within a hazard zone, it will not capture all features that partially intersect with the risk zone. As an example, Example of flood zone/parcel intersection shows a result from a parcel-level project in Berkeley, CA. The orange area depicts a flood zone. The parcels symbolized in orange fall within the flood zone according to the spatial process, while those shown in gray are not.
 |
Rising Sea Level Calculations
The sea level rise impact analysis results in a value for each canvas feature that corresponds to the lowest level of sea rise by which it is affected. For example, a parcel with a calculated Sea Level Rise Impact value of 2 feet would be assumed to flood at all levels from 2 feet and up. Thus, in summarizing the areas at risk of flooding with 6 feet of sea level rise, the module takes into account all features with values of 6 feet and below (e.g., 4 feet and 2 feet sea level rise).
Input Parameters
Flood Layers
The Federal Emergency Management Agency (FEMA) creates the National Flood Hazard Layer (NFHL) that contains current effective flood hazard mapping data. The module uses data from FEMA, and filters this dataset down to the Special Flood Hazard Areas (SFHA). However, not all counties are available through FEMA’s data portal. The status and coverage of FEMA’s datasets are available through the FEMA website at https://www.floodmaps.fema.gov/NFHL/status.shtml.
The SFHA is the area where the National Flood Insurance Program (NFIP) floodplain management regulations must be enforced and the area where the mandatory purchase of flood insurance applies.
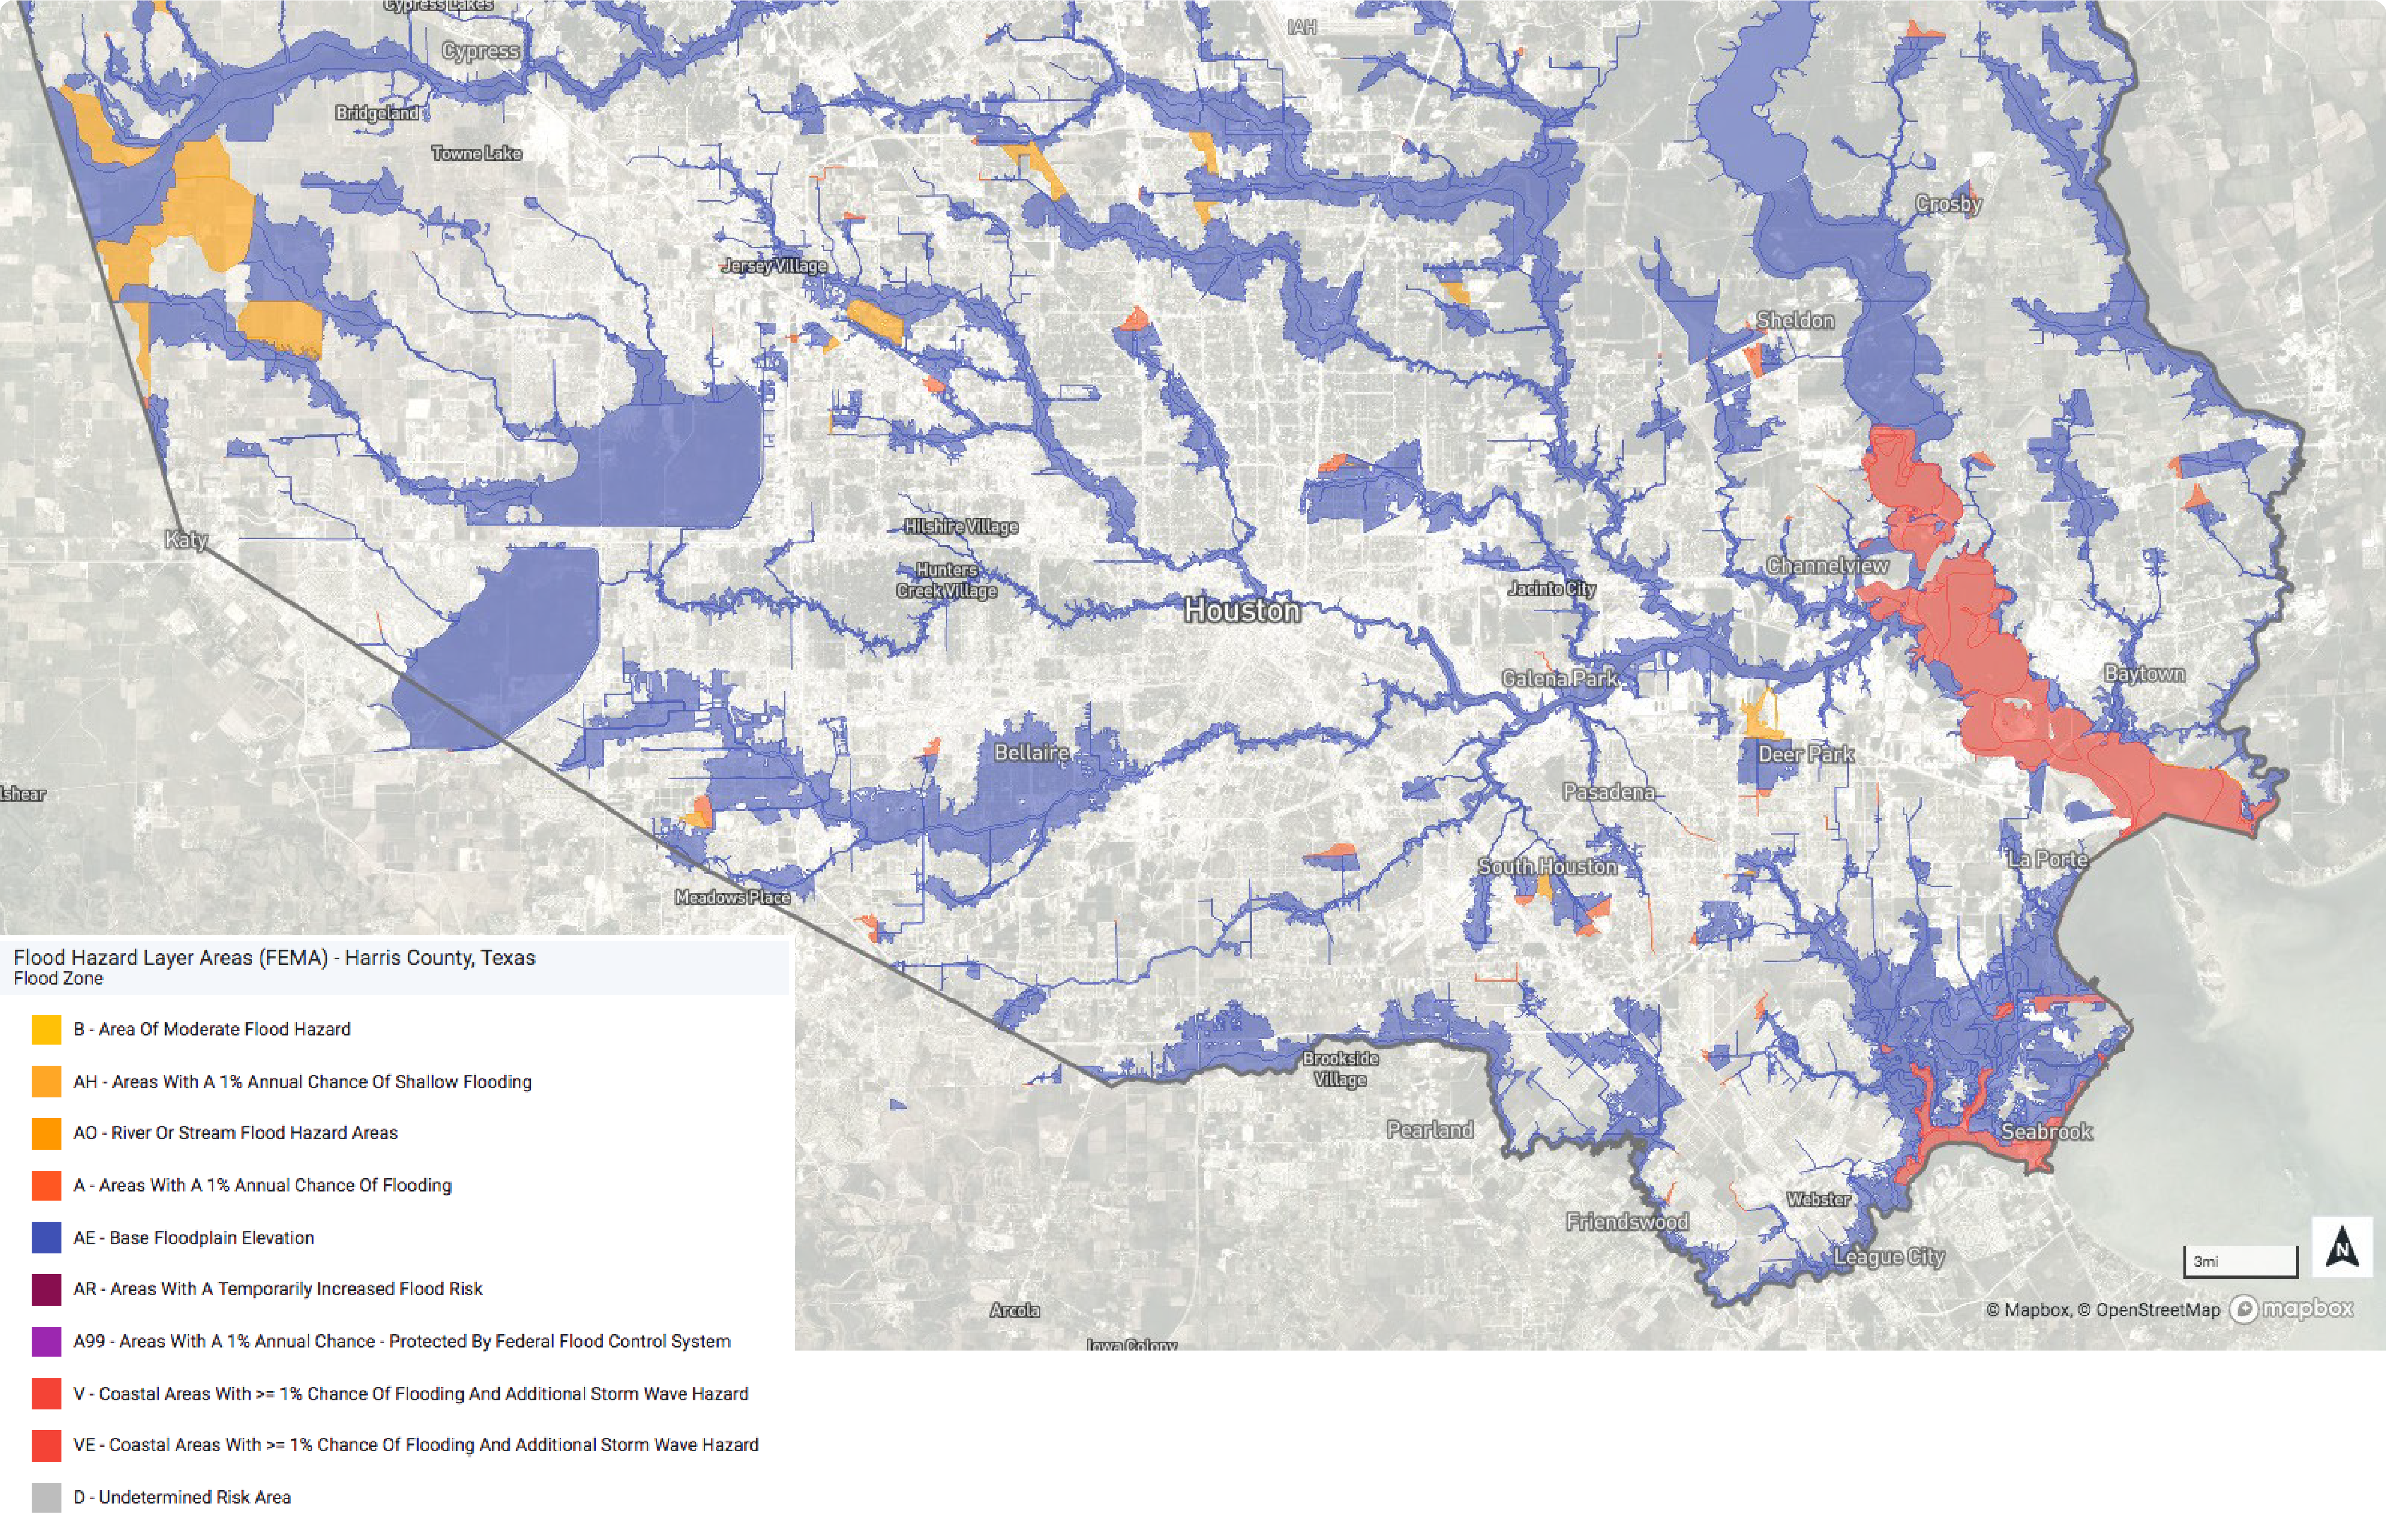
The SFHA includes Zones A, AO, AH, A1-30, AE, A99, AR, AR/A1-30, AR/AE, AR/AO, AR/AH, AR/A, VO, V1-30, VE, and V. These zones are described in Flood Zone Designations.23 Special Flood Hazard Area (SFHA) zones in Harris County, TX (Houston area) shows an example of SFHA zones as mapped in Analyst.
Zone | Description |
|---|---|
A | Areas with a 1% annual chance of flooding and a 26% chance of flooding over the life of a 30‐year mortgage. Because detailed analyses are not performed for such areas; no depths or base flood elevations are shown within these zones. |
AE | The base floodplain where base flood elevations are provided. AE Zones are now used on new format FIRMs instead of A1‐A30 Zones. |
A1-30 | These are known as numbered A Zones (e.g., A7 or A14). This is the base floodplain where the FIRM shows a BFE (old format). |
AH | Areas with a 1% annual chance of shallow flooding, usually in the form of a pond, with an average depth ranging from 1 to 3 feet. These areas have a 26% chance of flooding over the life of a 30‐year mortgage. Base flood elevations derived from detailed analyses are shown at selected intervals within these zones. |
AO | River or stream flood hazard areas, and areas with a 1% or greater chance of shallow flooding each year, usually in the form of sheet flow, with an average depth ranging from 1 to 3 feet. These areas have a 26% chance of flooding over the life of a 30‐year mortgage. Average flood depths derived from detailed analyses are shown within these zones. |
AR | Areas with a temporarily increased flood risk due to the building or restoration of a flood control system (such as a levee or a dam). Mandatory flood insurance purchase requirements will apply, but rates will not exceed the rates for unnumbered A zones if the structure is built or restored in compliance with Zone AR floodplain management regulations. |
A99 | Areas with a 1% annual chance of flooding that will be protected by a Federal flood control system where construction has reached specified legal requirements. No depths or base flood elevations are shown within these zones. |
V | Coastal areas with a 1% or greater chance of flooding and an additional hazard associated with storm waves. These areas have a 26% chance of flooding over the life of a 30‐year mortgage. No base flood elevations are shown within these zones. |
VE, V1-30 | Coastal areas with a 1% or greater chance of flooding and an additional hazard associated with storm waves. These areas have a 26% chance of flooding over the life of a 30‐year mortgage. Base flood elevations derived from detailed analyses are shown at selected intervals within these zones. |
 |
Sea Level Rise
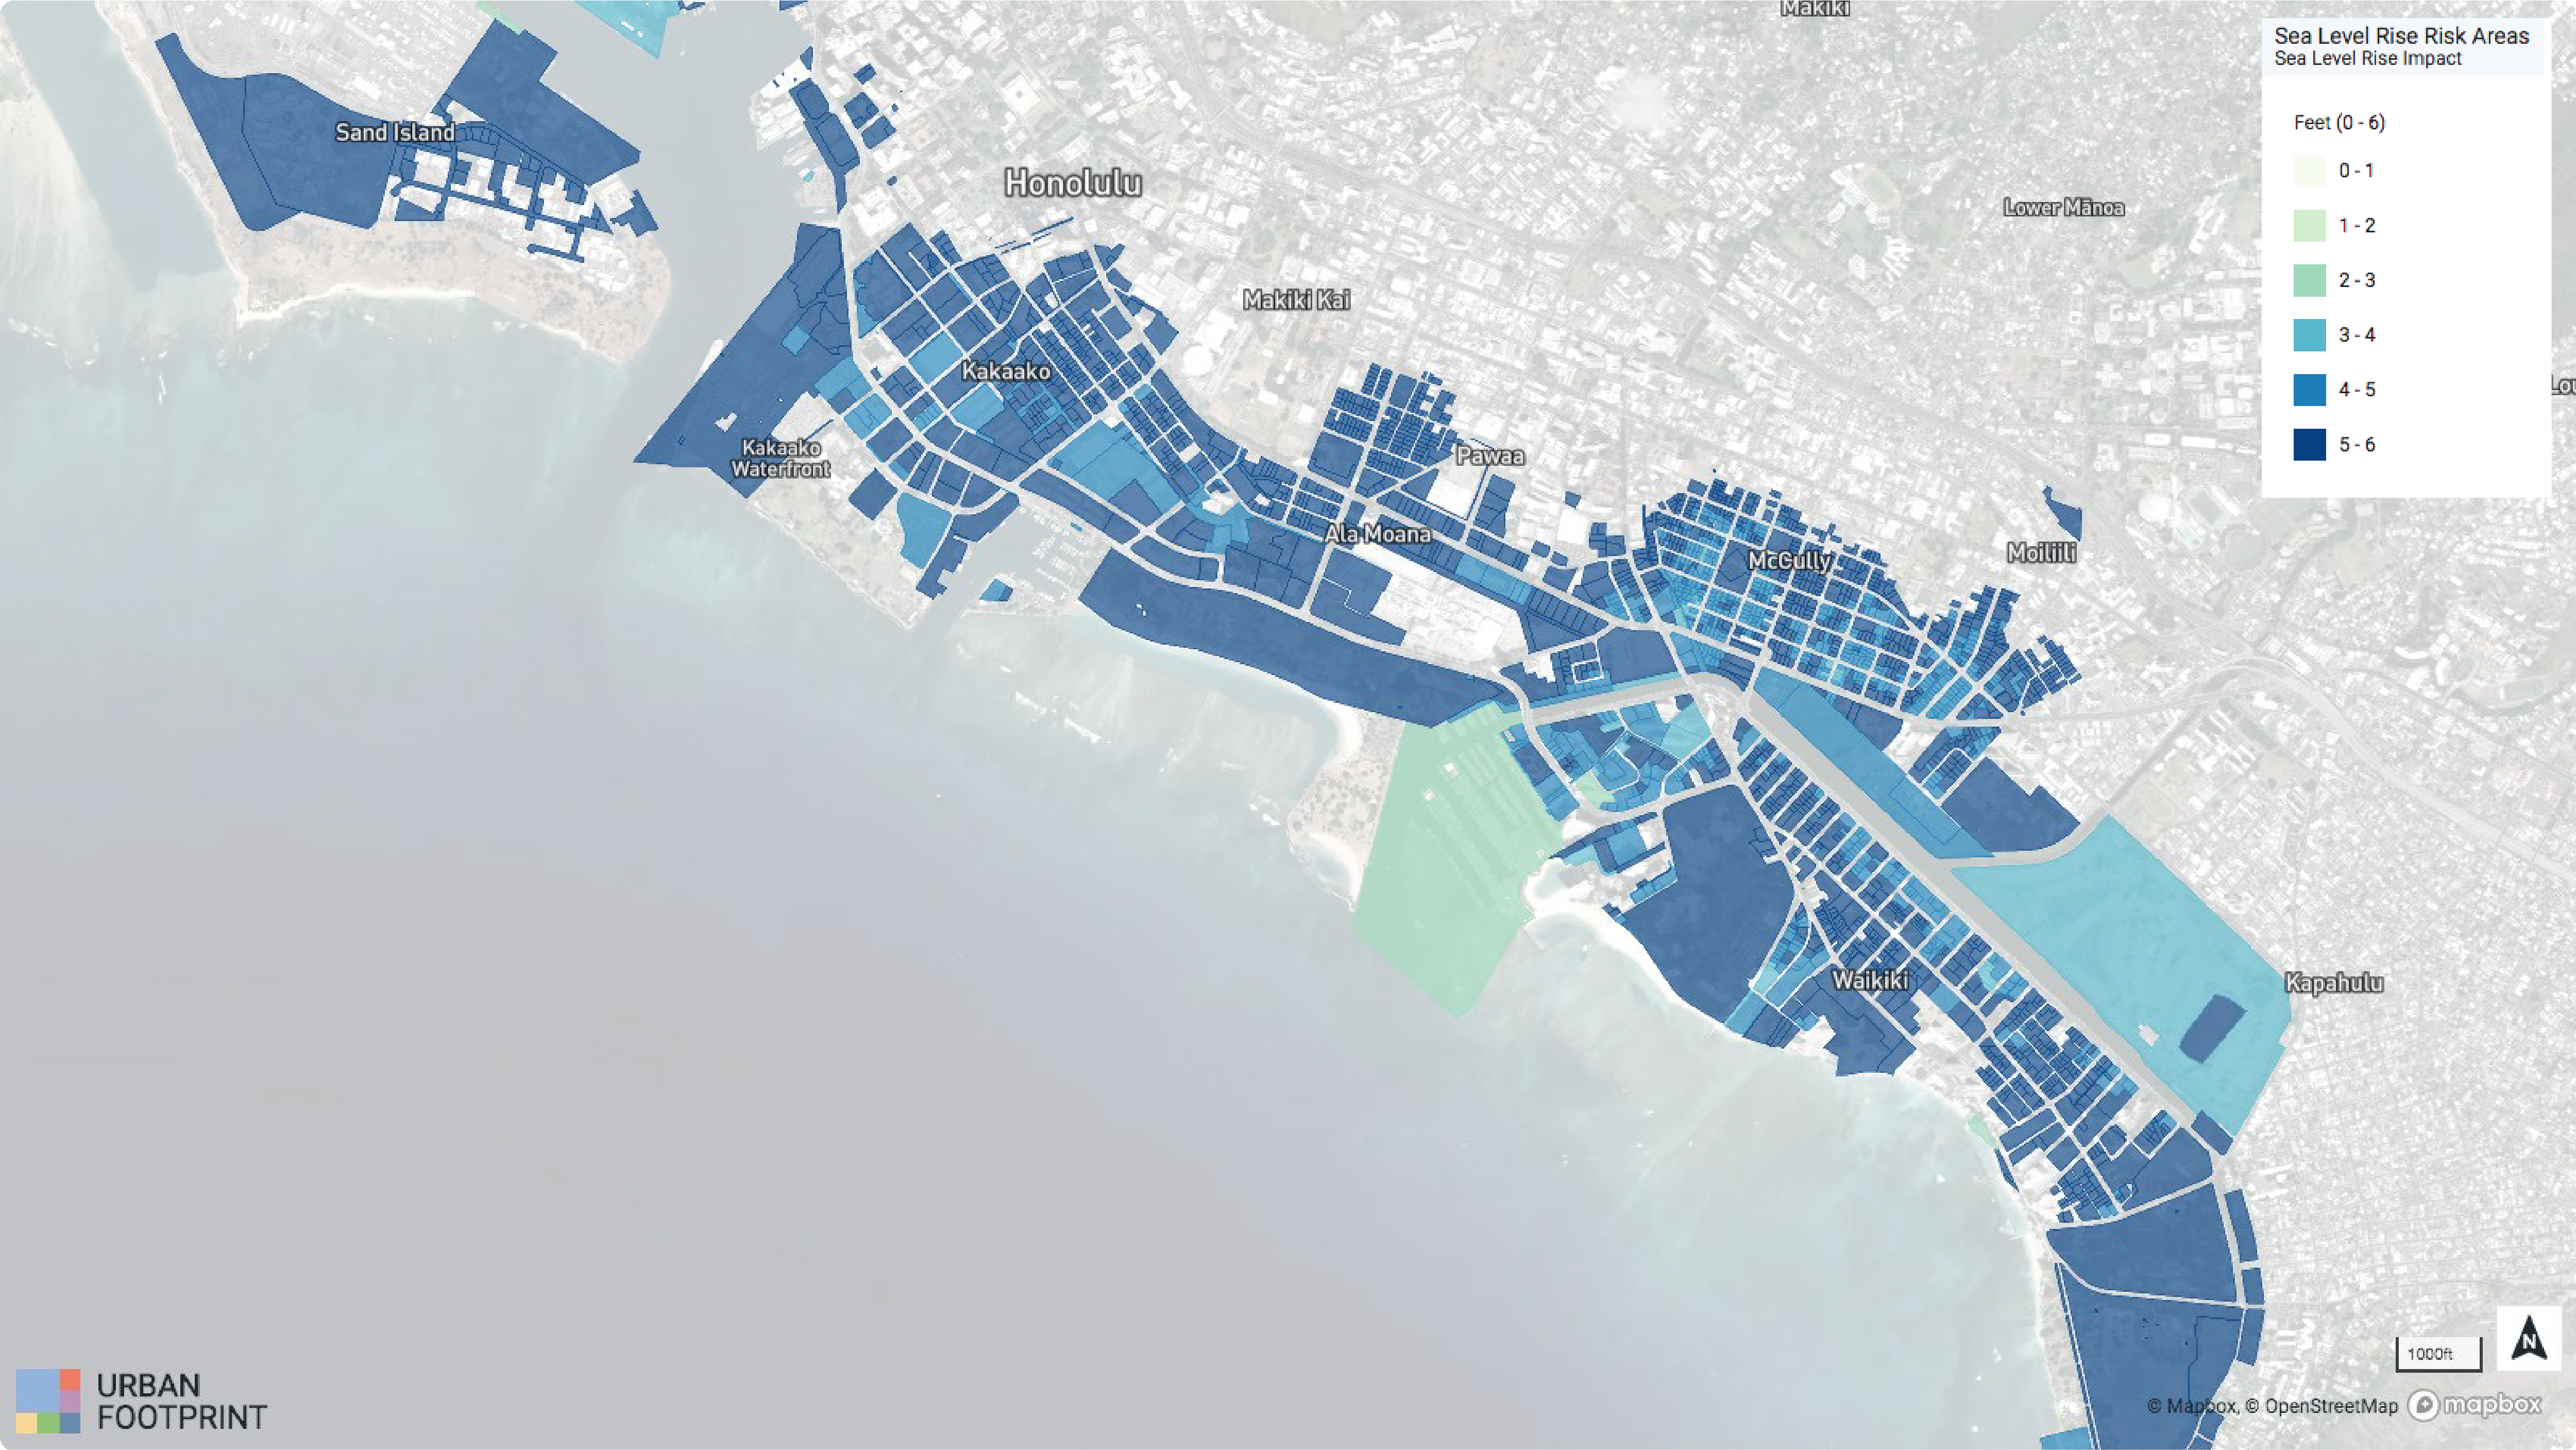
National Oceanic and Atmospheric Administration (NOAA) creates spatially explicit datasets (last updated August 2019) that depict the potential inundation of coastal areas resulting from a projected 1 to 6 feet rise in sea level above current Mean Higher High Water (MHHW) conditions (treated as 0 feet). The module summarizes and reports impacts by sea level rise height zone. Sea Level Rise in Honolulu, HI shows an example of NOAA sea level rise zones as mapped in Analyst.
The NOAA datasets also include low-lying areas that are hydrologically disconnected from the main water body. These low-lying areas are determined solely by how well the elevation data captures the area’s drainage characteristics. Therefore, the mapping may not accurately capture detailed hydrologic/hydraulic features such as canals, ditches and stormwater infrastructure.
 |
More detailed data are used where available. For projects in Southern California, the module uses USGS Coastal Storm Modeling System (CoSMoS) v3.0 Phase 2 data (last updated January 2017) as the basis for sea level rise risk. CoSMoS makes detailed predictions (meter-scale) over large geographic scales (100s of kilometers) of storm-induced coastal flooding and erosion for both current and future sea-level rise (SLR) scenarios. The Phase 2 data includes future SLR scenarios spanning 0 (current MHHW conditions) to 5 meters of sea level rise across the Southern California region from the Mexican Border to Point Conception. For the purpose of this analysis module, sea level rise scenarios are observed alongside average storm conditions. This means that any additional flooding associated with the impacts of a flood event (e.g., a 100-year flood) are not considered in the outputs of the sea rise risk component of the module.
Fire
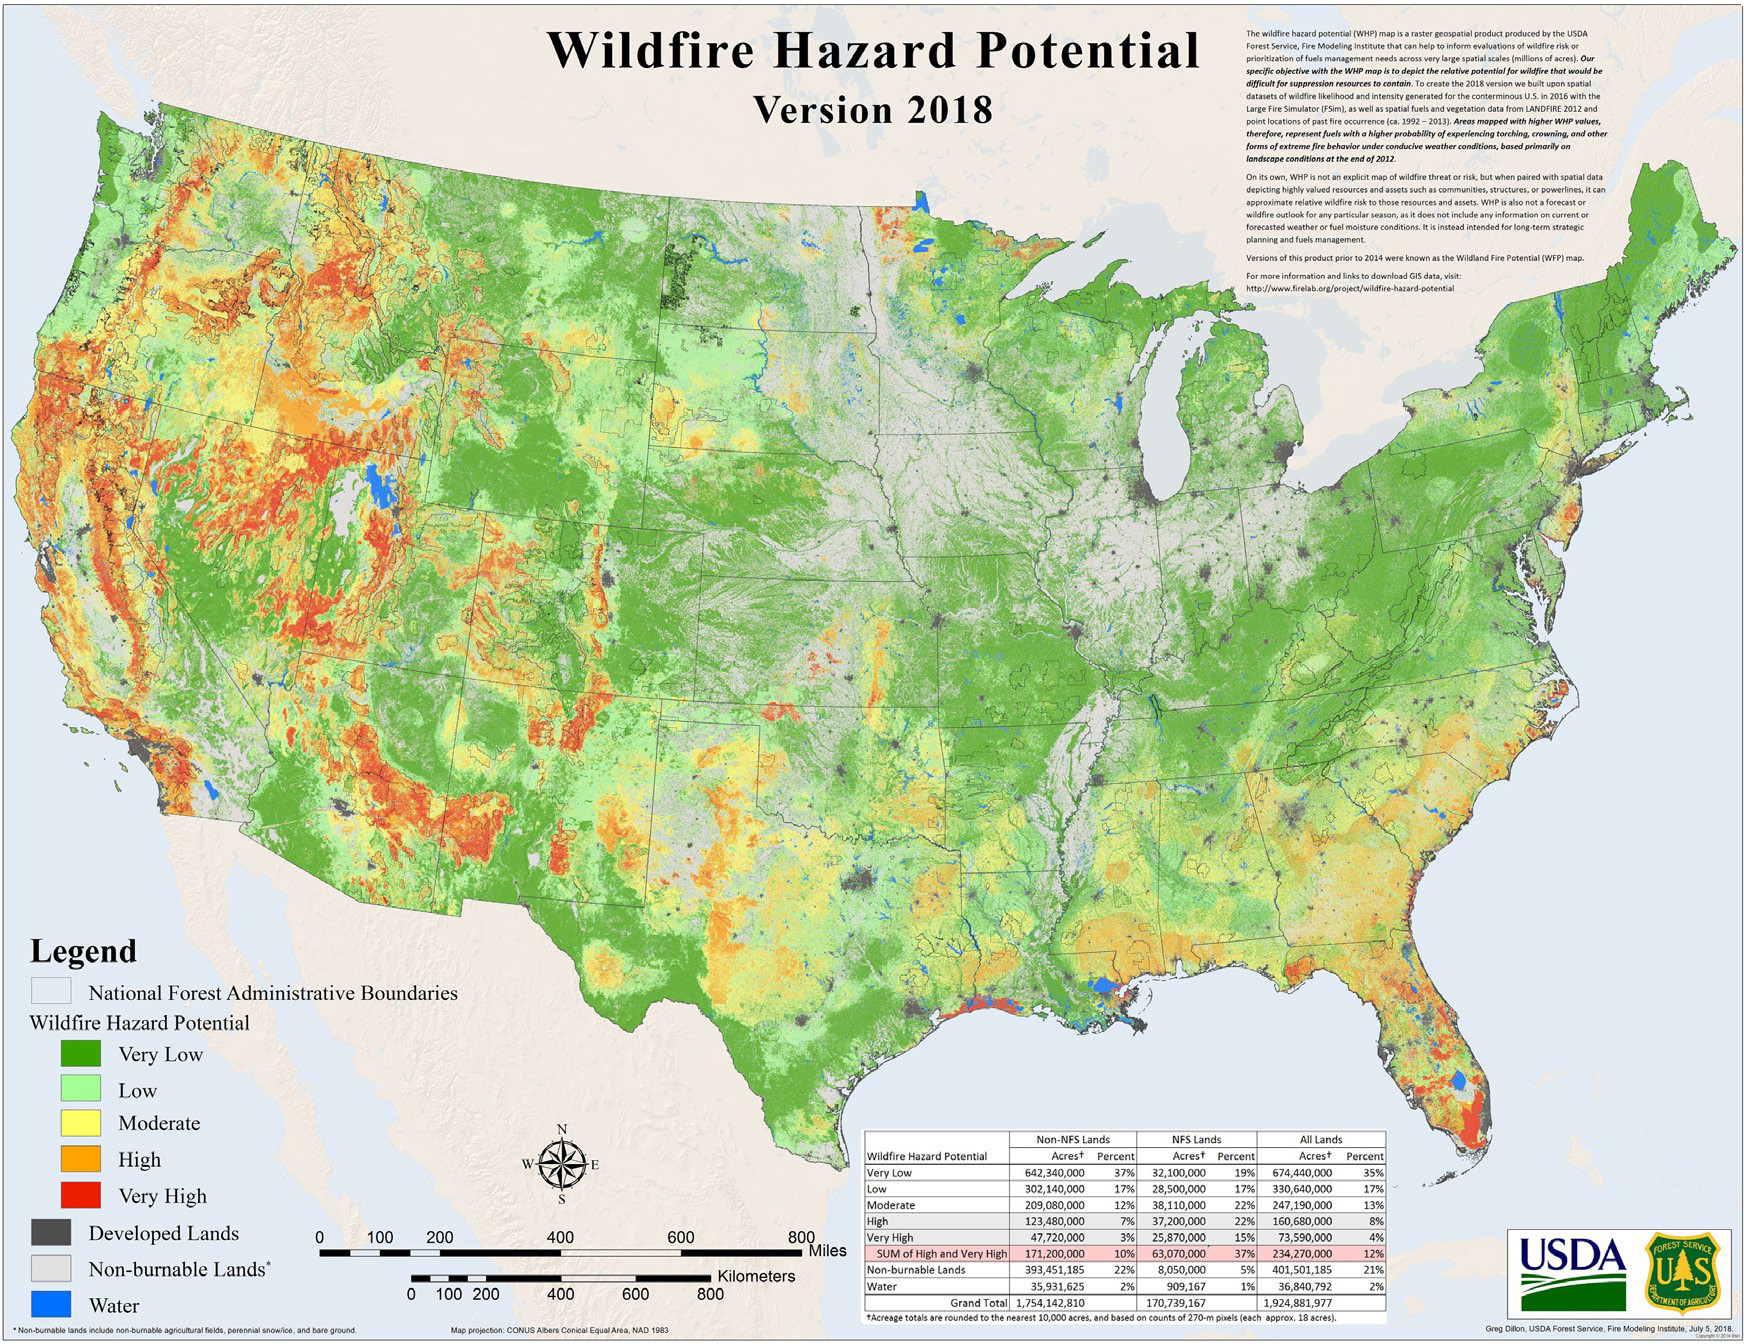
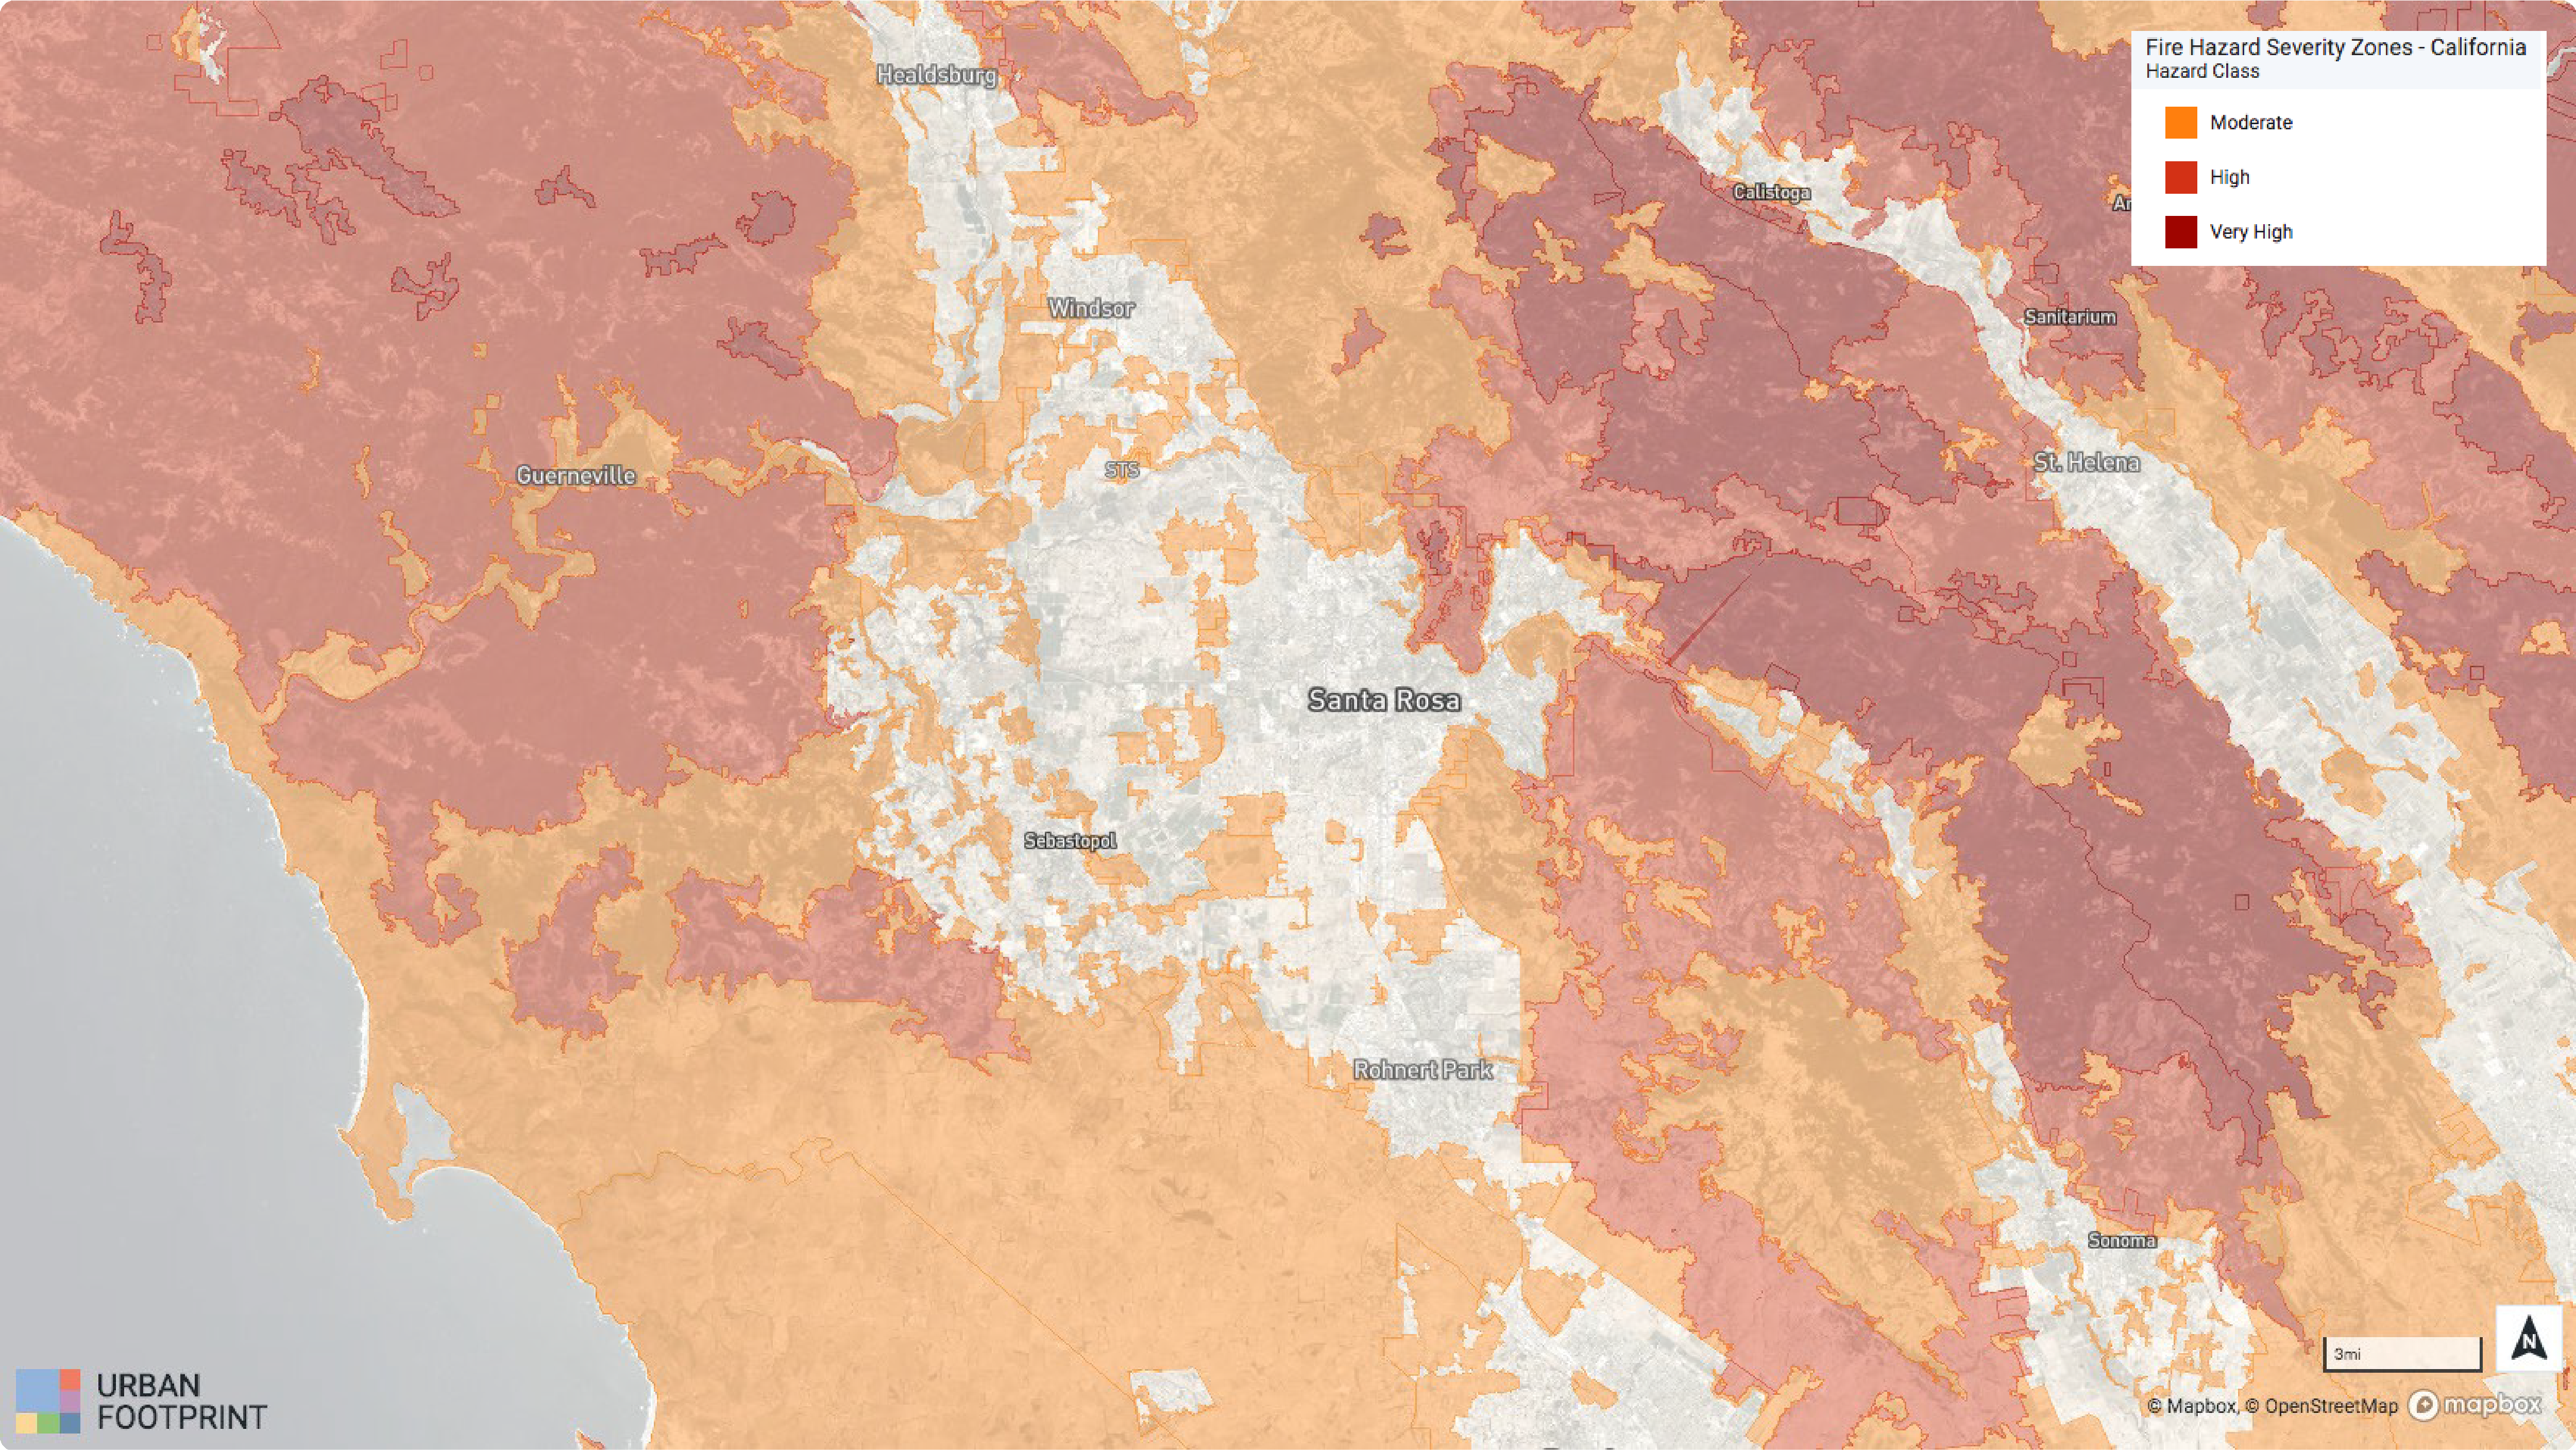
The dataset used by the module to assess wildfire risk varies by geographic location. The USDA Forest Service Fire Modeling Institute’s Wildfire Hazard Potential dataset is used as the default data source for nationwide fire risk analysis. In California, the module uses Fire Hazard Severity Zones produced by the California Department of Forestry and Fire Protection (CALFIRE). In Oregon and Washington, the module uses the USDA Forest Service’s Integrated Annual Burn Probability data from the 2018 Pacific Northwest Quantitative Wildfire Risk Assessment.
USDA Forest Service Wildfire Hazard Potential
The USDA national dataset portrays the relative potential for wildfire that would be difficult for suppression resources to contain. The dataset was last updated on July 9, 2018 and was built utilizing spatial datasets of wildfire likelihood and intensity across the contiguous US. The layer is based on 2016 data using the Large Fire Simulator (FSim), LANDFIRE data from 2012 related to spatial fuels and vegetation, and location data of historic fires from 1992 - 2013. The module analyzes areas classified as having Moderate, High, or Very High wildfire hazard potential, as shown in USDA Forest Service Wildfire Hazard Potential Map.
 |
California Fire Hazard Severity Zones
The California Department of Forestry and Fire Protection (CALFIRE) has mapped areas of significant fire hazards based on fuels, terrain, weather, and other relevant factors for the state of California. These datasets include both the state responsibility areas (SRAs) as well as the local responsibility areas (LRAs) and were last updated in 2007. These areas are classified into three fire hazard severity zones—Moderate, High, and Very High, as shown in California Fire Hazard Severity Zones in Sonoma County. Other classifications include Urban Unzoned and Non-Wildland/Non-Urban.
 |
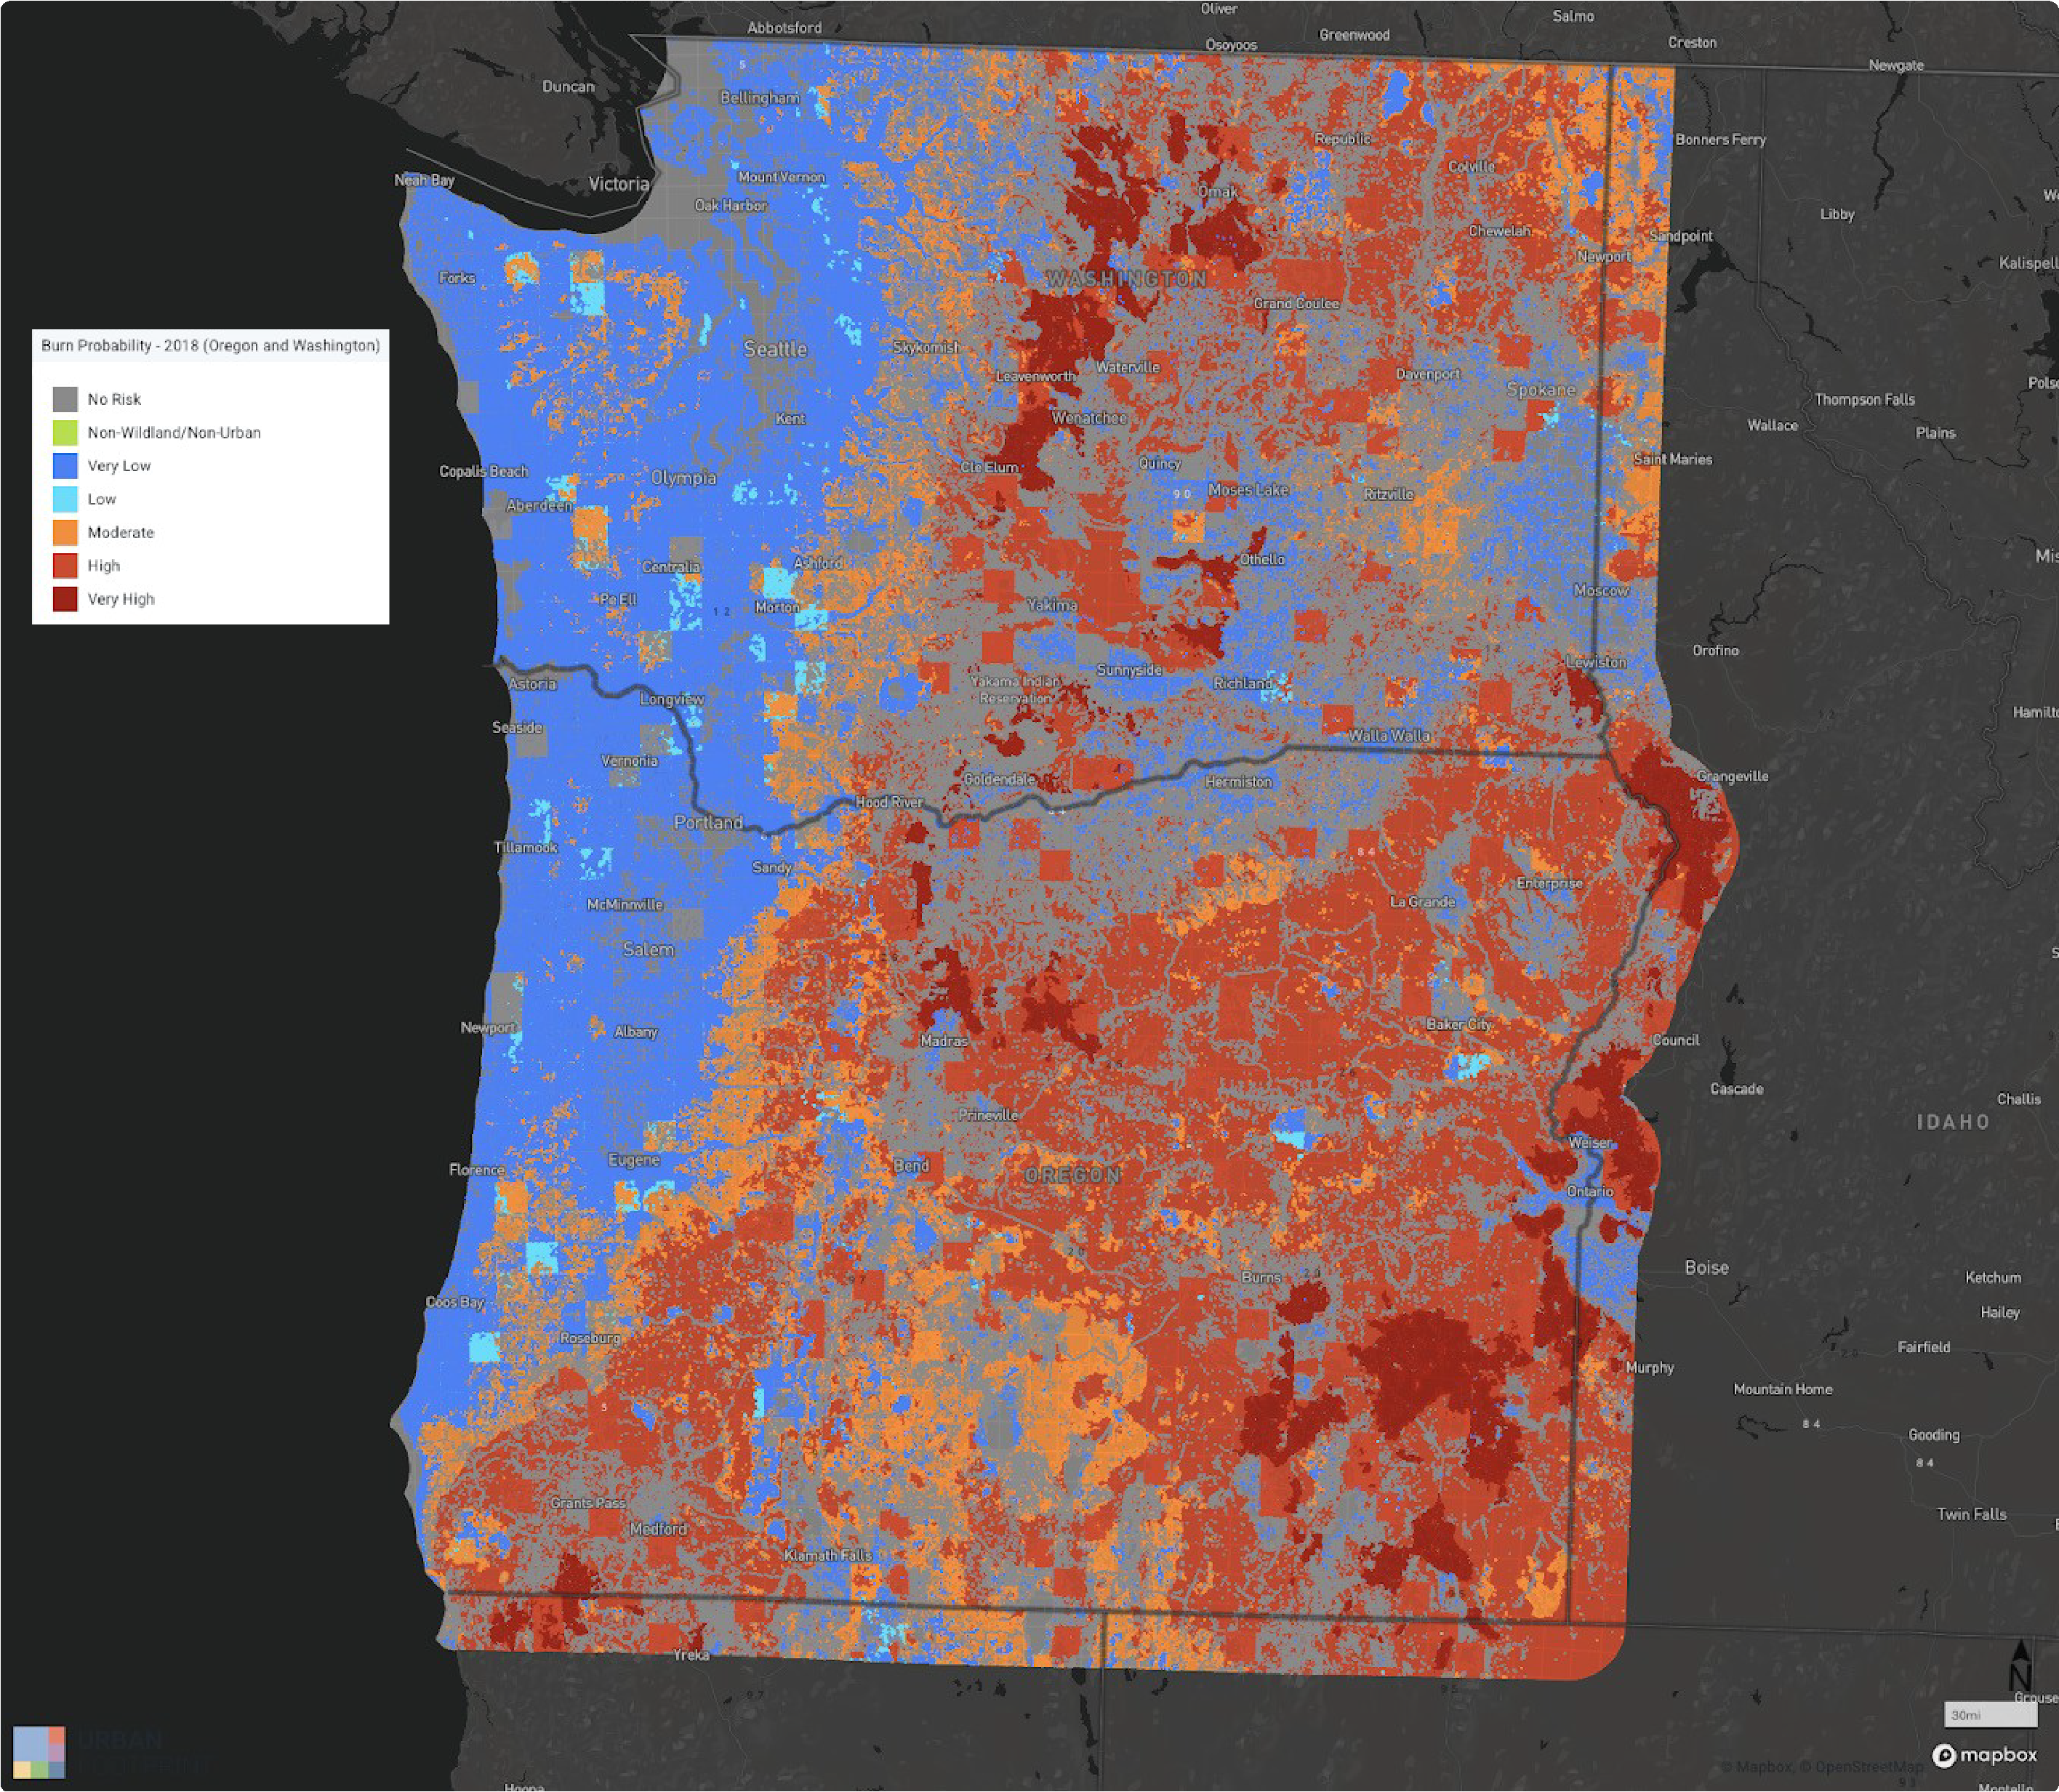
Pacific Northwest Quantitative Wildfire Risk Assessment
The USFS Pacific Northwest Region Wildfire Risk Assessment provides information about wildfire hazard and risk to highly valued resources and assets across Oregon and Washington. The data layer used in the Risk and Resilience module, Integrated Annual Burn Probability, measures the likelihood of a wildfire greater than 250 acres burning a given location, based on the assessment’s wildfire simulation modeling. The probabilities are binned into five categories: Non-burnable, Low, Moderate, High, and Very High, as shown in Burn Probability by Category in Oregon and Washington. The break points for these categories is defined as follows:
Nonburnable: In this area there are a majority of non-burnable fuel types such as water, urban, agriculture, barren rock, glacial areas, etc.
Low: The annual probability that a wildfire will burn a given point on the landscape. Low burn probability indicates less than approximately 1 in 5,000 chance of a wildfire >250 acres in a single year. Low represents up to the 11th percentile of values across the landscape.
Moderate: The annual probability that a wildfire will burn a given point on the landscape. Moderate burn probability indicates between 1 in 5,000 and 1 in 500 chance of a wildfire >250 acres in a single year. Moderate represents up to 11th to 29th percentile of values across the landscape.
High: The annual probability that a wildfire will burn a given point on the landscape. High burn probability indicates between 1 in 500 and 1 in 50 chance of a wildfire >250 acres in a single year. High represents the 29th to 96th percentile of values across the landscape.
Very High: The annual probability that a wildfire will burn a given point on the landscape. Very High burn probability indicates greater than 1 in 50 chance of a wildfire >250 acres in a single year. Very High represents greater than the 96th percentile of values across the landscape.
More detailed methodology can be found in the Assessment Methodology and Results paper.24
 |
Output Metrics
The Risk and Resilience module generates four spatial output layers and corresponding data tables that can be used within Analyst for mapping and data exploration, and exported. The four output layers include:
All Natural Hazard Risk Areas – For each canvas feature, indicates land area, population, dwelling units, and jobs, and the outputs for fire, flood, and sea level rise risk. This summary layer is useful for bringing together all outputs into a single table, while the individual risk layers enable mapping of multiple risk types at once via separate layers.
Fire Risk Areas – For each canvas feature, indicates land area, population, dwelling units, and jobs and the outputs for fire risk alone.
Flood Risk Areas – For each canvas feature, indicates land area, population, dwelling units, and jobs and the outputs for flood risk alone.
Sea Level Rise Risk Areas – For each canvas feature, indicates land area, population, dwelling units, and jobs and the outputs for sea level rise risk alone.
The module also reports individual and comparative scenario results via summary charts, and generates a spreadsheet summary in Excel format. The attributes of the spatial output/data table are summarized in Risk and Resilience Module Outputs.
Attribute | Data Type | Description |
|---|---|---|
Area | Numeric | Acreage that falls in the hazard zone. |
Population | Numeric | Number of individuals that fa the hazard zone. |
Dwelling Units | Numeric | Number of dwelling units that fall in the hazard zone. |
Jobs | Numeric | Number of jobs that fall in the hazard zone. |
Flood Zone | Text | Special Flood Hazard Area category within which the canvas feature is located. |
Sea Level Rise Impact | Numeric | The lowest sea level rise height that impacts the canvas feature. All heights above this value are assumed to also impact this feature. |
Fire Hazard Zone | Text | The fire hazard zone within which the feature is located. |
22A quickly computed point that is guaranteed to be located within the geometric object.
23For additional descriptions of each zone, refer to Appendix D (D-11) of FEMA document "IS-9 Managing Floodplain Development Through the National Flood Insurance Program (NFIP)"