Parcel and Census Hazard Summaries
We spatially intersect our parcel canvas built environment and community data with our hazards. We then provide aggregated estimates of risk at census or portfolio scales. See Hazard Summaries for additional information about hazards supported for each insight and aggregation.
 |
Parcel Summaries
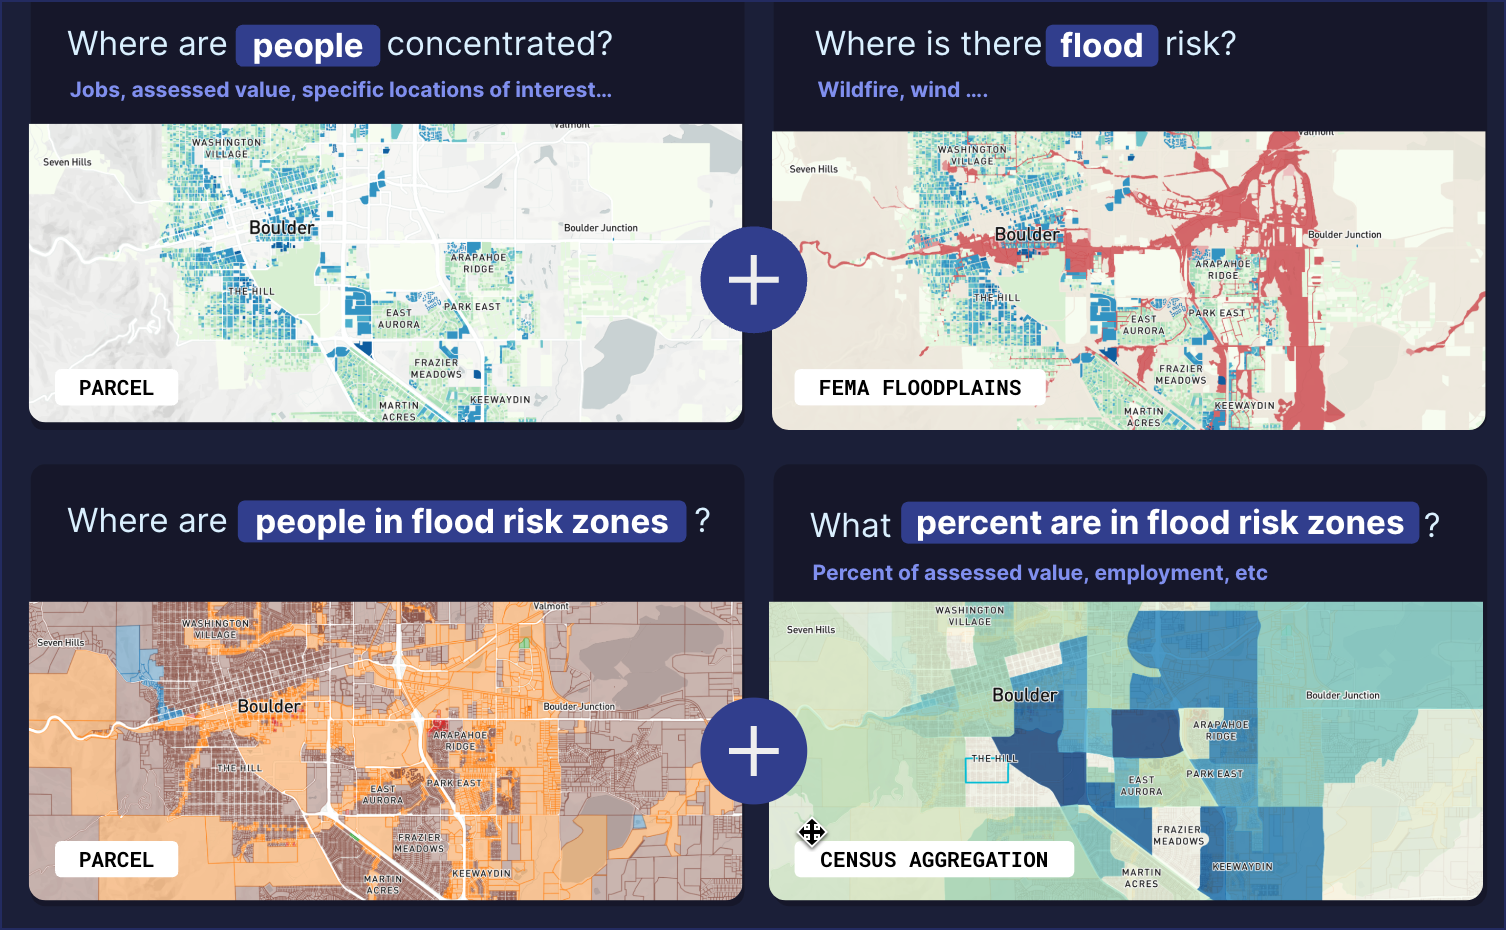
To assign a hazard exposure value for a parcel, we summarize the environmental hazards present at the asset from a series of spatial intersections. For example, we create an intersection of the parcel with each of our hazard data layers, such as sea-level rise, storm surge, and so on.
We then combine those intersections into a single summary table describing the hazard severity at that parcel. When an asset intersects with more than one hazard value, we assign it to the highest (or “worst”) hazard value with which it intersects. We define the “worst” hazard value according to pre-configured hazard level rankings. For example, if any part of the parcel overlaps with a floodplain, the parcel is said to be in a floodplain.
Census Summaries
We also summarize the asset exposure by aggregating select attributes of the community, such as population, property value, and so on, at supported geographic levels. When aggregating to the census aggregation, we bin the hazards by severity to provide summary metrics of exposure to each severity level. For example, we can summarize the percent of households exposed to 3 feet or more of inundation within a specific tract due to a Category 4 hurricane.