Report Mode - Canvas Summary Statistics
Analyst uses a set of Summary Statistics to represent development characteristics across scenarios. Summary Statistics include totals for population, households, homes, jobs, and building area.
Whether you're developing scenarios to meet control totals for growth, or to compare the capacity of plans or development options, summary statistics are useful for checking progress as well as reporting final results.
Note that scenario Summary Statistics cover the entire project area. To calculate Summary Statistics for subareas within your project area, you always have the option of working directly with the Base Canvas and scenario canvas layers to make subarea selections, create filtered layers, and summarize data via the data table or CSV exports.
Work with Scenario Summary Statistics
To view, compare, and export summary statistics:
Enter Report mode by clicking the Report mode icon
 in the Mode bar. The Report screen appears.
Select Summary Statistics from the list on the left side of the screen, if not already selected. The Summary Statistics screen appears.
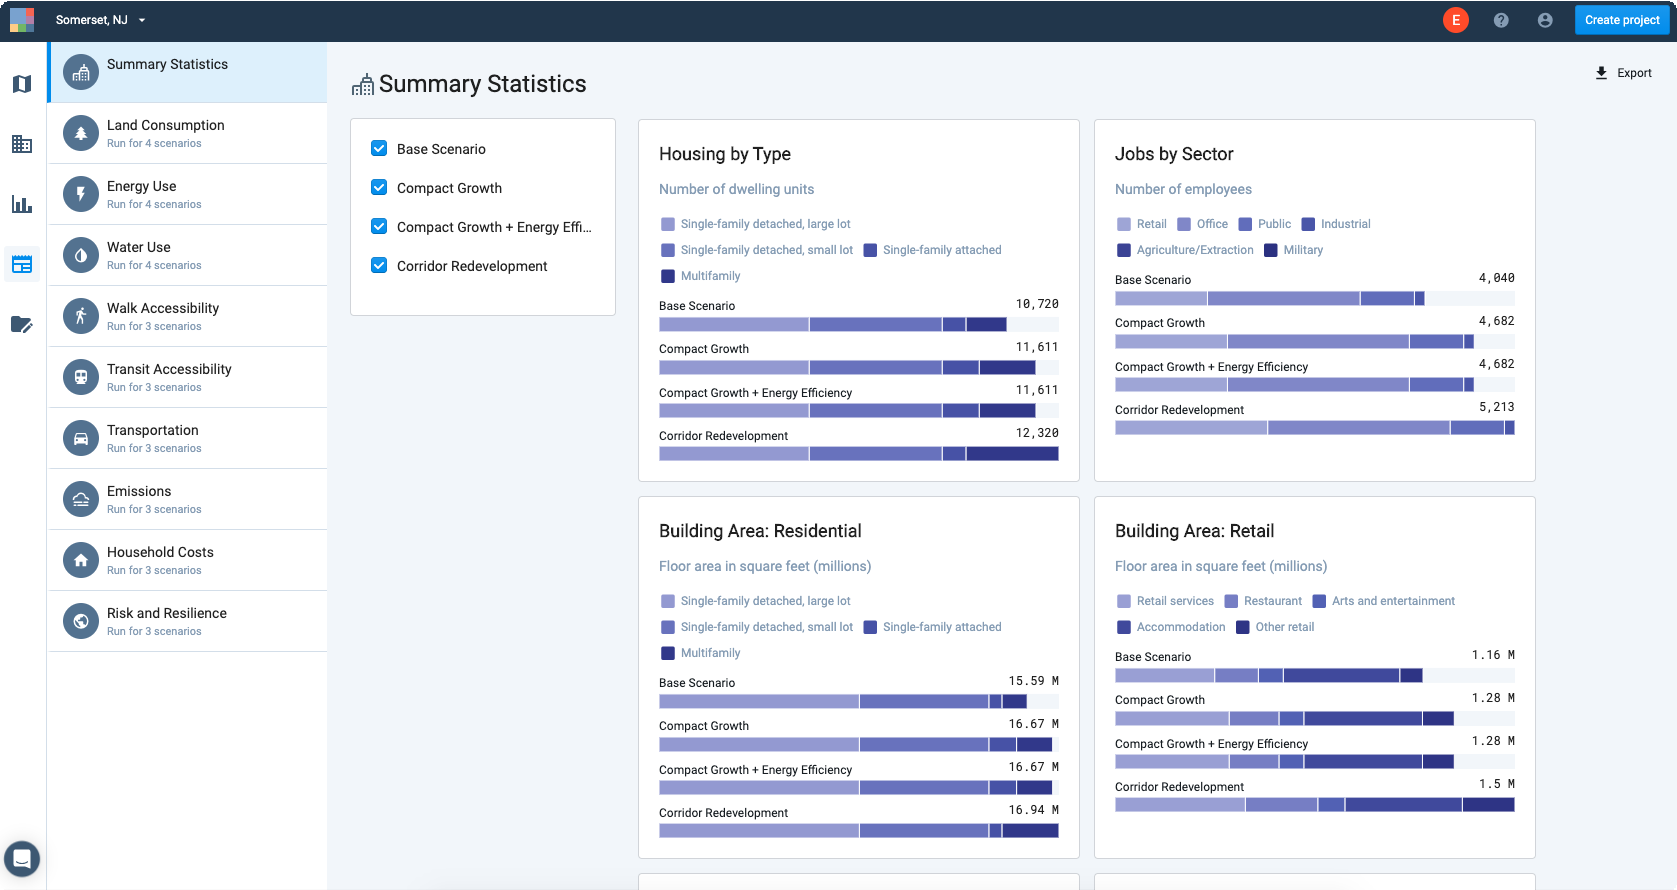
View of Summary Statistics in Report mode
Use the scenario checkbox controls in the upper left corner to select the scenarios for which you would like to view statistics. By default, all scenarios are turned on.
View and compare scenario statistics. Scroll down to see all the charts. Hovering over the individual sections of stacked bar charts (for example, in Jobs by Sector) displays sub-category values.
The charts are dynamically generated and cannot be downloaded. However, you can export the summary statistics to develop custom charts in other programs.
To export scenario results, click
 Export. An Excel report containing all data as represented by the charts will be downloaded to your computer.
Summary Statistics for Base and Scenario Canvases
Scenario Summary Statistics are generated for each scenario. They include:
Population
Housing
Households
Jobs
Dwelling units by type
Single-family detached, large lot
Single-family detached, small lot
Single-family attached
Multifamily
Jobs by sector
Retail
Office
Public
Industrial
Agriculture/Extraction
Military
Residential building floor area by housing type
Single-family detached, large lot
Single-family detached, small lot
Single-family attached
Multifamily
Retail building floor area by subsector
Retail services
Restaurant
Arts and Entertainment
Accommodation
Other retail
Office building floor by subsector
Office services
Medical services
Public building floor area by subsector
Public administration
Education
Industrial building floor area by subsector
Transportation/Warehouse
Wholesale