Run an Analysis for Insights
When working with layers in Analyst, you can run an analysis to understand the surrounding communities and the potential hazards that may impact them. This relates the Resilience Insights available to your organization to the specific locations you've selected.
You can choose a point, line, or polygon layer available in Analyst, including any data layers available from our reference library, layers you've added to the project, or any layers we've processed or uploaded for you. See Insights Layers for more information about the available Insights.
If you're using a polygon layer, polygons must be between 25 - 110,000 km2. Polygons over 10,000 km2 will not generate parcel outputs. We recommend using a project with fewer than 500,000 locations. Contact us if you need to process a larger set of locations.
If you don't already have your locations available as layers in a project in Analyst, you should first find your locations.
Open your project in Analyst.
From the Layers list, click the layer on which you would like to get additional insights.
Select Insights.
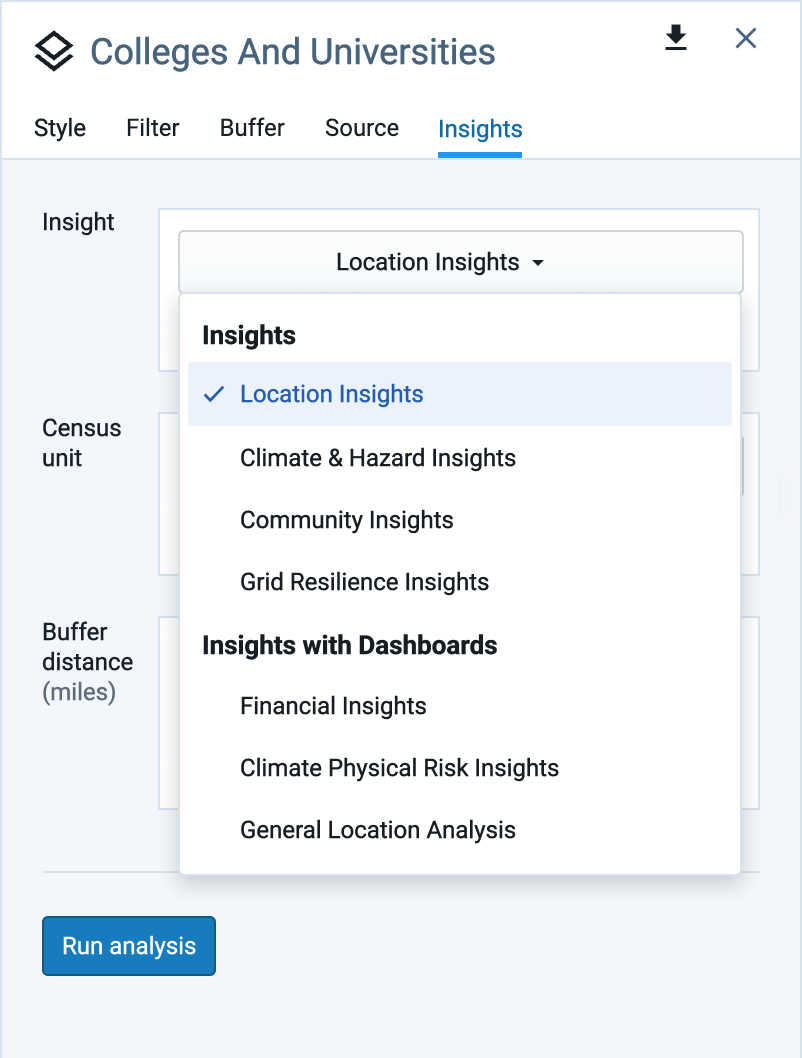
From Insights, select:
Location Insights – provides a holistic perspective containing a cross-section of data from each of the data foundations. It supports points, lines, and polygons.
Climate & Hazard Insights – provides an in-depth view of current and future hazard risks and the land and assets impacted. It supports points, lines, and polygons.
Community Insights – provides an understanding of the area's demographics and socioeconomic characteristics. It supports points, lines, and polygons.
Grid Resilience Insights – (if available to your organization) – provides key metrics about the community, its surrounding environment, and potential hazard impacts for utility service territories. It supports lines.
Choose Census unit and select the census geography.
Enter a Buffer distance between .25 and 25 miles to receive additional contextual details about the area around the locations. Buffers are optional and not available for all insights. The analysis will be faster if left blank.
Click Run analysis.
The analysis starts immediately, and the time it takes to complete varies depending on the size of the project and buffers, but it can take up to several hours. Runs with buffers set to zero are processed more quickly. When finished, the appropriate layers are automatically added to the project, which you can then analyze and visualize.