Existing Conditions Dashboard Overview
The Existing Conditions Dashboard is comprised of a set of tabs containing metrics grouped by topic. From the Summary tab, you can navigate to any of the other tabs to explore the summary statistics, charts, and data tables within each. The Data Table tab contains tables for metrics across all tabs, while the About tab includes reference information.
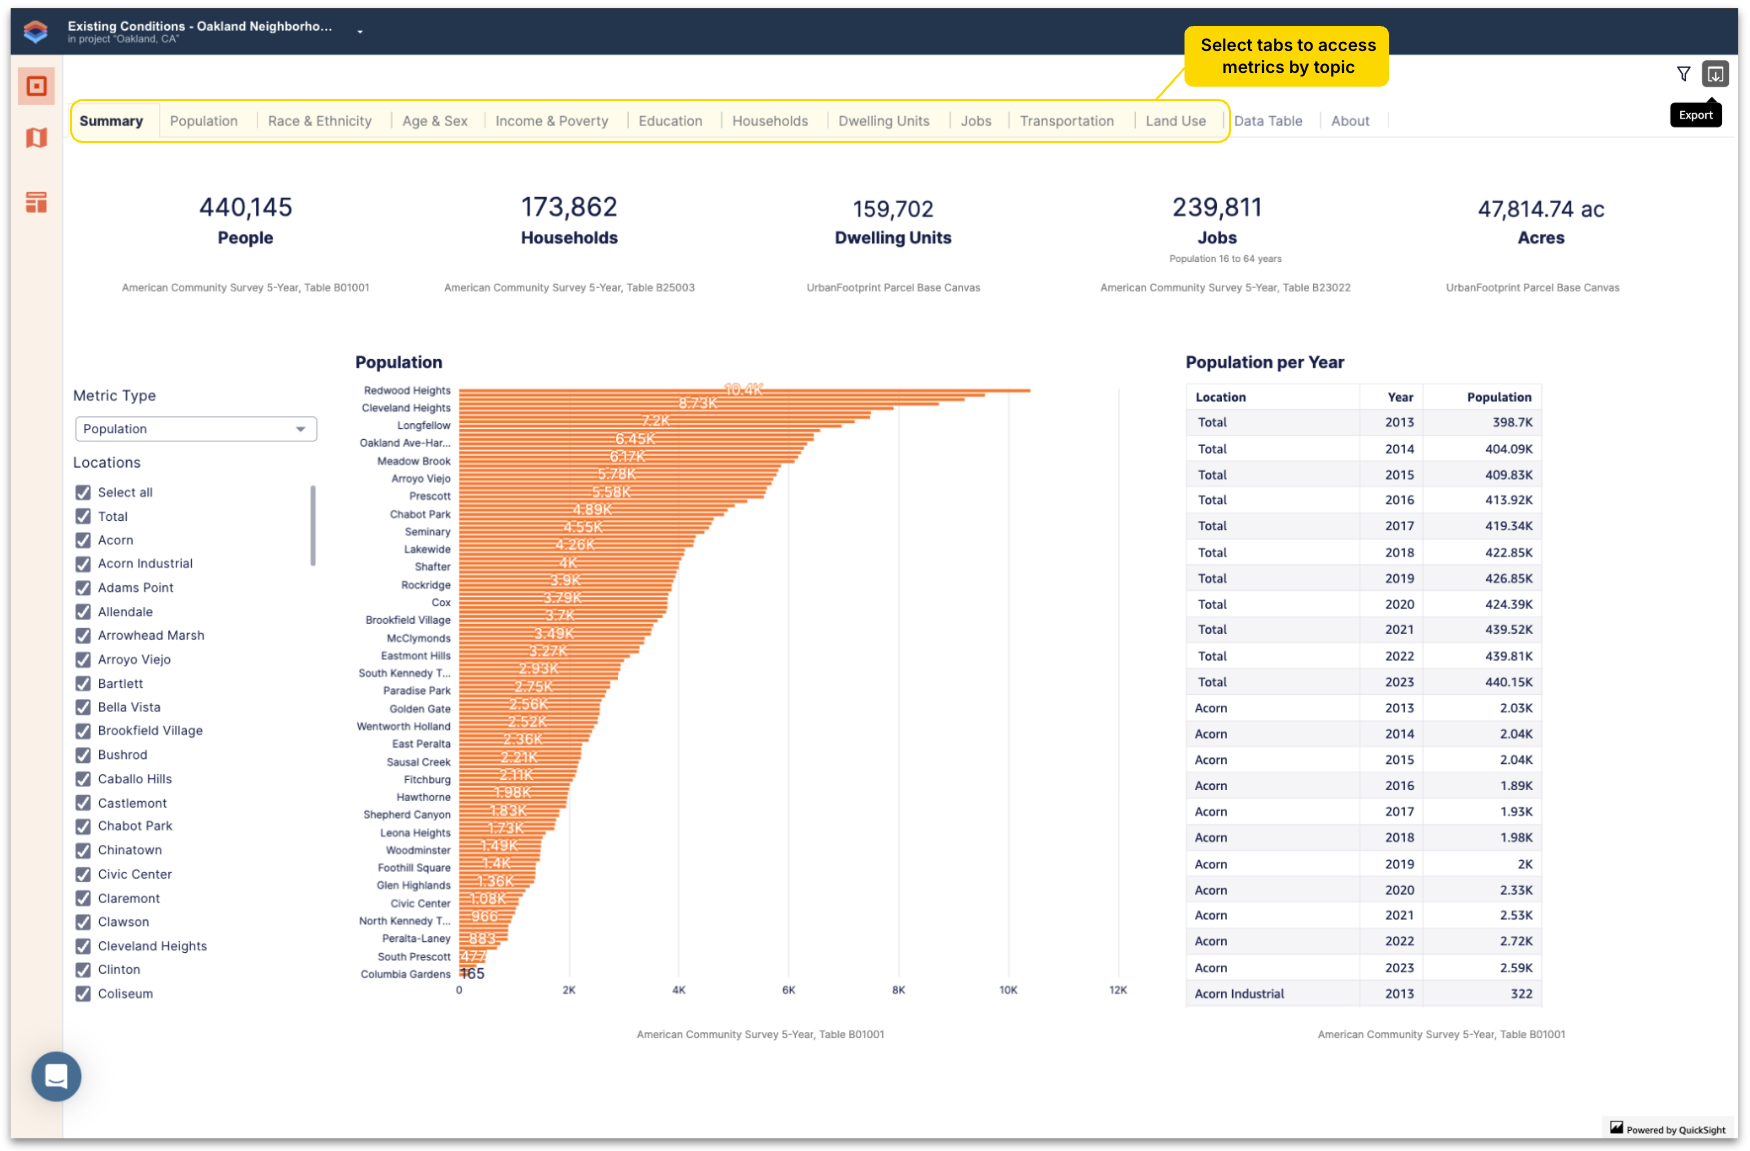 |
The tabs and metrics include:
Summary - Summaries of population, households by tenure (renters or owners), dwelling units by type, jobs by industry, and parcel area by land use summary category (such as Residential, Commercial, and Industrial)
Population - Population by year, population change relative to a selected year (as early as 2013), and population density
Race & Ethnicity - Population by race and ethnicity
Age & Sex - Population by age group and sex
Income & Poverty - Population by poverty level and households by income group
Education - Educational attainment for adults 25 and older
Households - Households by tenure and household sizes
Dwelling Units - Dwelling units by type and decade built
Jobs - Jobs and employed residents by industry, and work status of residents
Transportation - Workers by travel mode and intersection density
Land Use - Parcel area by land use type at two levels of detail (UrbanFootprint's L1 and L3 categories), and building floor area by residential type and commercial sector
Data Table - Sortable, downloadable data tables containing the metrics included across all tabs
About - Information about the dashboard, including the date it was created