Extreme Heat and Precipitation
Climate Scenarios for Extreme Temperature and Precipitation provide current summaries and predictions of future climate conditions based on two levels of greenhouse gas (GHG) emissions: RCP4.5 (low emissions) and RCP8.5 (high emissions). With these metrics, we provide several current and future scenarios available for extreme temperature and precipitation variables, such as the daily average temperature above 90°F and the daily average precipitation of 1" or more.
Example Maps in Analyst
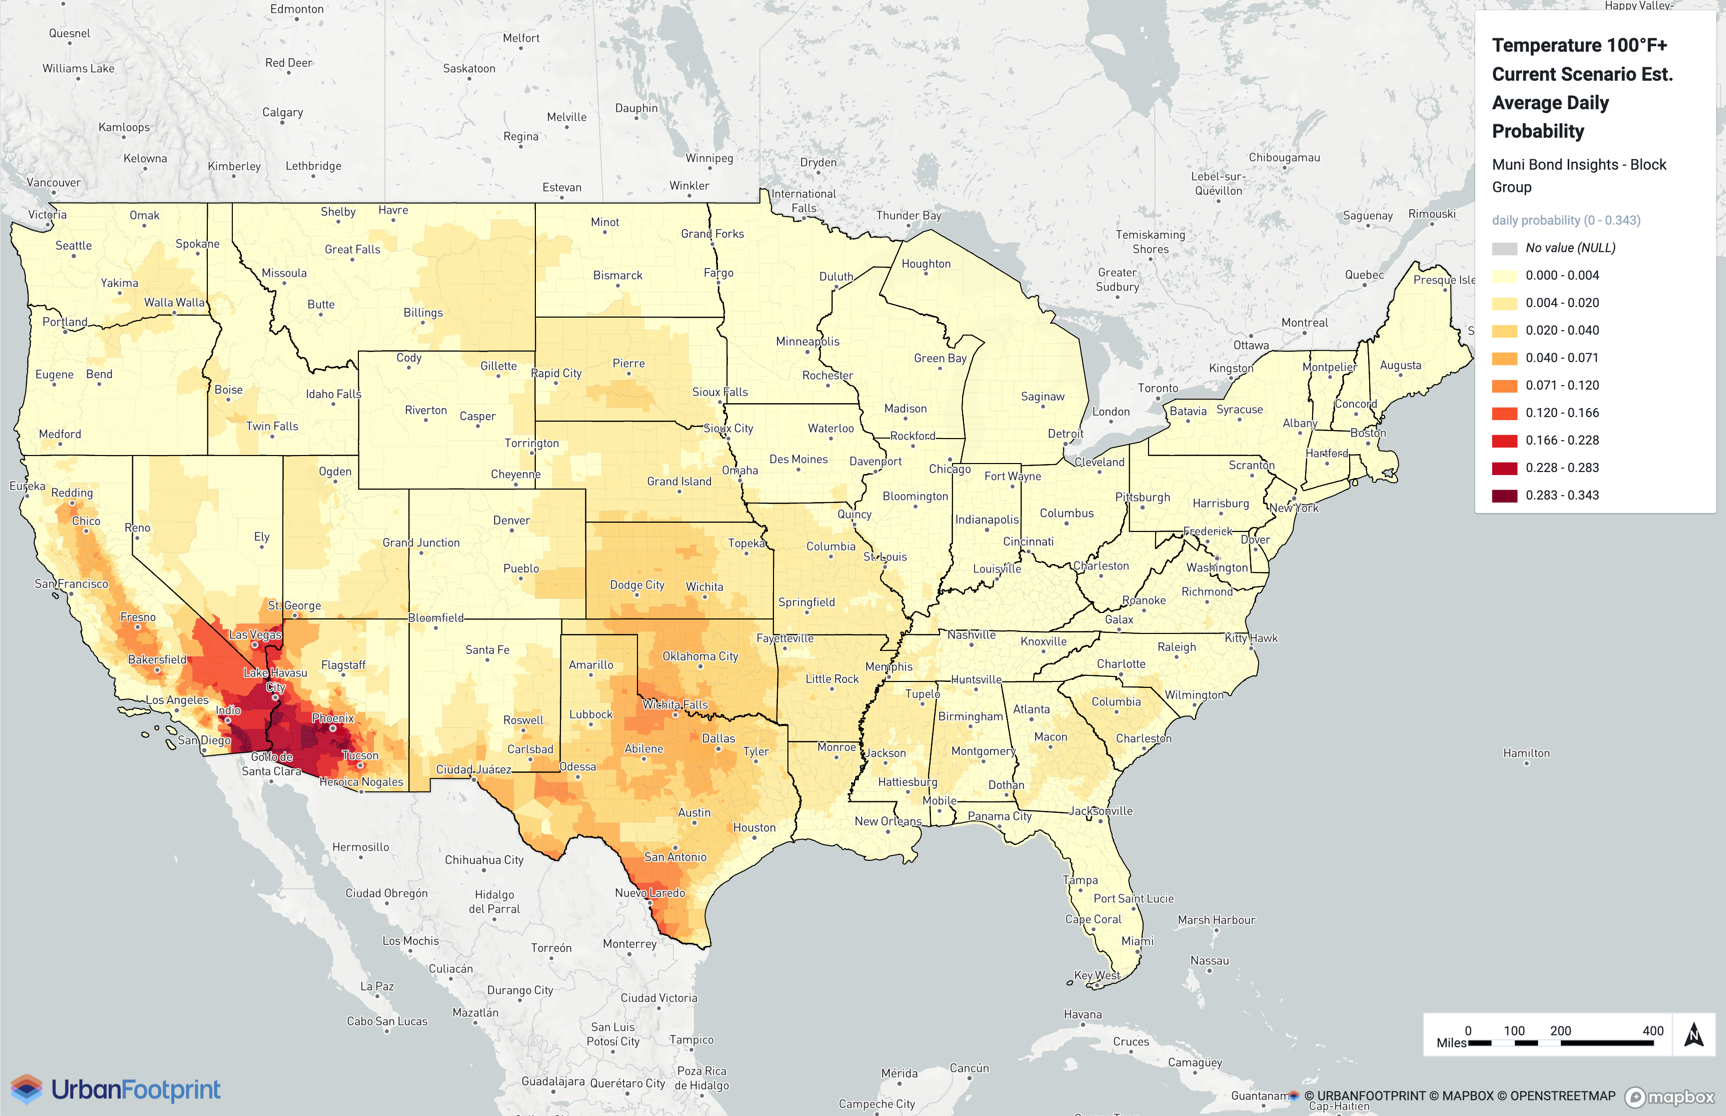
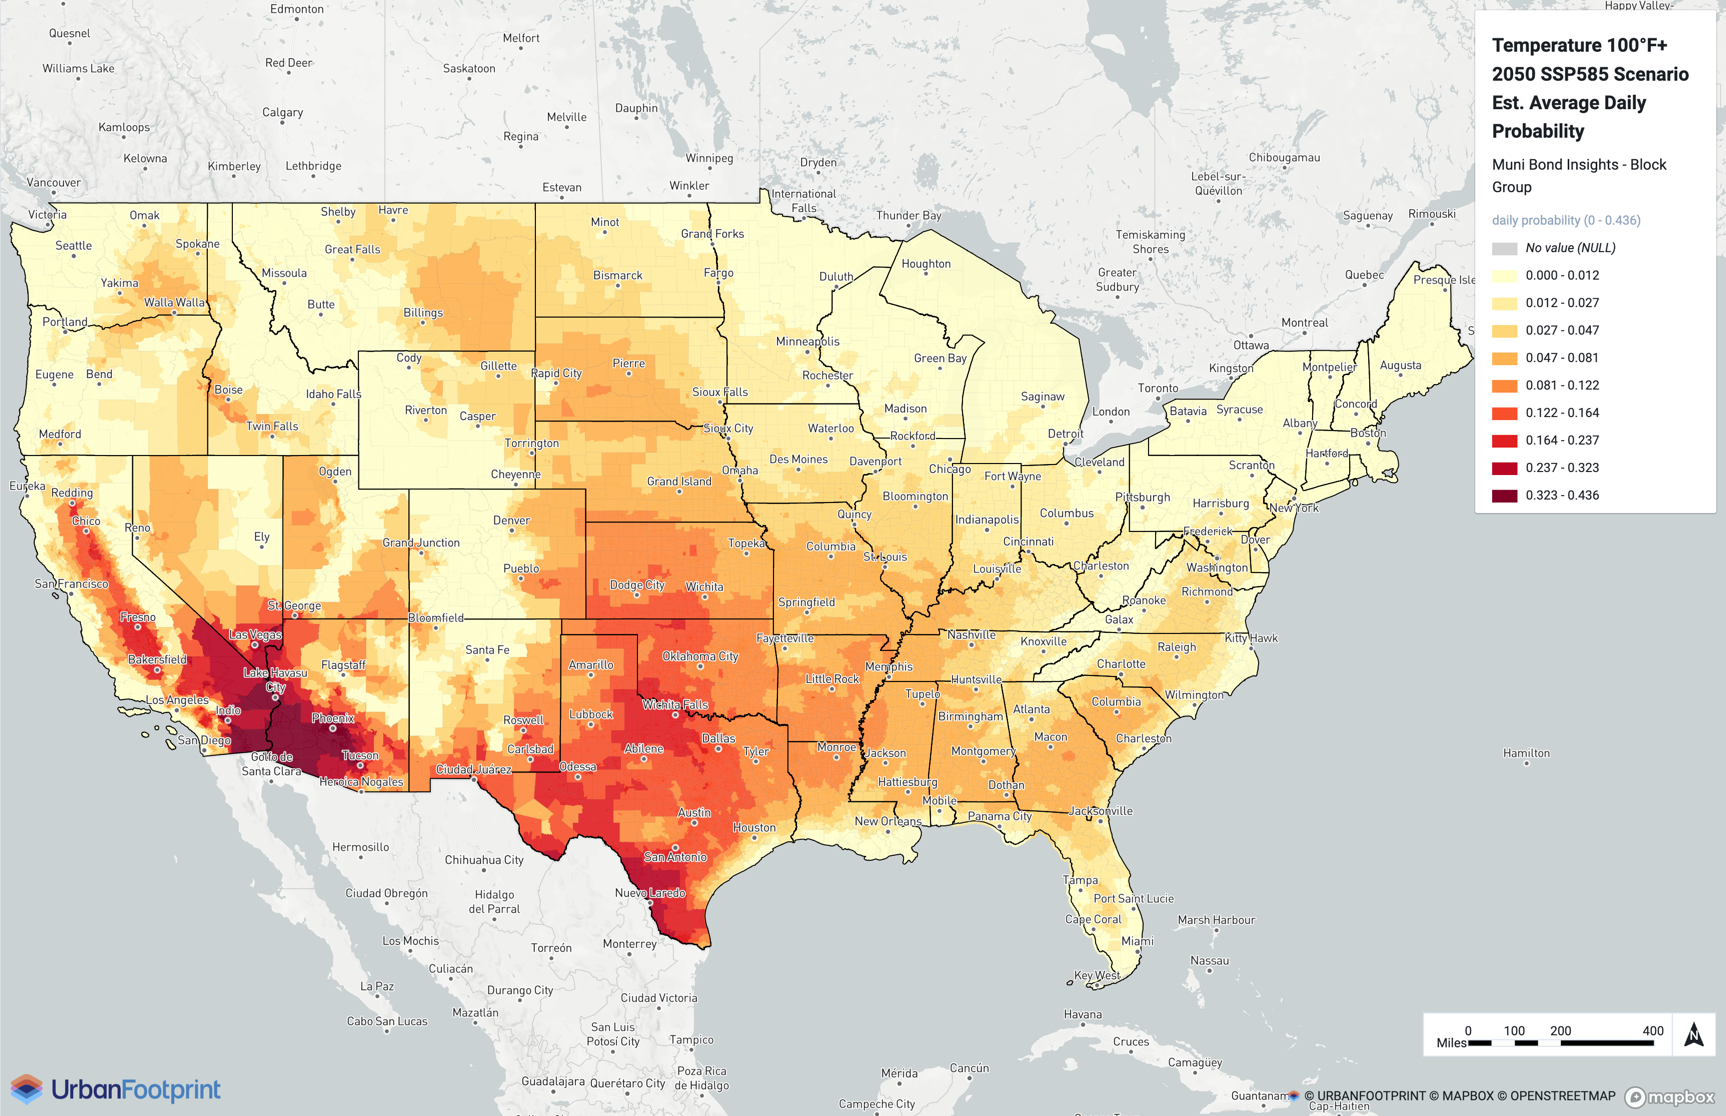
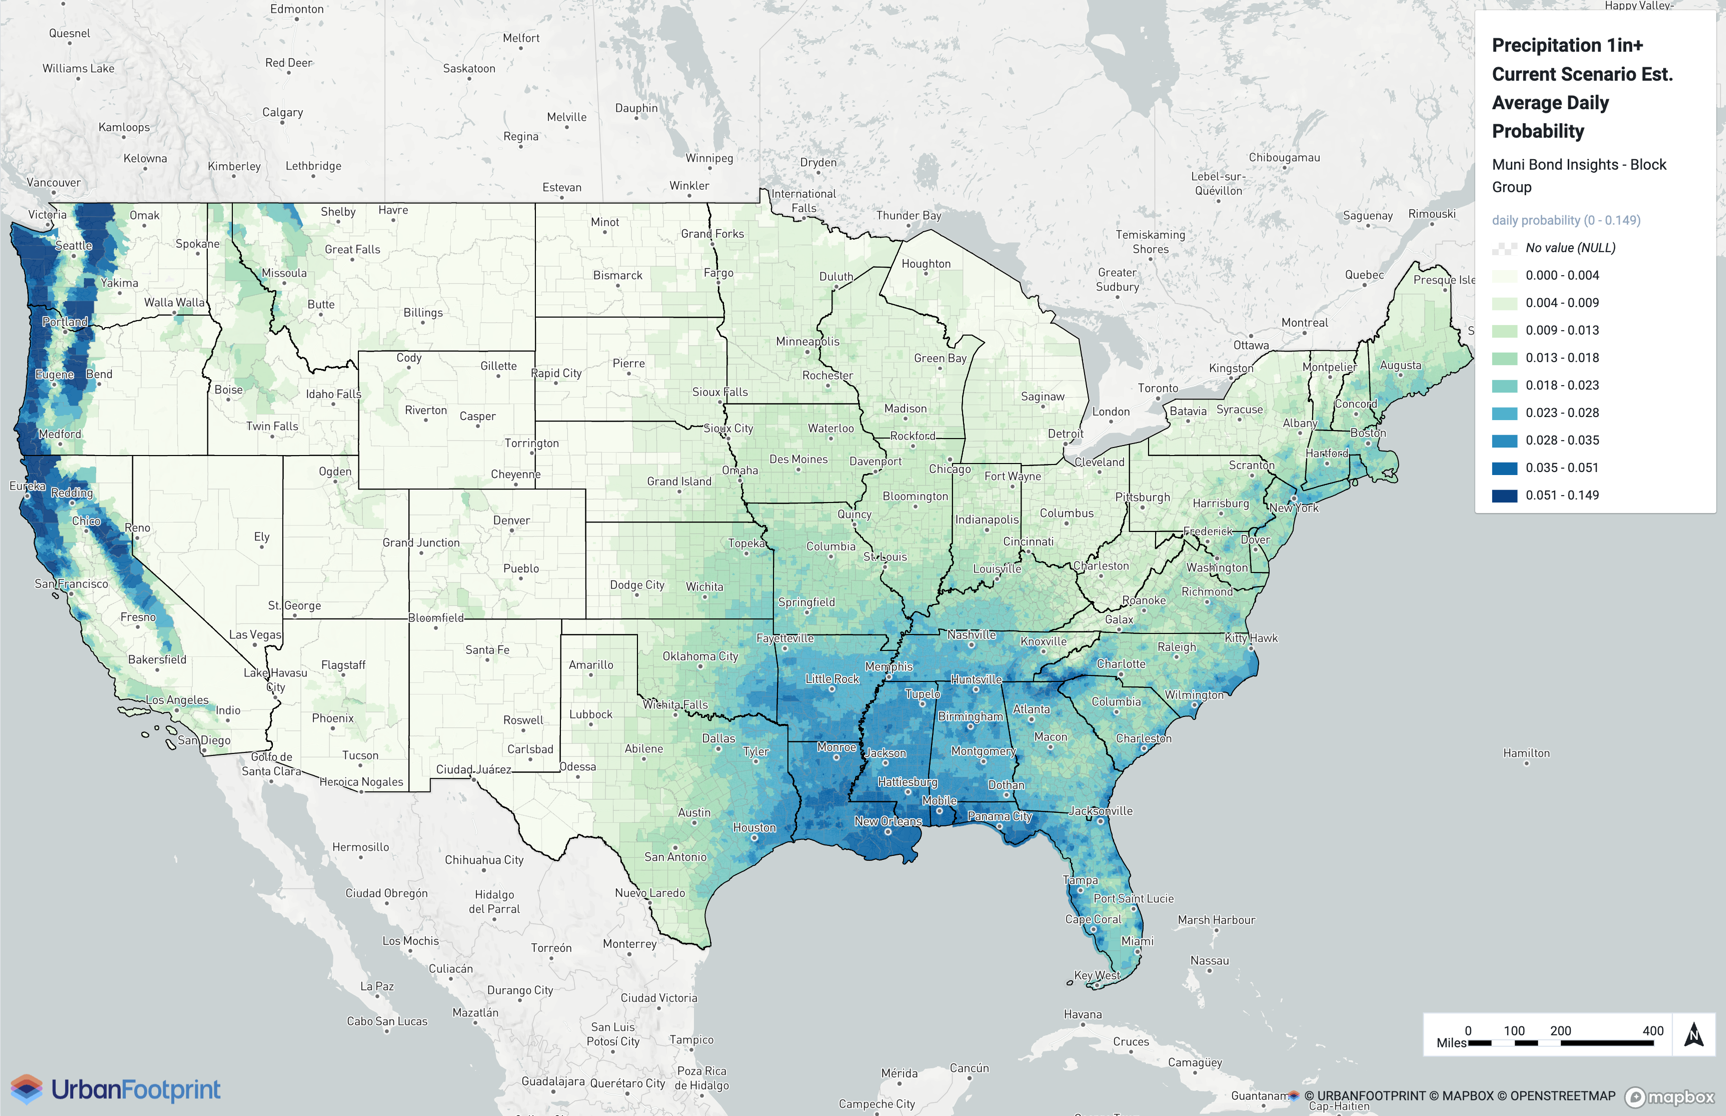
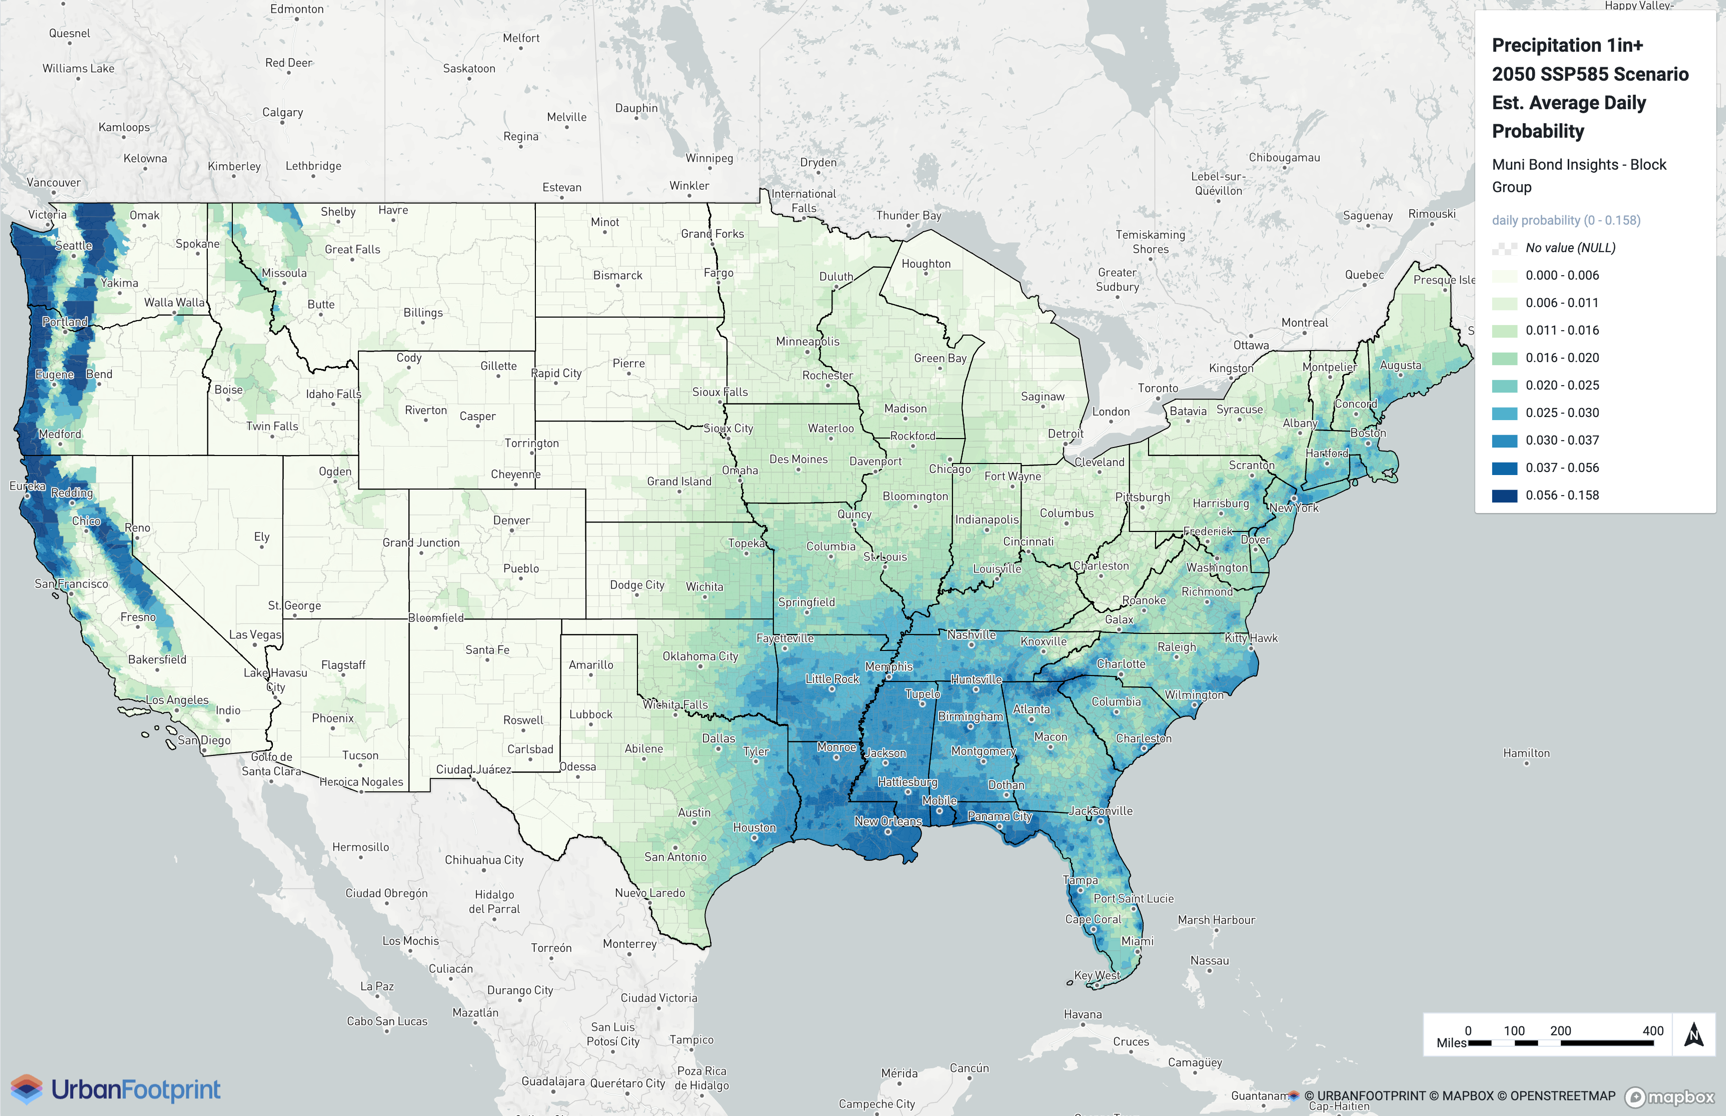
This set of images showcases how you can visualize extreme heat and precipitation in Analyst. In these examples, there are:
an increased probability of daily temperatures 100°F or warmer, with more areas impacted in the future scenario.
an increased probability of daily precipitation of 1 inch or more, with existing areas being impacted more in the future scenario.
Heat

Current scenario
Heat

SSP5-8.5 2050 scenario
Precipitation

Current scenario
Precipitation

SSP5-8.5 2050 scenario