Export Maps to PNG or SVG
The Map Export feature produces maps for use in print and on screen. Maps can be exported to PNG or SVG formats with different capabilities.
Export to a PNG format if you would like to configure map orientation, dimensions, and resolution, and specify all elements needed for a standalone map, including a title, legend, north arrow, scale bar, and logo. By exporting to PNG, you can export full maps that contain these elements.
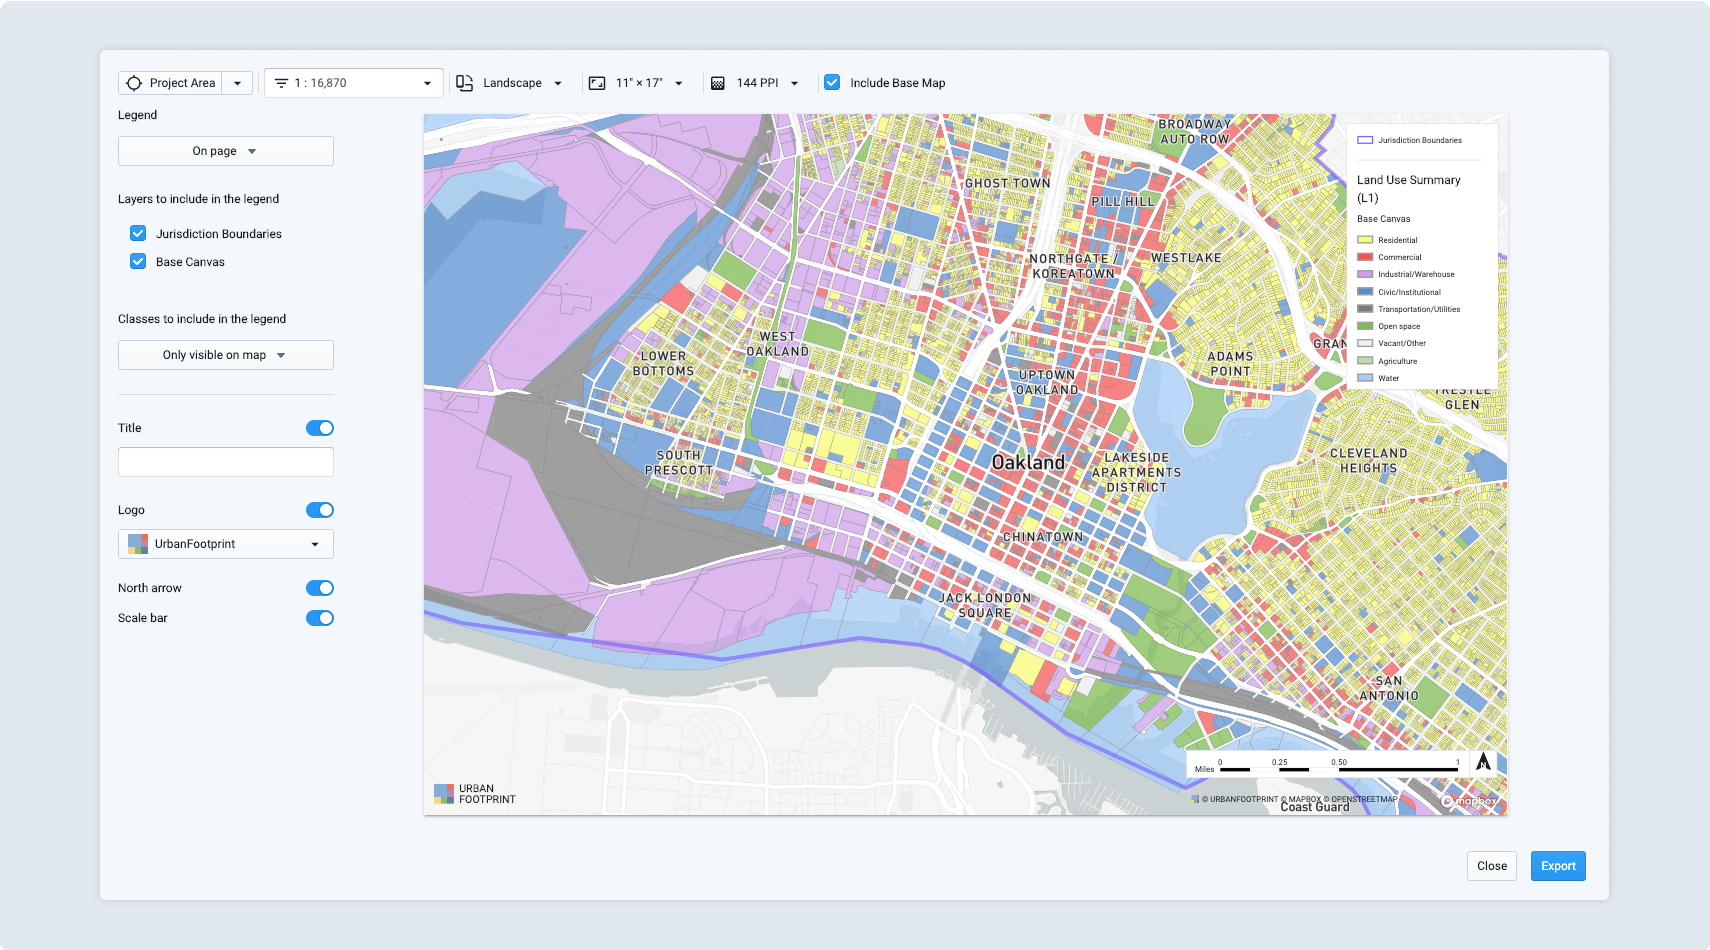 |
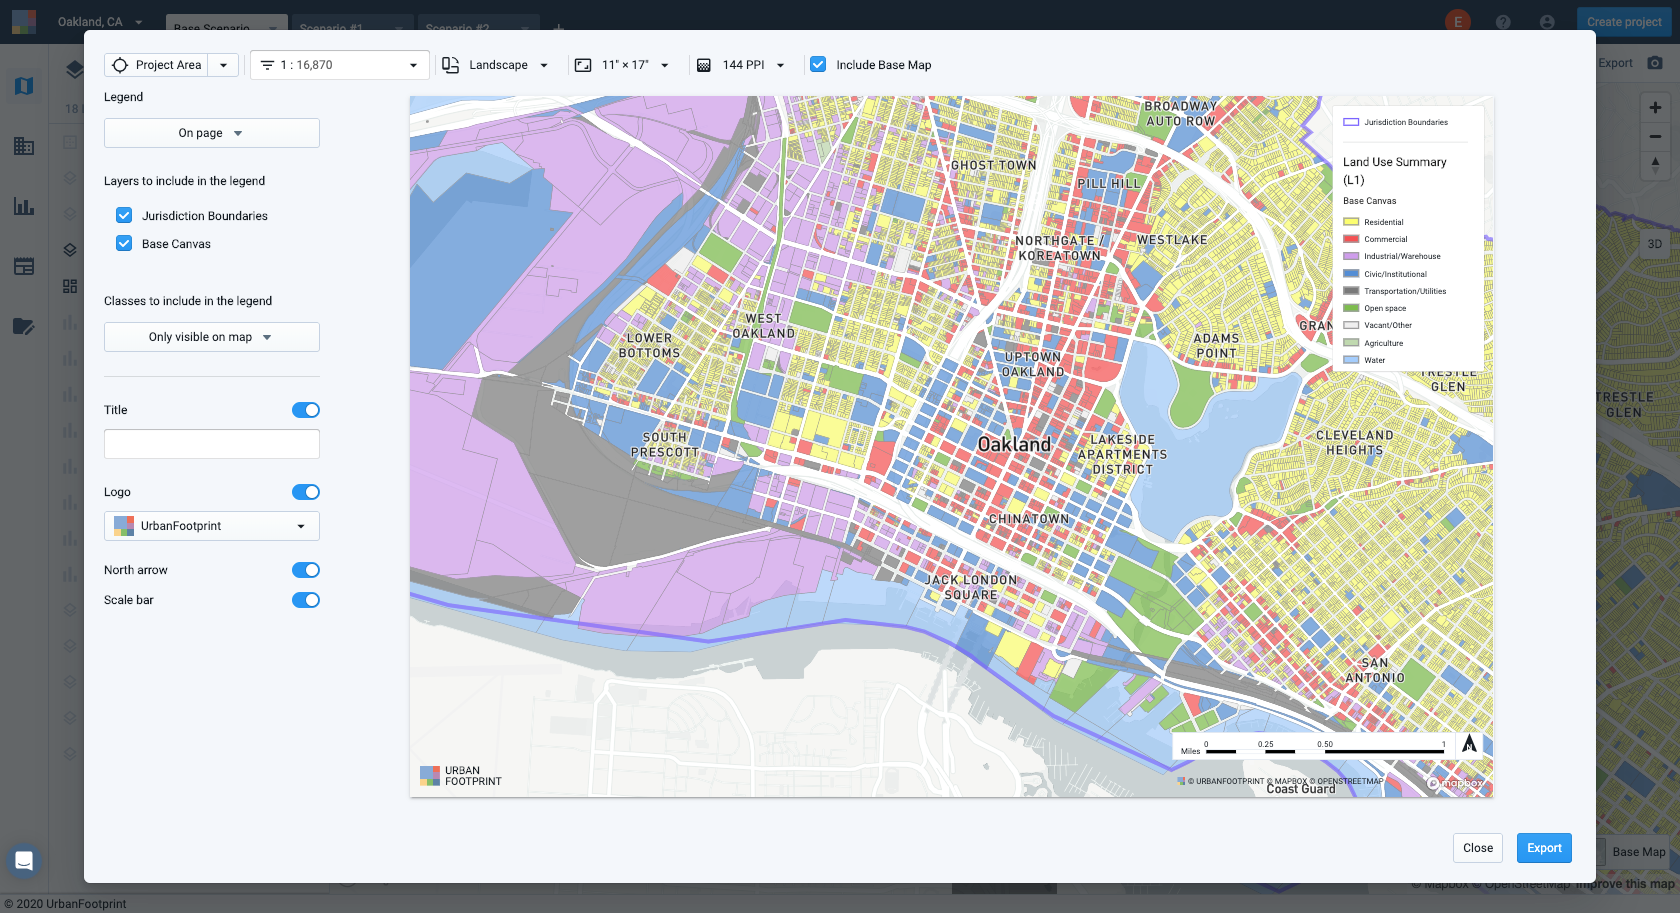
Map Export window
You can also export to a scalable vector graphics (SVG) format for detailed mapmaking in Illustrator or other vector graphics editing programs. A SVG export is a single file that includes all map layers, symbolized and at the same extent as they appear in the map export view. From there, you can style features and add annotations and other map elements to produce map layouts just as you like. And finally, you can export your maps from SVG to PDF format for printing and sharing.
Unlike in PNG exports, you cannot access certain map export options such as base map, legend, title, logo, north arrow, and the scale bar when you export to the SVG format. For more information, see Export a Map to SVG.
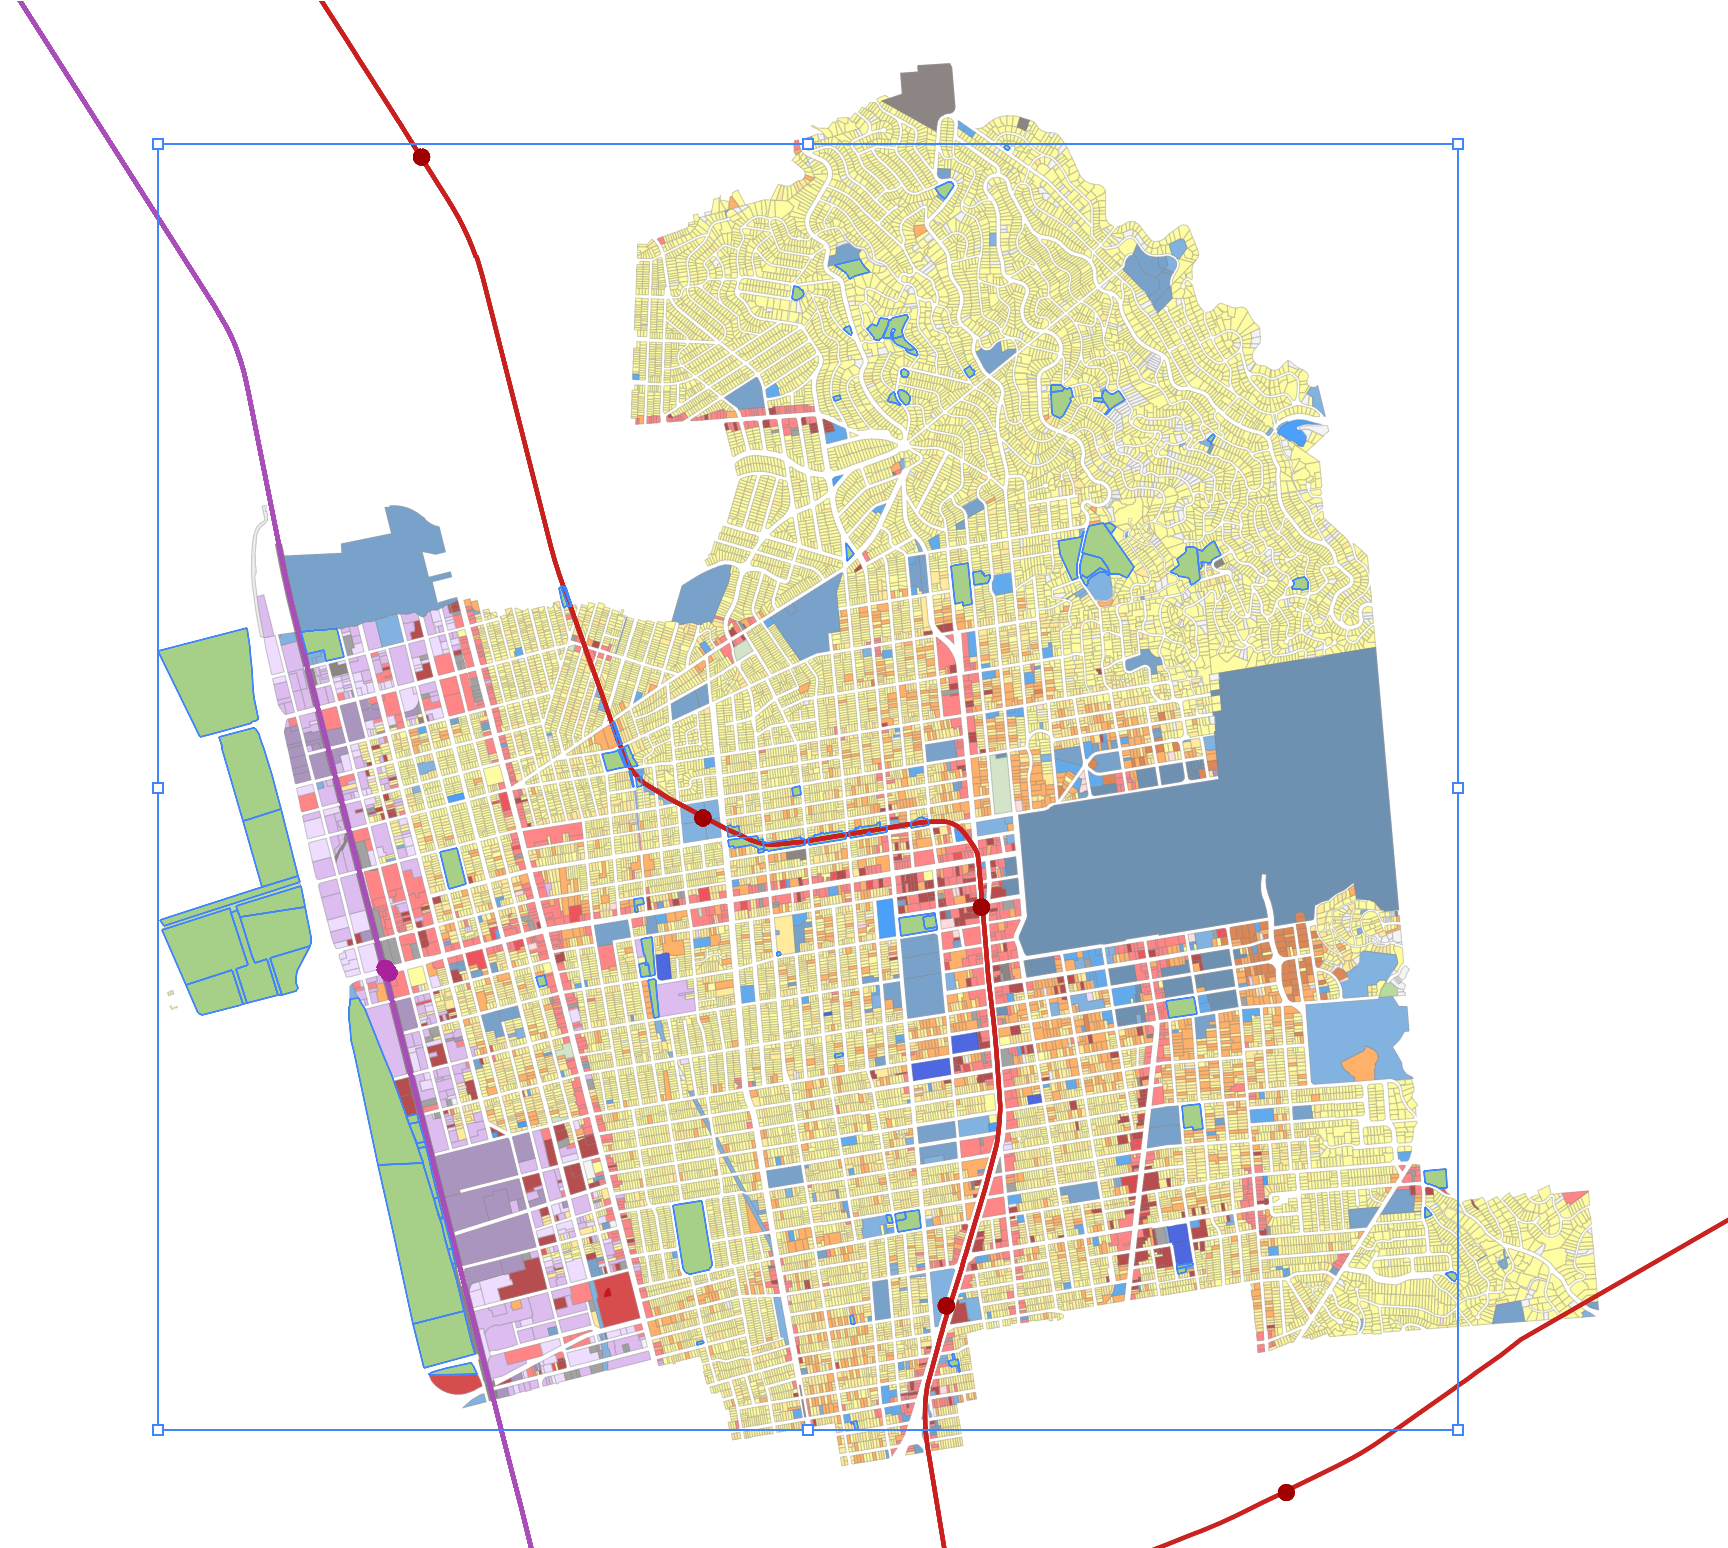 |
SVG files contain layer features as vector objects grouped by class
Note
Map exports use the Web Mercator projection, the same as that used by the user interface. Spatial data exports use the WGS84 projection.
Map export options allow you to specify different options depending on the format you're using. SVG and PNG share several options, and PNG includes some additional ones.
SVG and PNG Options
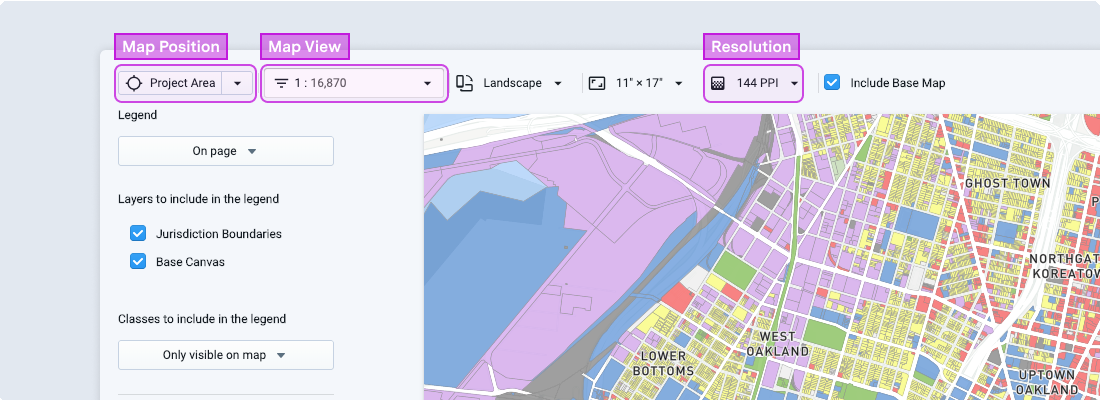
These options are available for SVG and PNG formats: map orientation, map size, resolution, map view, and map position.
Map Orientation
Orientation options include Portrait (vertically oriented) and Landscape (horizontally oriented).
 |
Map orientation options
Map Size
Print size options include 8.5" x 11" (Letter) and 11" x 17" (Tabloid). Display image sizes include 900px x 1,600px and 600px x 800px.
 |
Map size options
Resolution
Maps can be exported at print or screen resolution. Print resolution is 300 PPI. Options for screen resolution include 144 PPI and 72 PPI. Resolution is enabled in PNG or SVG formats.
Note
To create maps at larger sizes and higher resolutions, you have the option of exporting maps to scalable vector graphics (SVG) format for use in Illustrator or other graphics programs. See Export a Map to SVG for details.
You can also export individual layers to SVG format. See Export Layer Data for more information
Map View
The map area will be determined by your orientation and print or screen size selections. To fine-tune your map view, you can pan and zoom manually using your mouse. You can also enter a custom map scale.
 |
Map position and scale options
Map Position
Saving your view as a map position is recommended. Saving a map position from the Map Export window enables you to recreate maps for the same view. Recalling the same view requires that you use the same map size and resolution settings used when the map position was created. Due to variations in map dimensions and scales, map positions created via the main interface may not yield consistent results for map exports.
Expand the Map Position menu and select Save current position to save. Enter a name and set the scale, if desired. Click Ok to save.
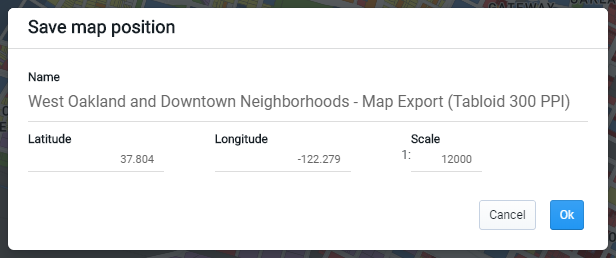 |
Specifying a map position
To return to your map view in the future, select it from the menu. Ensure that your map size and resolution options correspond to the original position.
PNG Options
If you export as PNG, you have these additional options: map legend, map title, logo, north arrow, scale bar, and base map.
Map Legend
You can include a legend on the map page (which uses the Roboto font), as a separate file, or not include one at all. If you choose to include the legend as a separate file, your map export will consist of a zip file containing separate PNG files for the map and legend.
Layers to include in the legend – Use the checkbox controls to turn legend entries for layers on or off. Entries appear in the same order as the layers in the map. By default, all layers that are set to be visible in the Layers list are included and turned on. De-selecting layers will remove their entries from the legend, but they will still appear on your map.
Note that every time you open the Map Export window, the layer selection will be reset to match the visibility settings indicated in the Layers list.
Selection of layers to include in the legend
Classes to include in the legend – This option applies to all layers with categorical classes. Selecting All classes includes the full list of classes whether or not they appear on the map. Selecting Only visible on map allows you to have a more compact, representative legend. The default setting is to include only visible classes. For layers with numeric classes, all classes must be shown.
Selection of layer classes to include in legend
Map Title
The map title appears in the upper left corner of your map. Including a title is optional, and it uses the Roboto font.
 |
Map title entry
Logo
You can select from the available logos or upload a new logo. To upload, select Upload a new logo from the Logo menu. Then, drag an image file to the window as indicated, or click to choose a file using your file explorer. Any image you upload will be available for all members of your organization, in all projects.
The logo appears at the lower left corner of the map.
North Arrow
The north arrow appears in the lower right corner of the map.
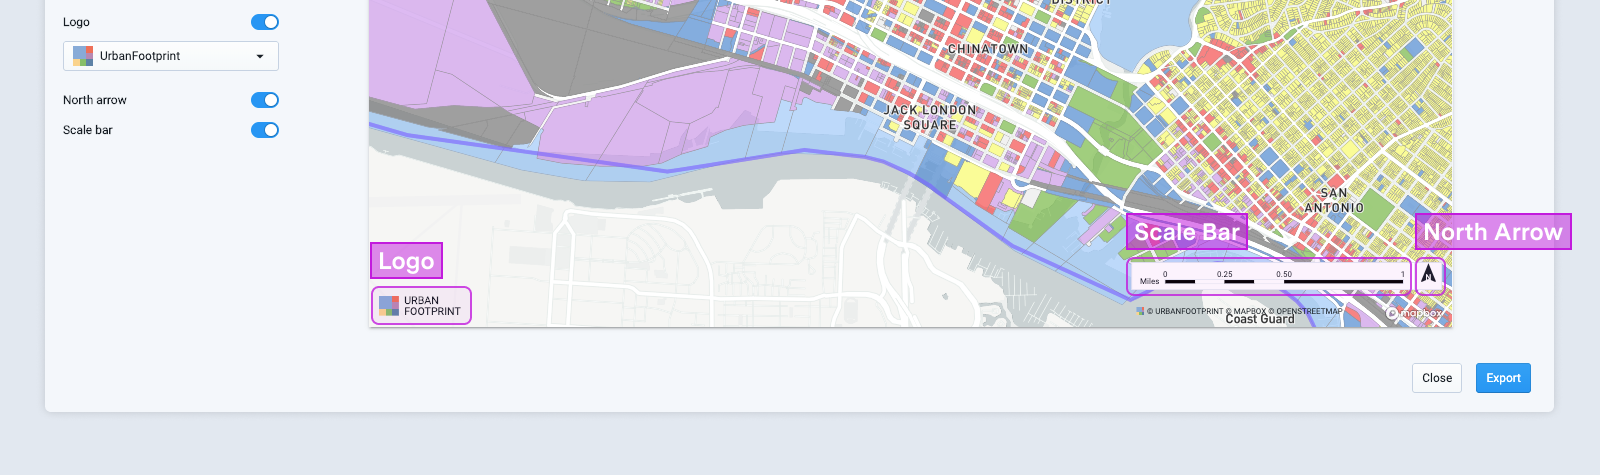 |
Logo, scale bar, and north arrow
Scale Bar
The scale bar appears in the lower right corner of the map, next to the north arrow (if included). The distance is expressed in feet or miles, depending on the map scale.
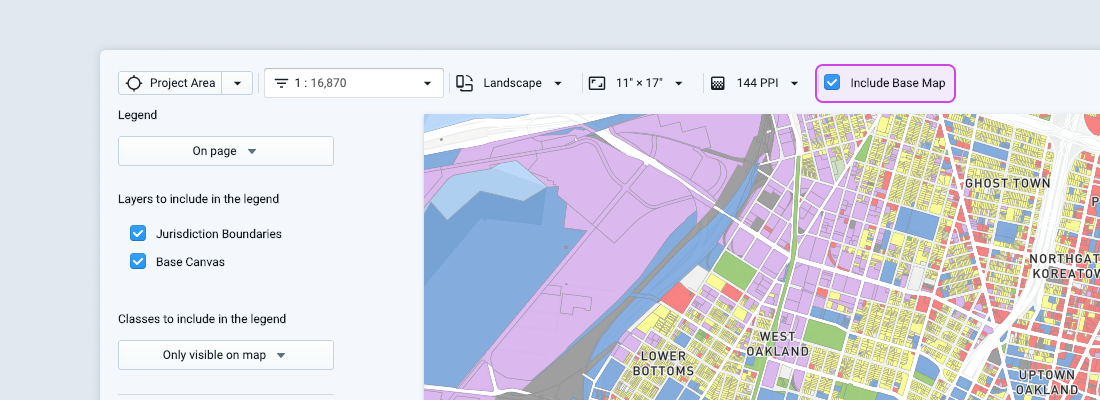
Base Map
You can choose to include or exclude the base map in your map export using the checkbox control.
 |
Base map option
Style your map as desired. You'll have the opportunity to adjust the map layout view later.
Click the Export button
 above the map's top right corner. The Export button is accessible from Explore, Build, or Analyze modes.
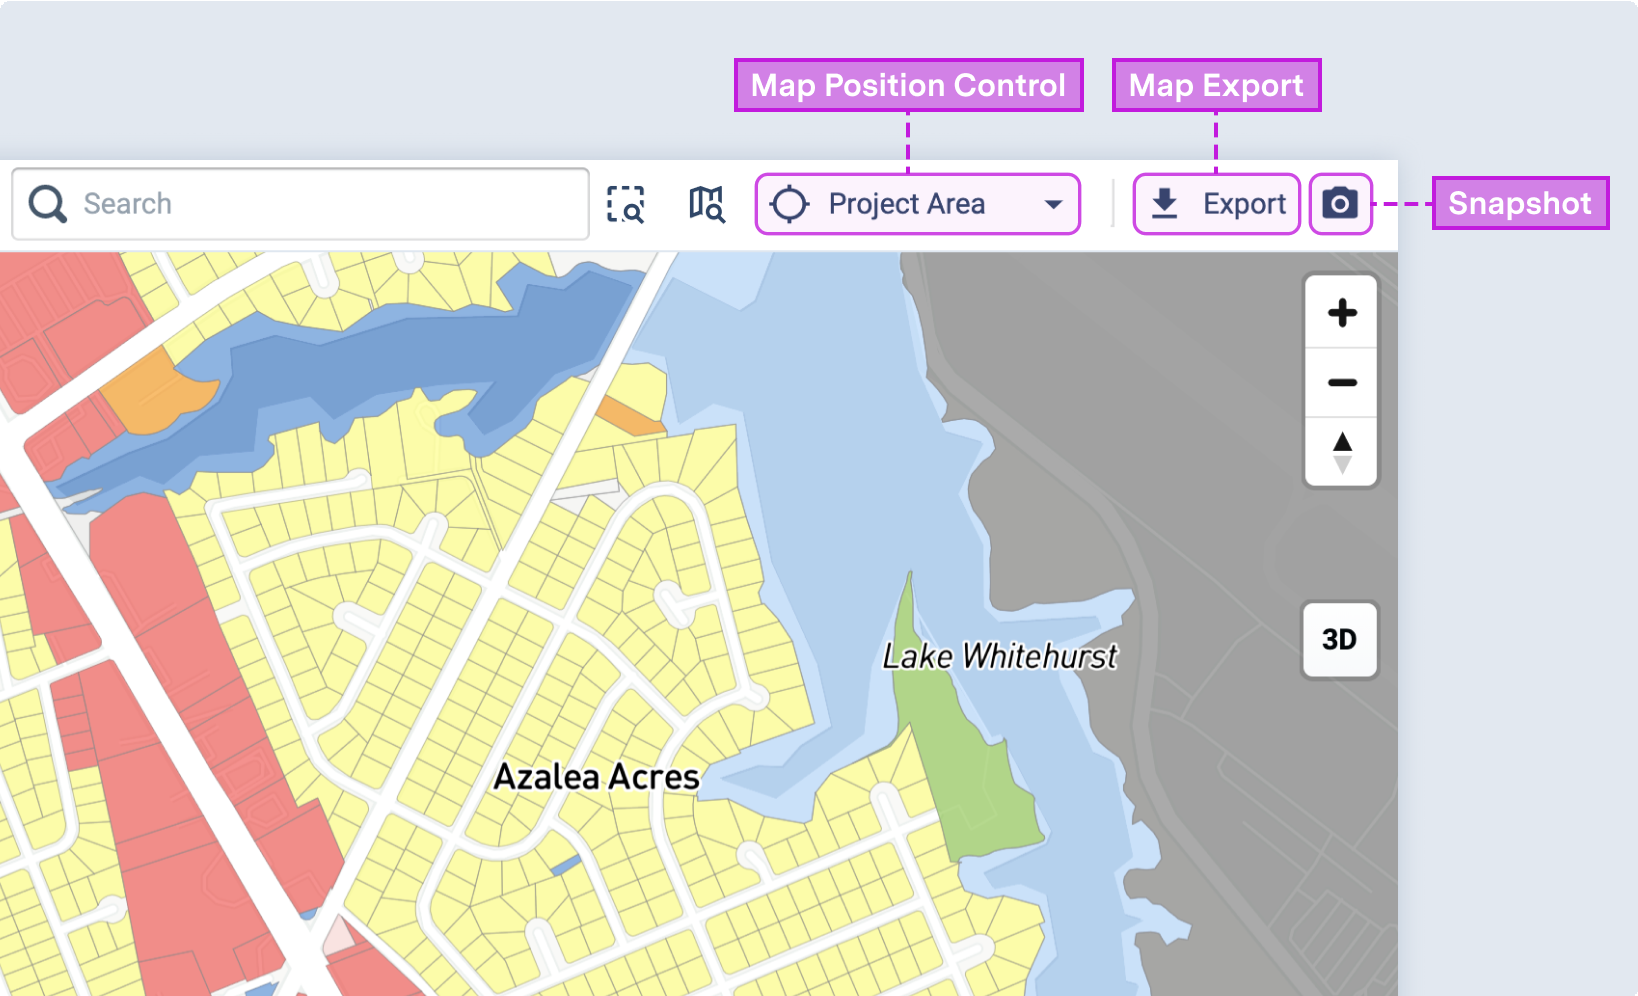
Map snapshot, export, and position controls
Note
The Export button may not appear on smaller screens when expanding the Layer Details pane. To access the button, try collapsing the Layer Details pane or reducing the zoom level of your browser's display.
The Map Export window appears.
Map Export window
Set your map orientation, size, and resolution.
Pan, zoom, and set a map scale to adjust your map view.
Save your map position.
Specify settings for a map legend. You can select the layers to include, as well as categorical classes according to their visibility on the map.
Include a map title if desired.
Include a logo, if desired. If needed, you can upload a custom logo.
Include a north arrow and scale bar, if desired.
Select whether to include the base map or not. The base map is included by default, but you can turn it off.
Select the PNG export option at the top left corner of the window.
Click Export to export your map. Exporting your map will take time, depending on its scope. When complete, you will be notified to download your map.
Click Download in the notification bar. A PNG file for your map or a zip file containing PNG files for your map and legend will be downloaded to your computer.
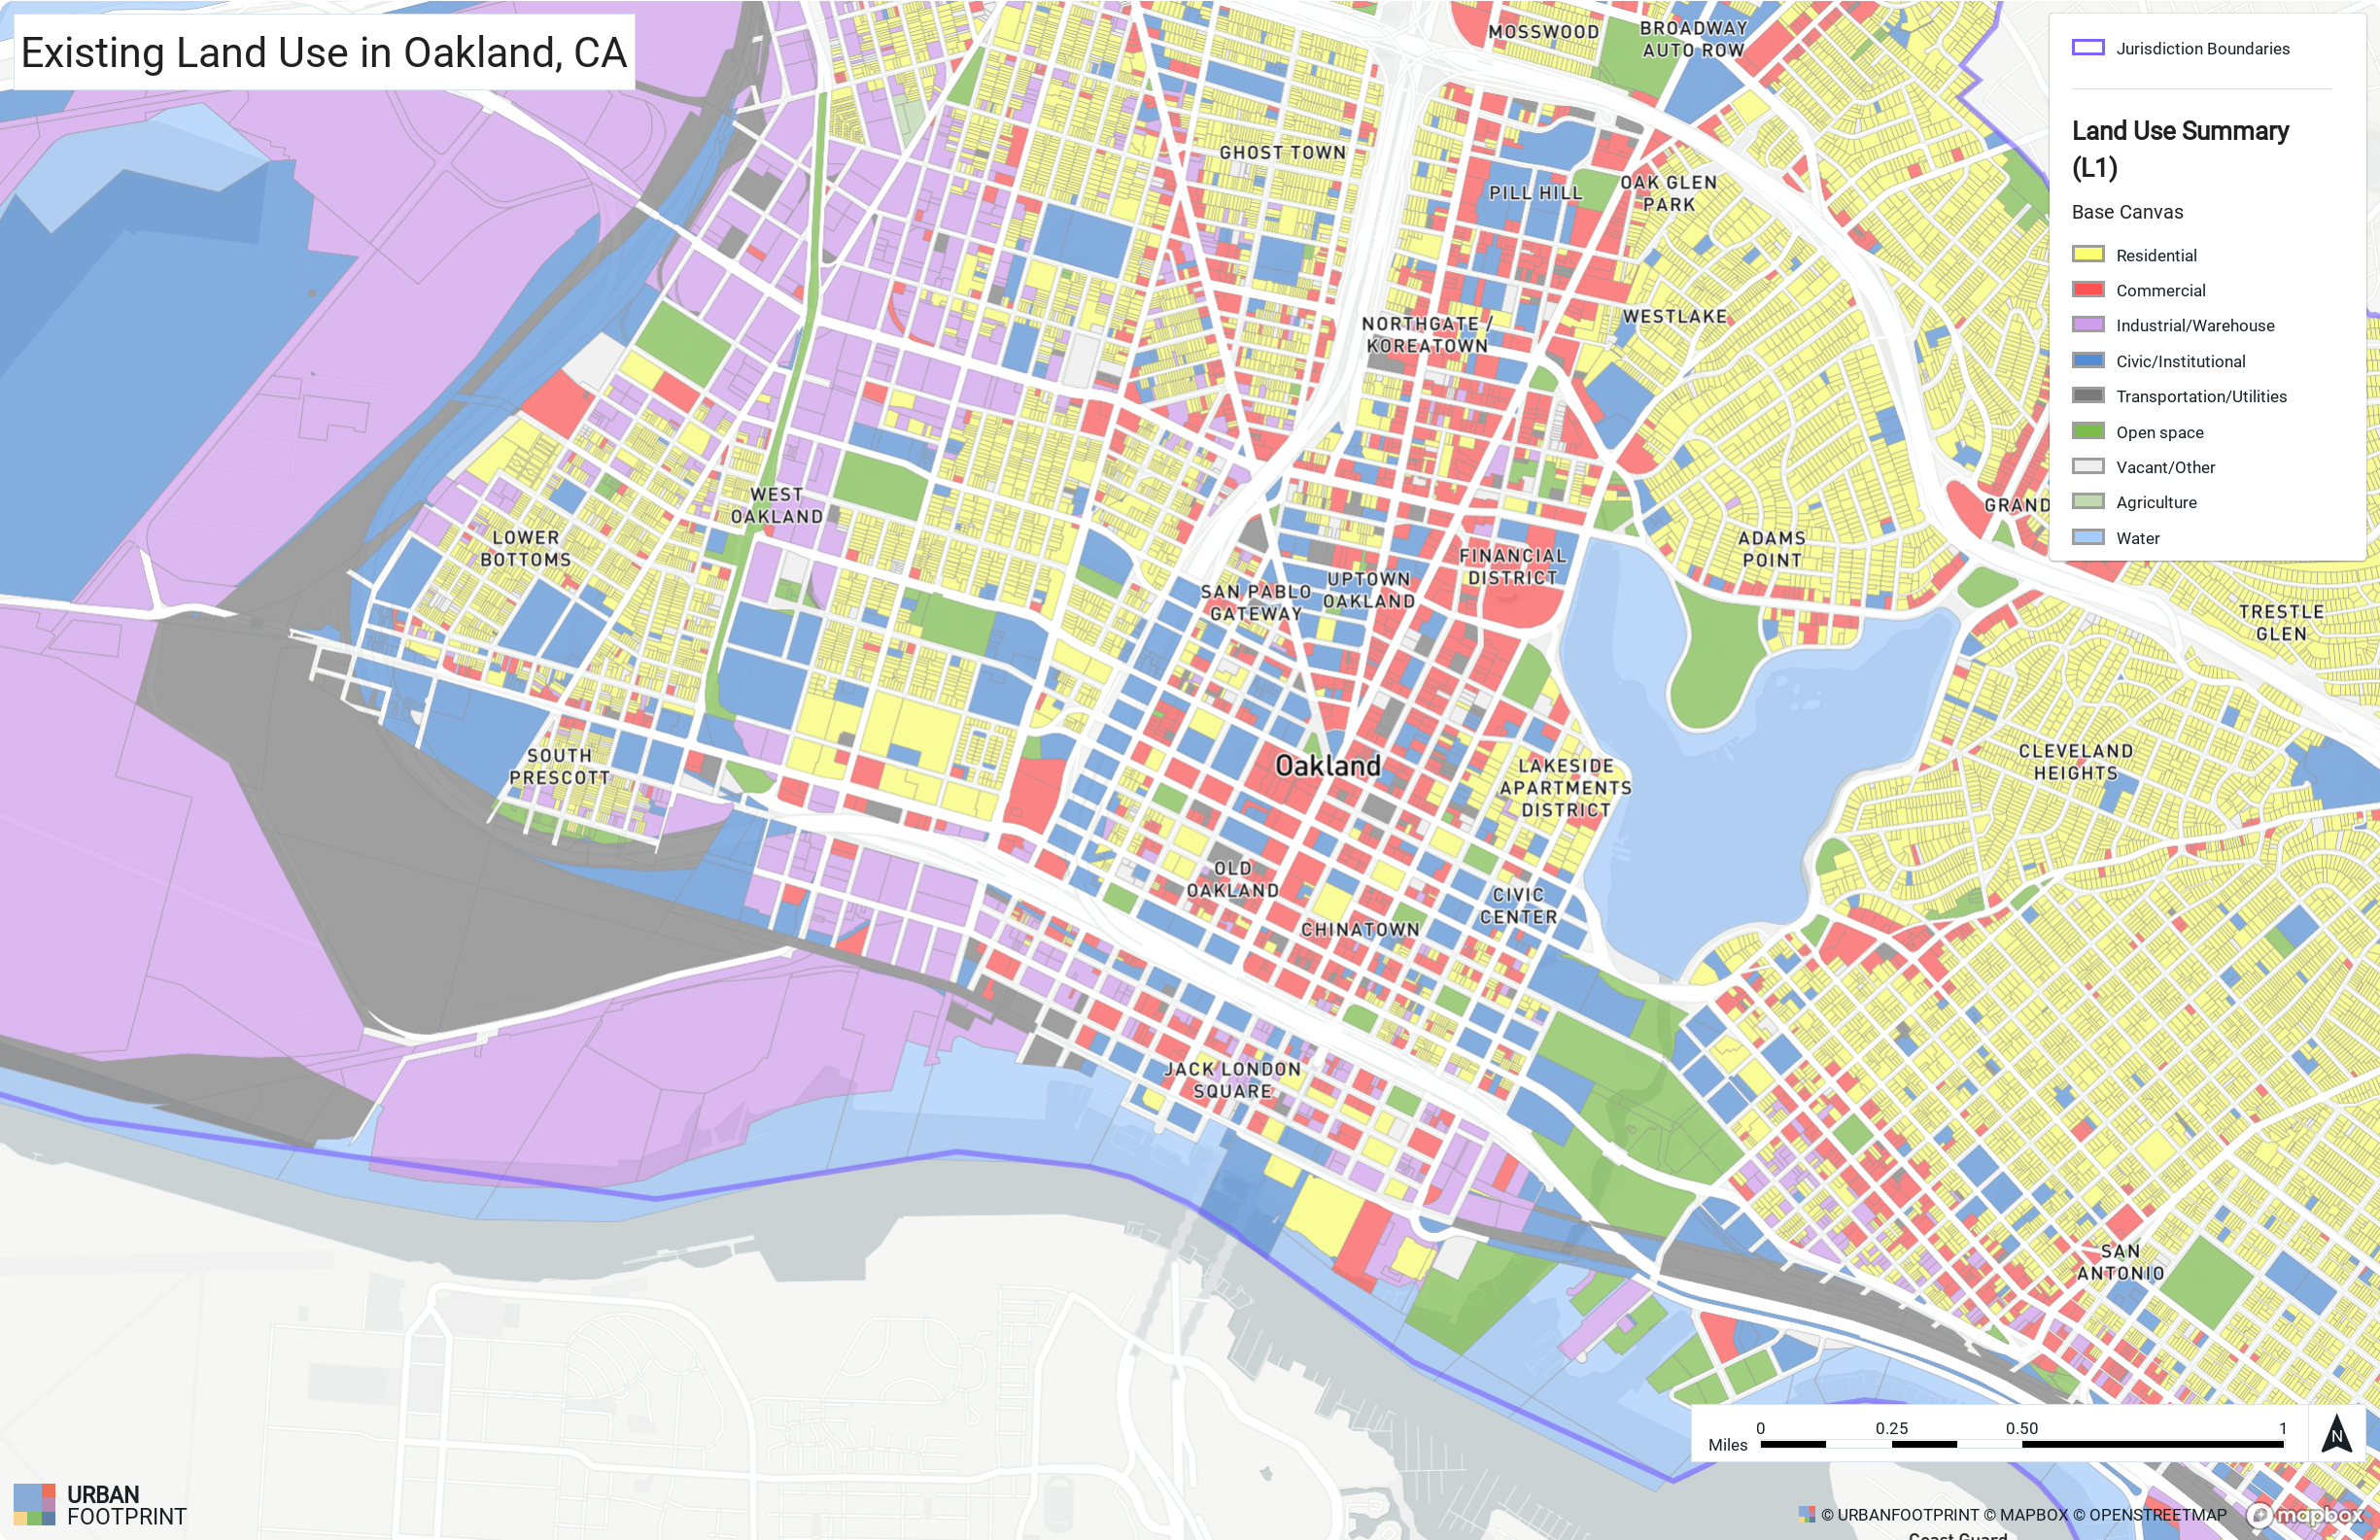 |
Exported map with a title, legend, logo, scale bar, and north arrow
Style your map as desired. To support graphics handling in Illustrator and other programs, SVG exports include vector features grouped by layer and class. Analyst uses the currently mapped column (the column selected in the Style tab) as the basis for grouping features. The data classes are maintained as specified, as are fill and stroke styling.
Layer features that appear in the map are cropped to the rectangular extent shown in the map layout view. You'll have the opportunity to fine-tune the map layout view later.
Click the Export button
that appears above the top right corner of the map. The Export button is accessible from Explore, Build, or Analyze modes. Map export, snapshot, and position controls
Note
The Export button may not appear on smaller screens when the Layer Details pane is expanded. To access the button, try collapsing the Layer Details pane and/or reducing the zoom level of your browser's display.
The Map Export window appears.
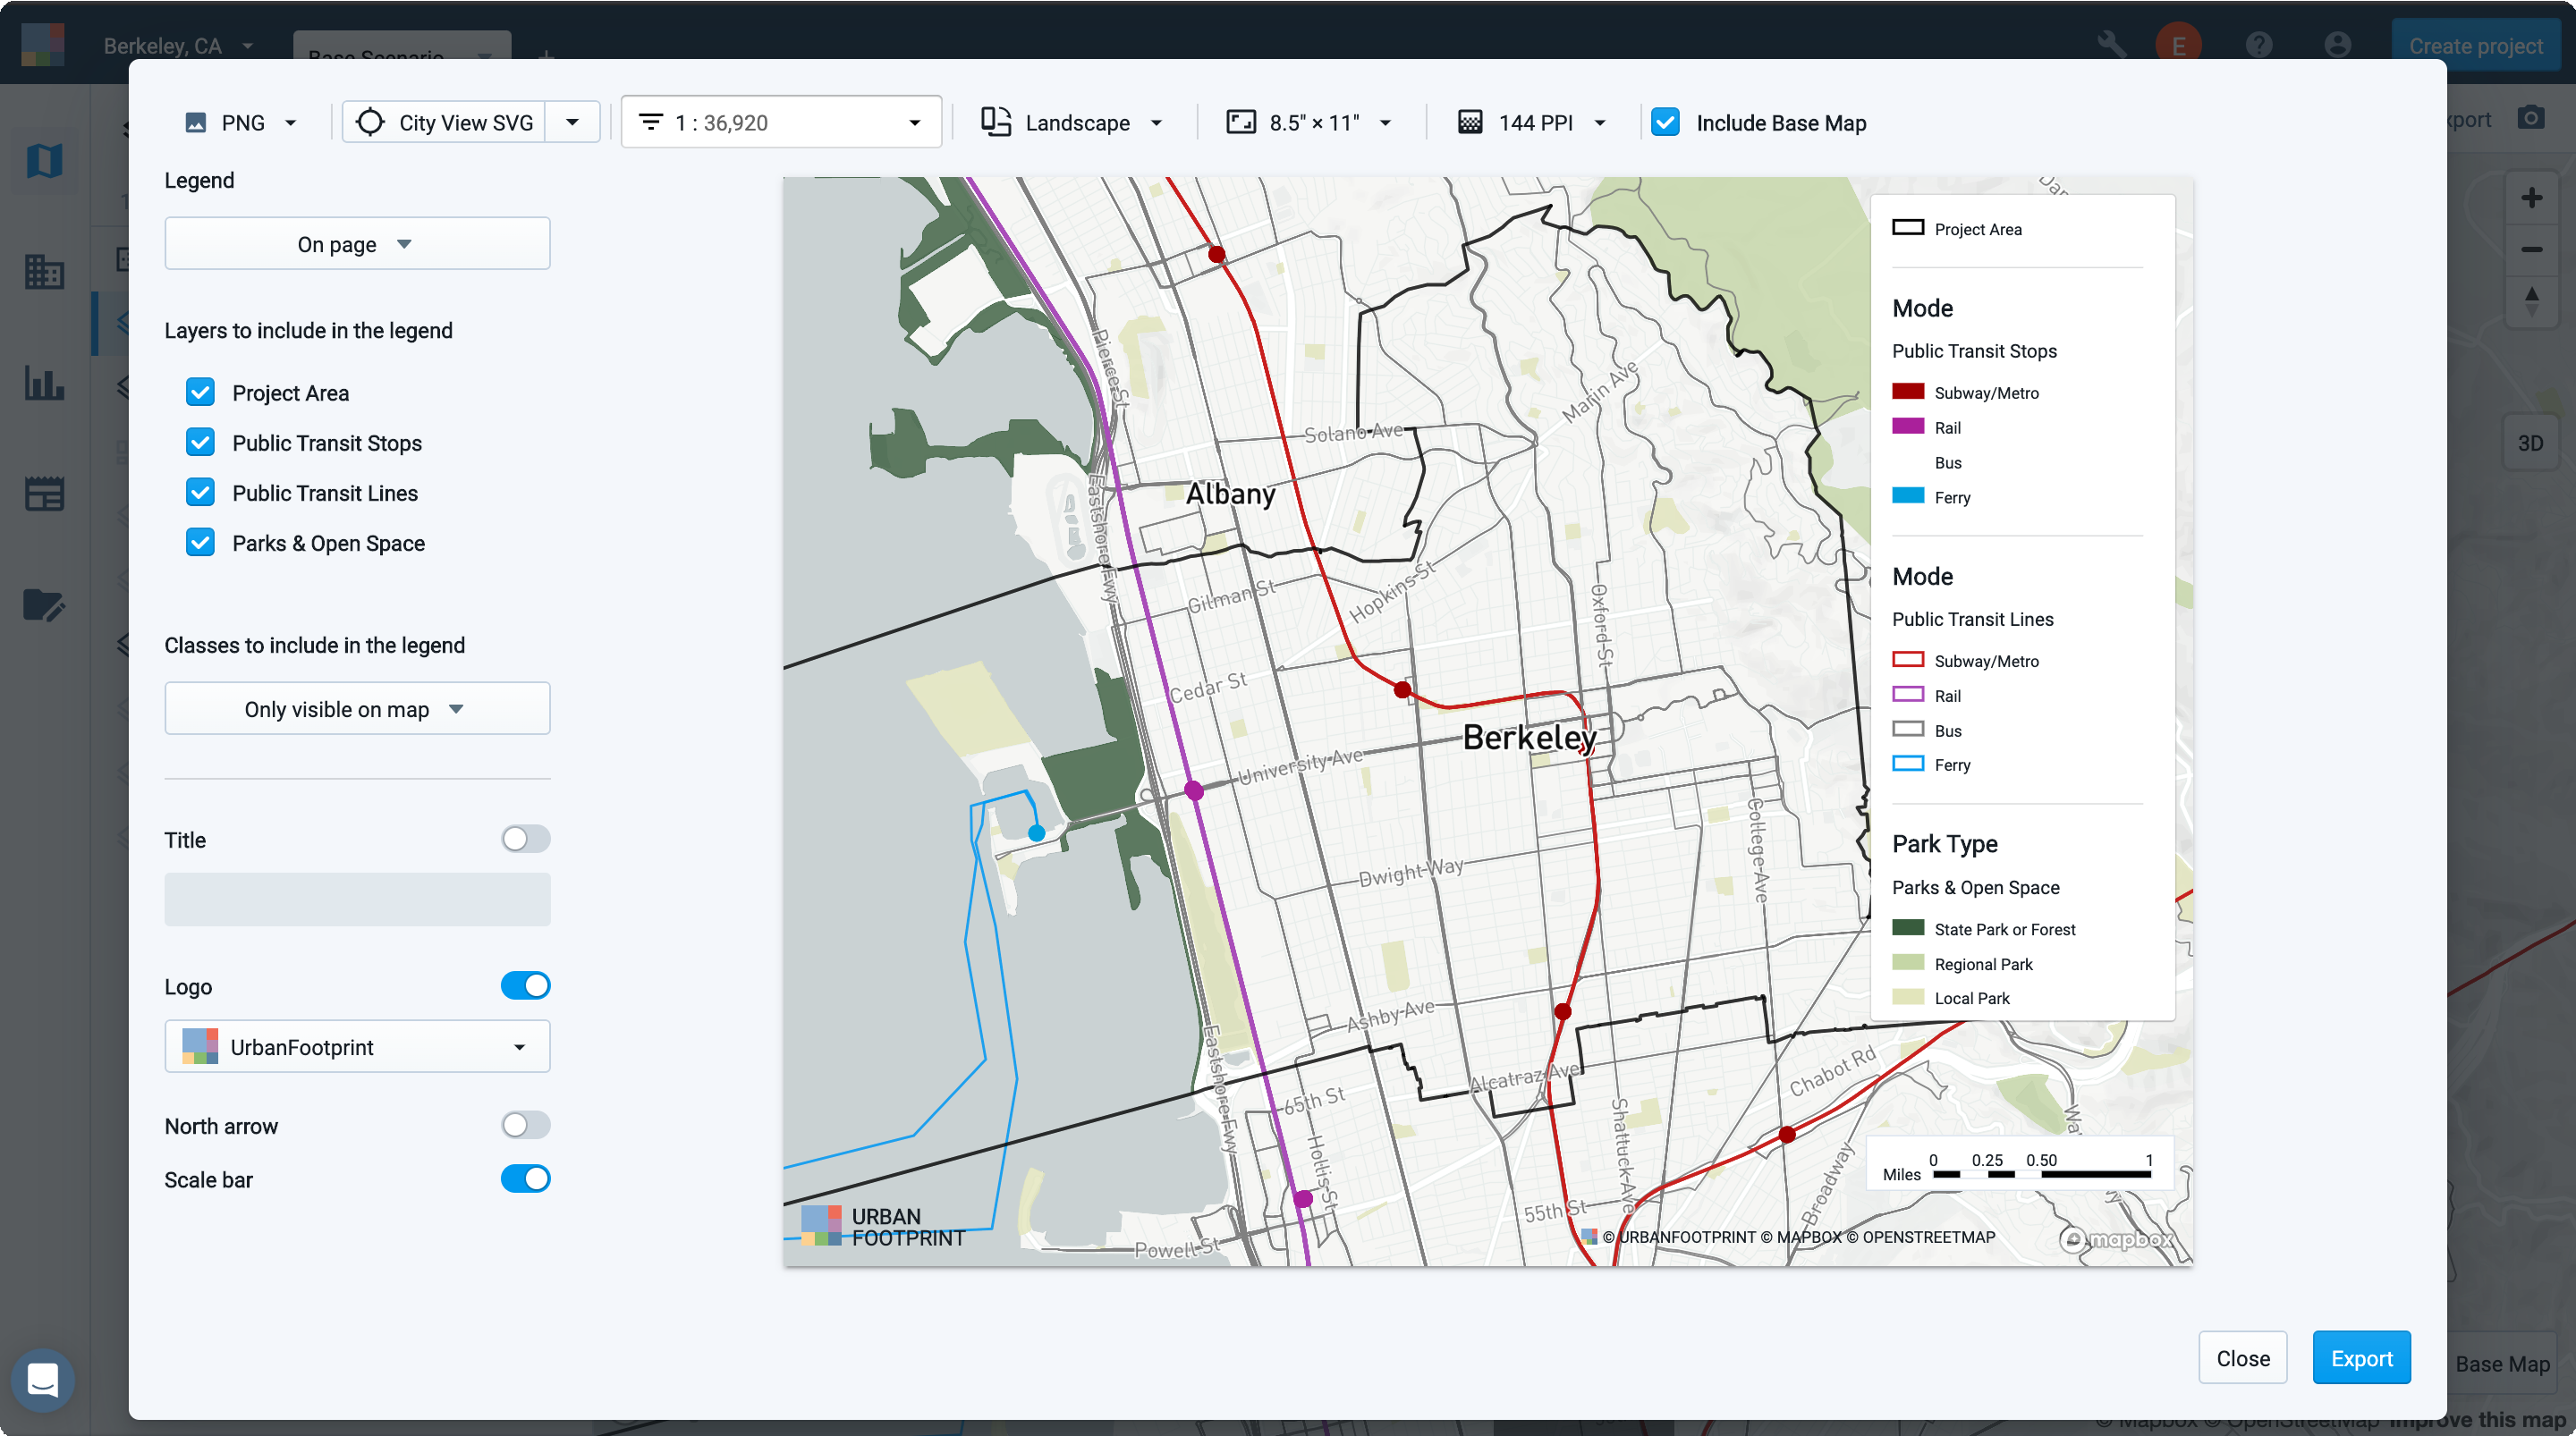
Map Export window with PNG export controls
Select the SVG export option at the top left corner of the window. Only the map export options applicable to SVG exports will remain active. All others—including controls for the map resolution, inclusion of the base map, legend, title, logo, north arrow, and scale bar—will be disabled since they are applicable only for PNG exports.
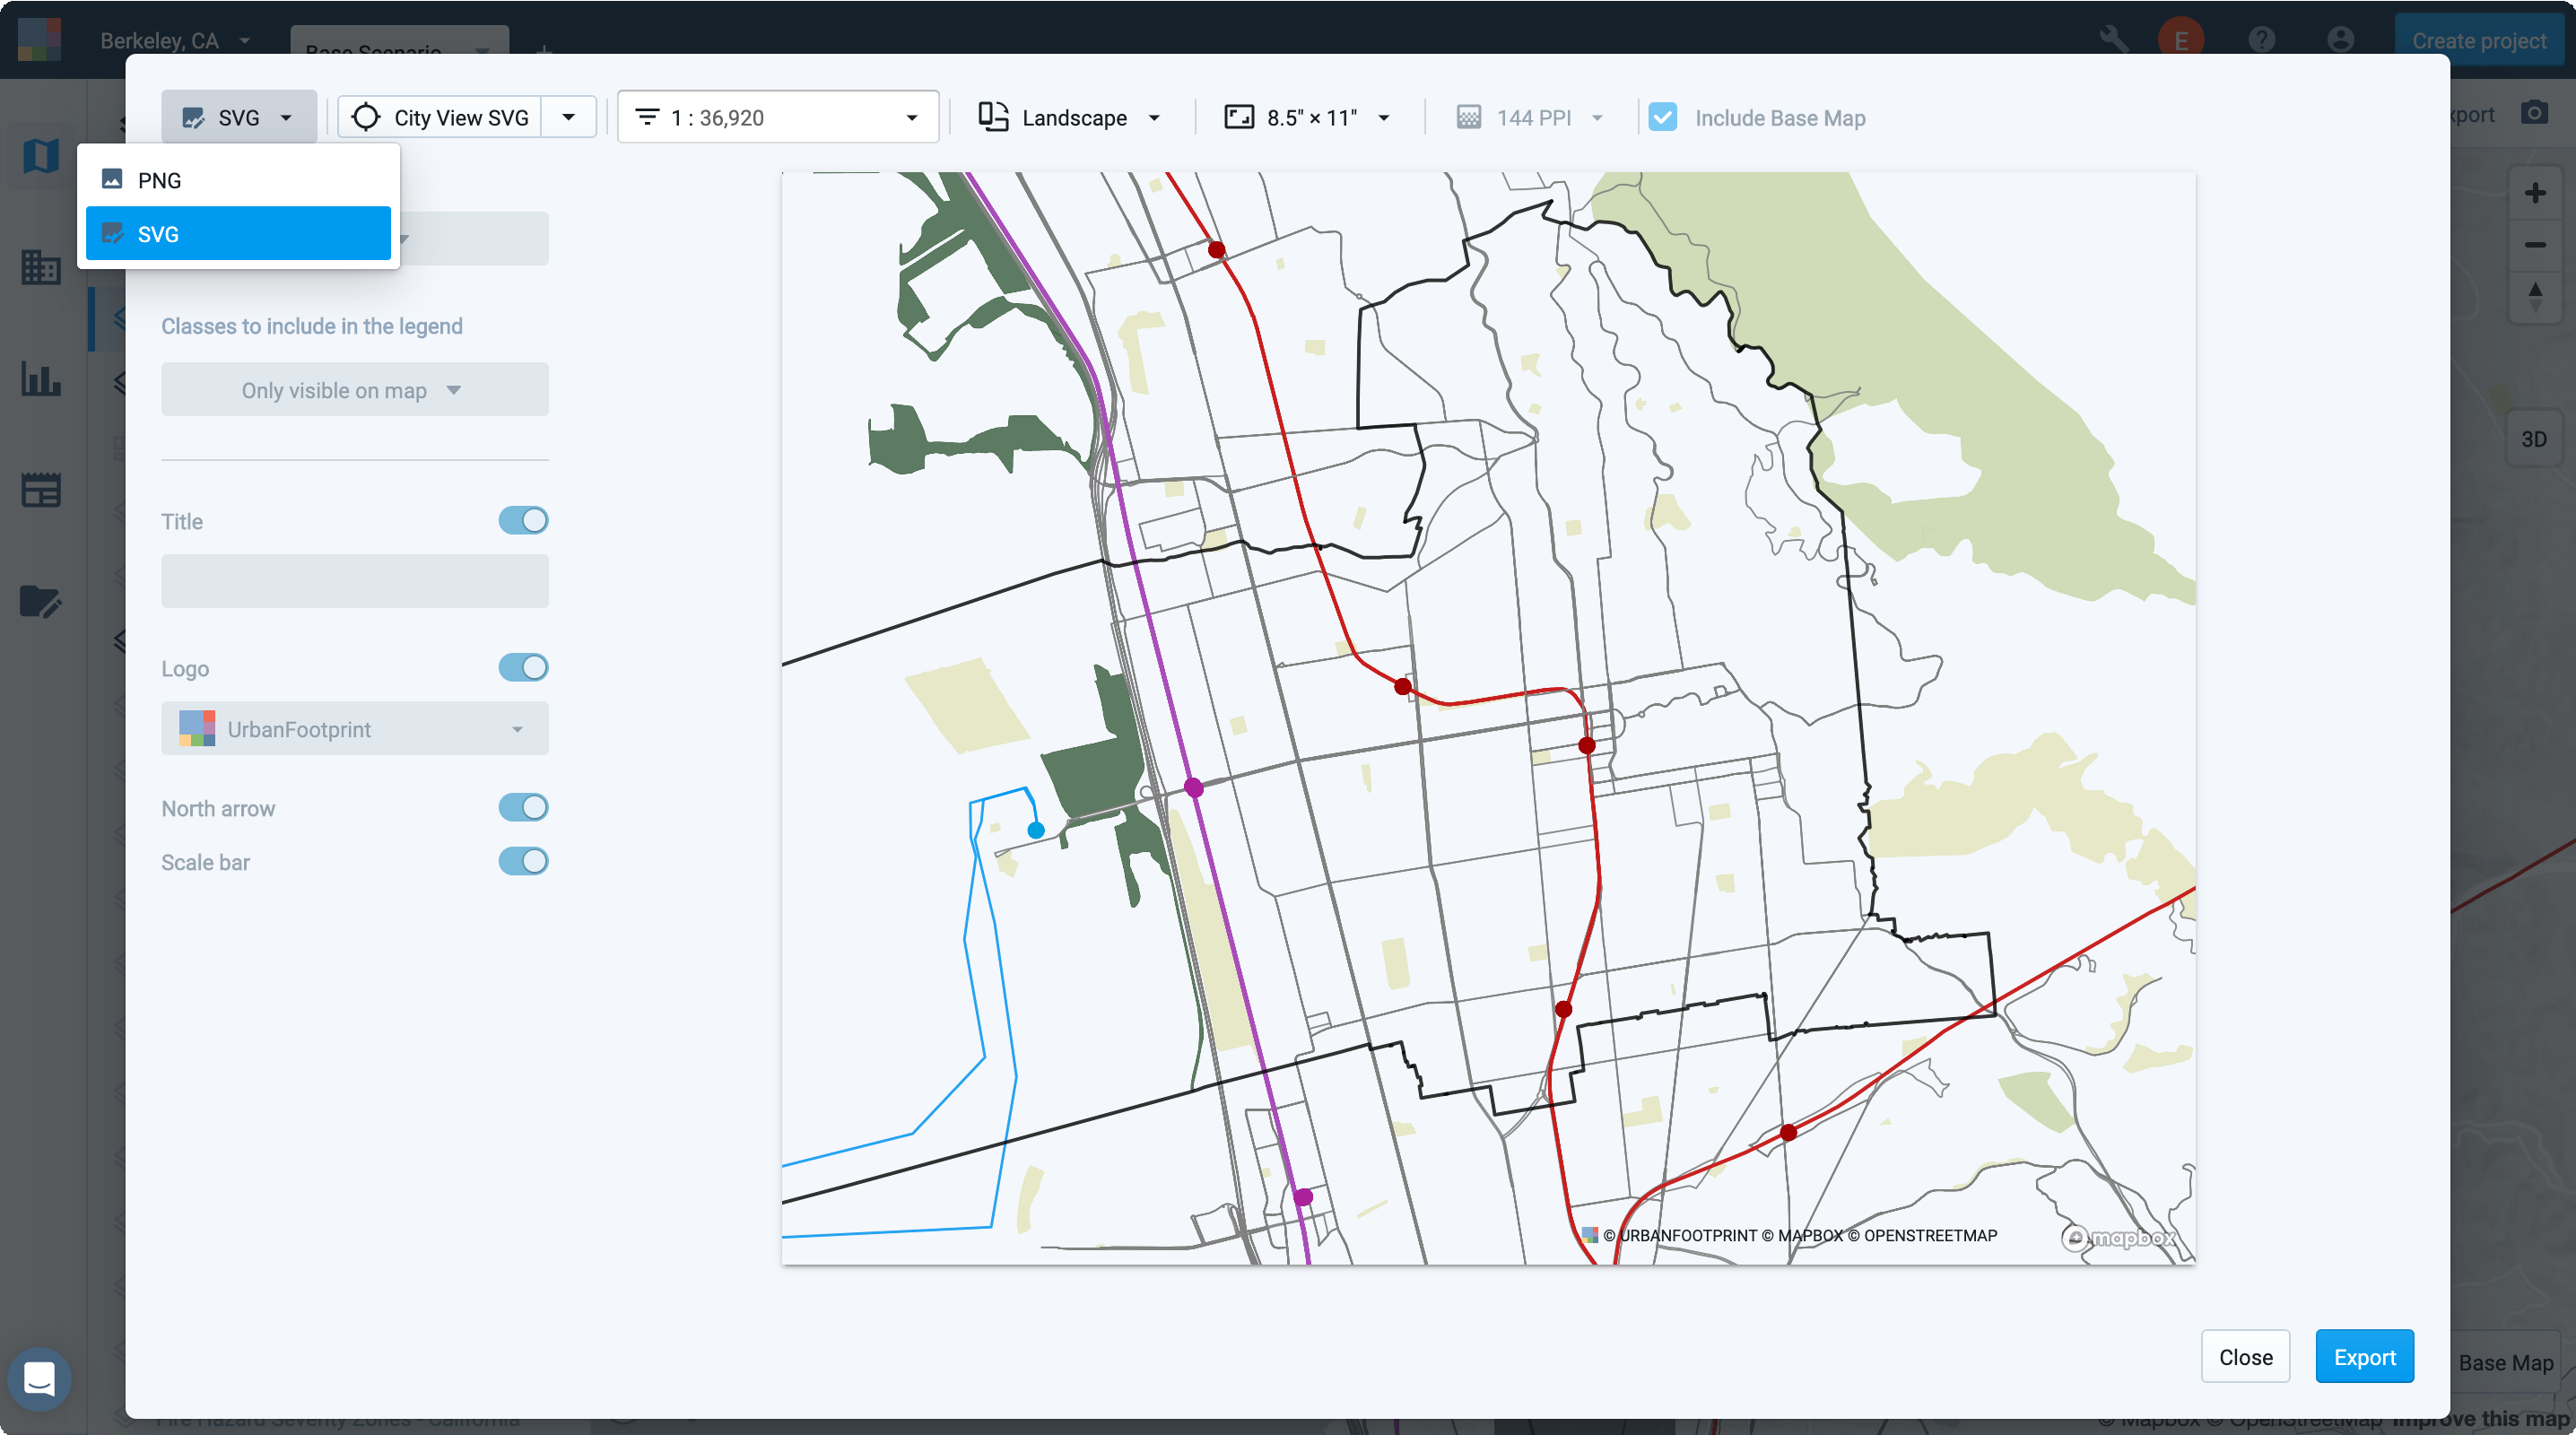
Map Export window with SVG export option enabled
Set your map orientation and size.
Pan, zoom, and set a map scale to adjust your map view.
Save your map position. Saving your map position is recommended so you can create other maps at the same extent.
Click Export to export your map. Exporting your map will take time, depending on its scope. When complete, you'll be prompted by a notification to download your map.

Note
The Export button will be disabled if your map area is too large and contains more than 300,000 features. Consider mapping a smaller area, or including fewer features or layers.
If an export is taking a very long time to complete, it's possible that the map features included are too geometrically complex. This may occur even with lower feature counts. If this occurs, please contact Analyst support for help.
Note
The file size of SVG exports increases with map size, and the number and geometric complexity of features included in the mapped layers. Large SVG files may be challenging to load and work with using Illustrator or other programs, depending on the capacity of your computer.
Click Download in the notification bar. The SVG file will be downloaded to your computer.
Open your SVG file in a vector graphics editing program. For our example, we'll look at the contents of the SVG file in Illustrator. If you use Illustrator, follow along and open the SVG map file that you exported in the previous steps.
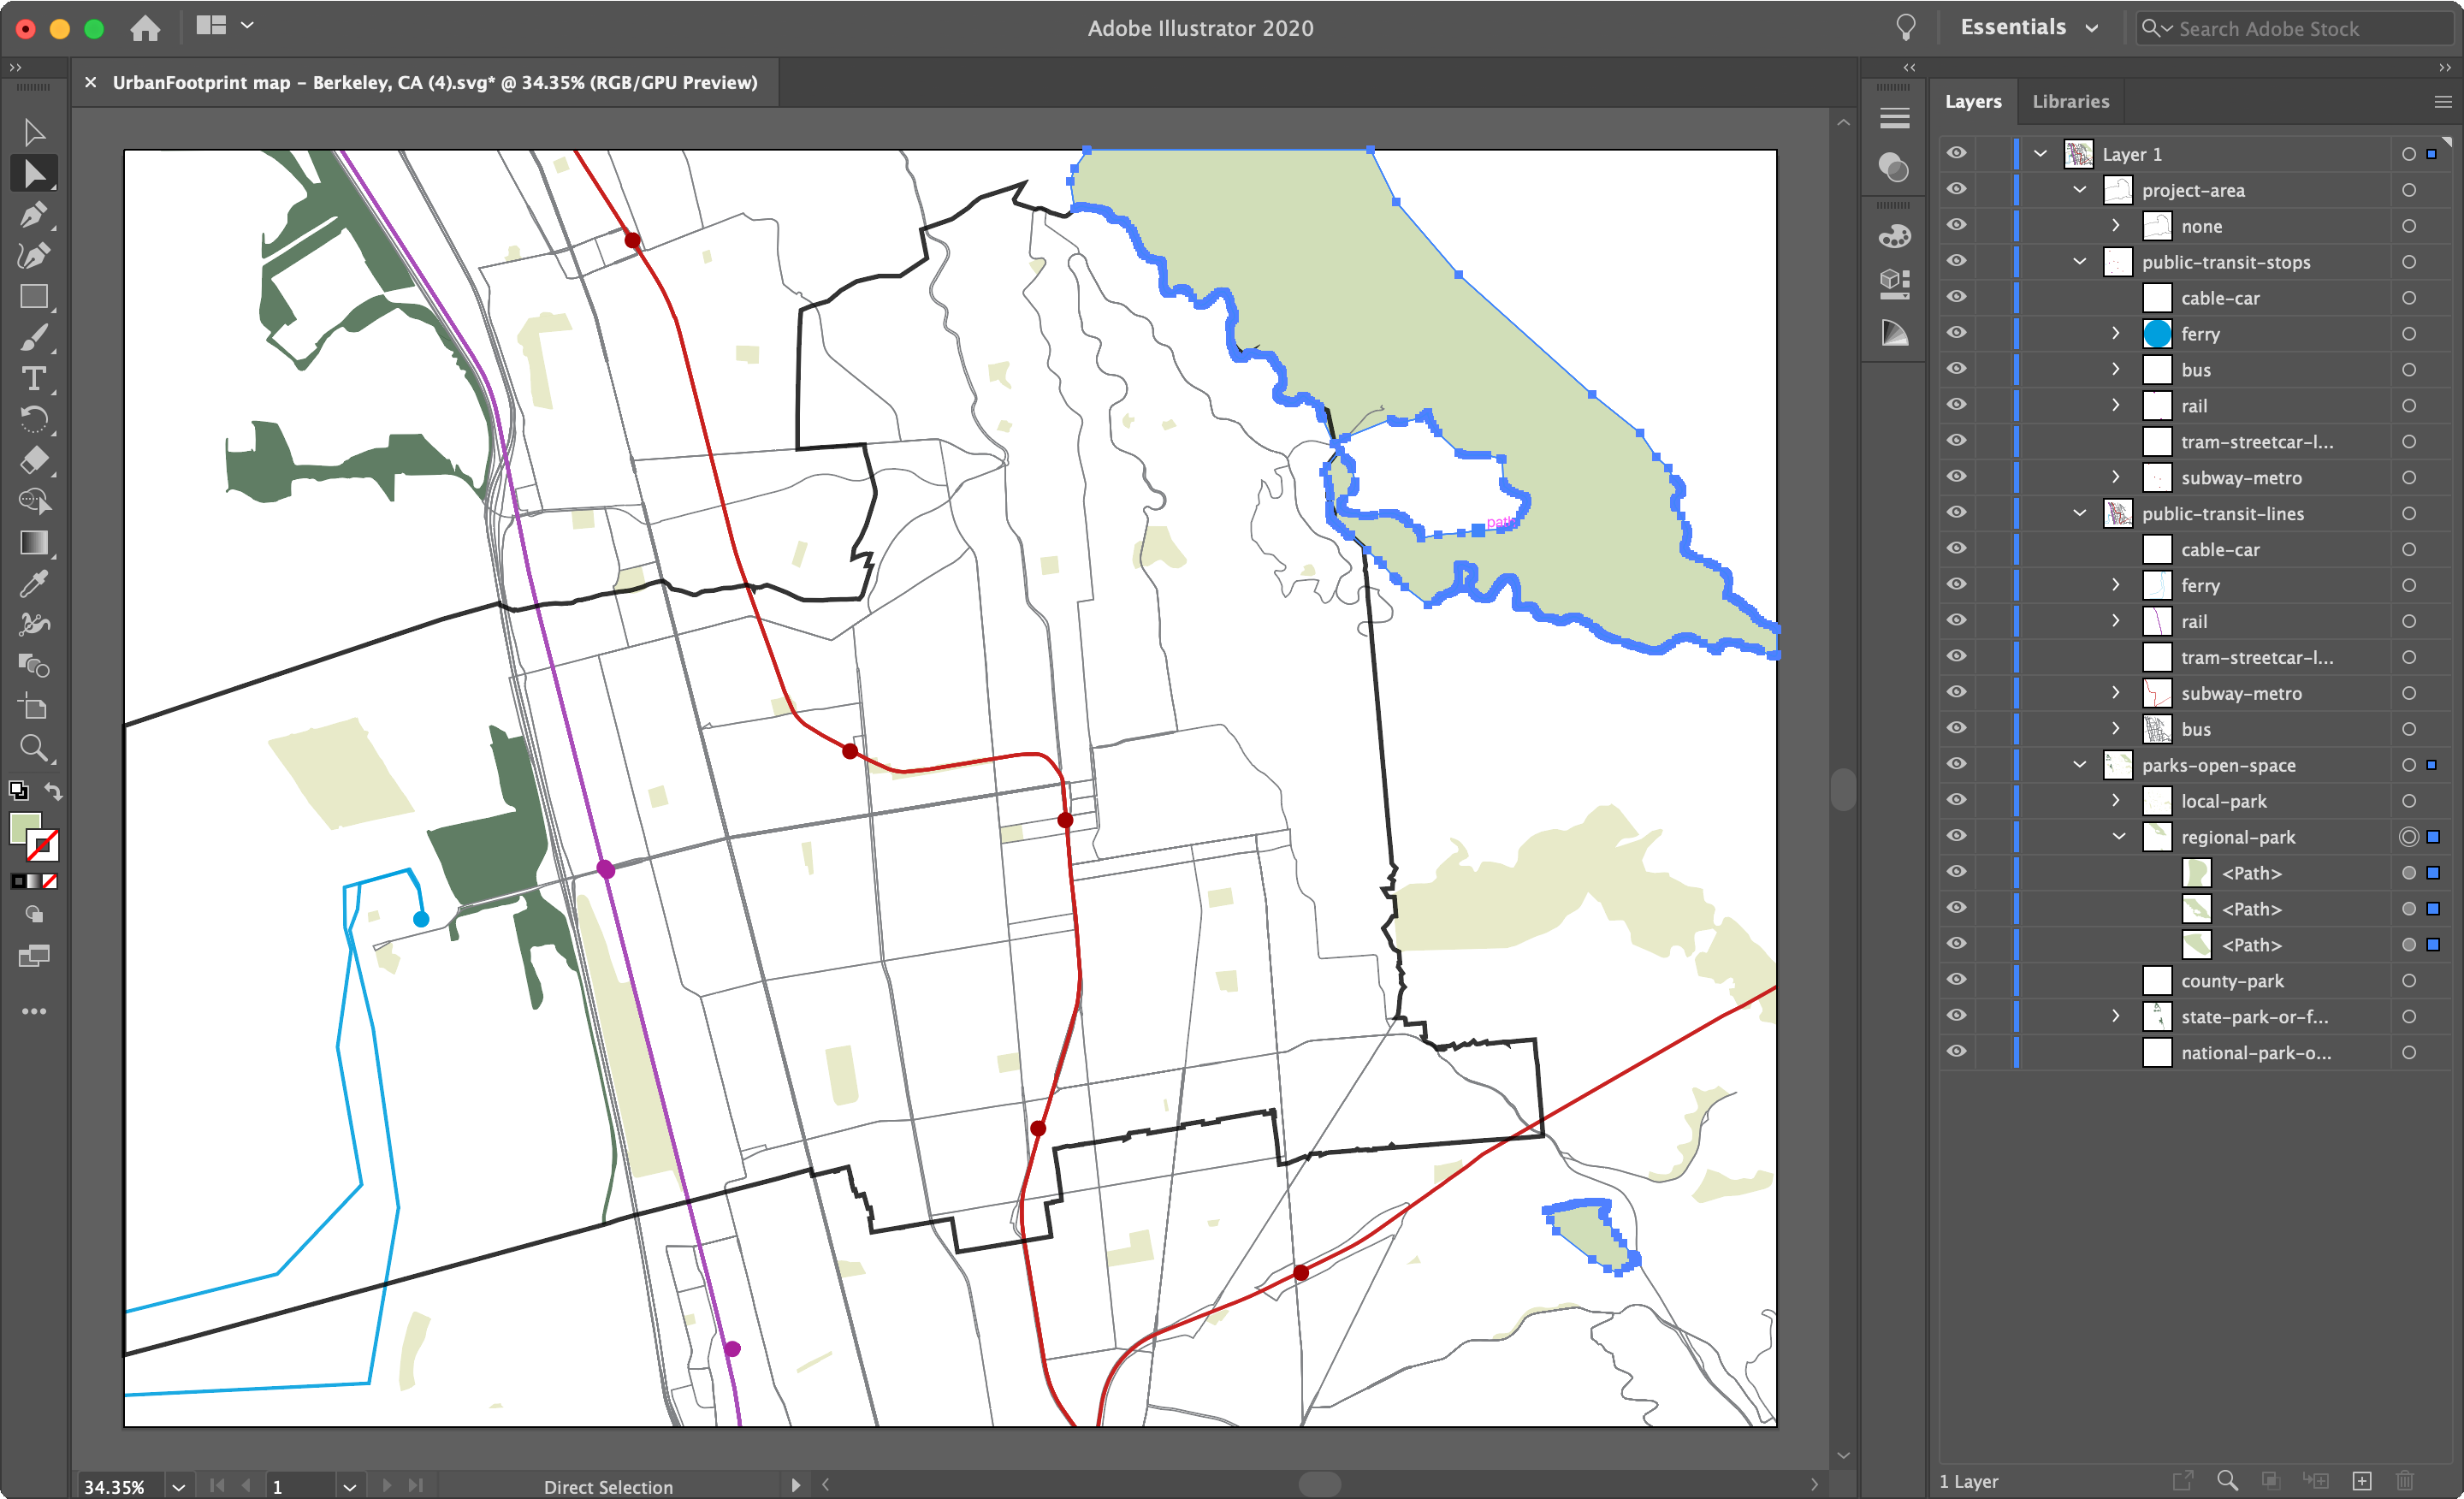
SVG file contents, shown in Illustrator
Take note of a few elements:
Grouping by layer and class – Each feature from the mapped Analyst layers is represented by a vector object. The Illustrator Layers panel shows the vector objects grouped first by Analyst data layer, then by class for the currently mapped column. For the Parks and Open Space layer in the example above, you can see that objects are grouped by park type. Here, we've selected all the "Regional Park" objects.
Style properties – All objects are symbolized using the colors and strokes as specified in Analyst.
Map extent – The area included in the SVG file matches that depicted in the Map Export view. Features that extend beyond the map area are cropped by the map edges.
Export your map to PDF format. When you have finished styling your map, you can export it to your specifications as a PDF file using the export controls of your graphics program.