Specify Place Types
Place Types are used to represent buildings, parks, and other elements in terms of their detailed built form characteristics. They are defined as a composite of one or more Building Types. Building Types and Place Types are used in painting scenarios. Components can be used as ingredients for Building Types, and Buildings Types as ingredients of Place Types.
This article steps through the specifications required to define a Place Type, and the resulting summary characteristics as displayed. It is organized according to the layout of the Manage > Place Types screen.
Place Type Summary
The Place Type Summary panel contains a summary of basic built form characteristics. The panel can be used to easily compare Place Types as you browse your library. All attributes are calculated by the model.
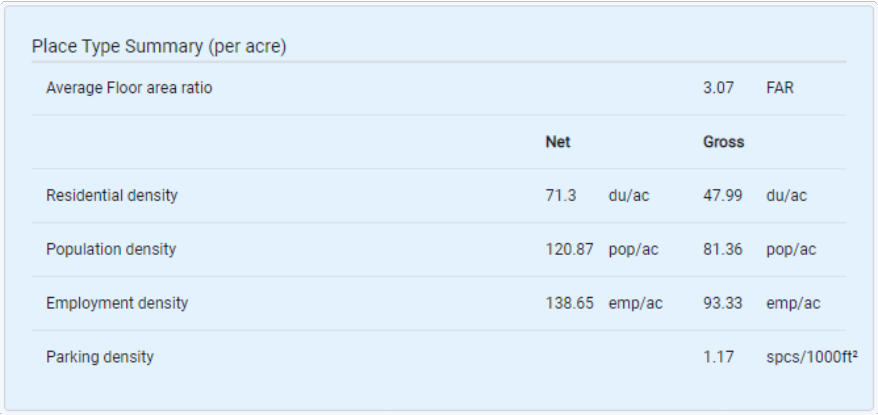 |
Place Type Summary panel
Average floor area ratio (FAR) – Floor area ratio (FAR) refers to the ratio of total gross building floor area to parcel area. Total gross building floor area for a Place Type is based on floor area as specified for the included Building Types. Values for the floor area of constituent Building Types are all normalized to one net acre, and weighted according to their percentage allocation within the Place Type. FAR is not dependent on the relative proportions of net and right-of-way area in a Place Type, nor will it vary if you apply a Place Type to features of different sizes.
Residential density (Net and Gross) – Net residential density refers to the number of dwelling units per acre of parcel area. Gross residential density refers to the number of dwelling units per acre of gross area, including parcel area plus area occupied by rights-of-way. Residential density for a Place Type is calculated as the weighted total of the densities of the included Building Types. Densities are weighted according to the percentage allocation of Building Types within the Place Type.
Population density (Net and Gross) – Net population density refers to the number of residents per acre of parcel area. Gross population density refers to the number of residents per acre of gross area, including parcel area plus area occupied by rights-of-way. Population density for a Place Type is calculated as the weighted total of the densities of the included Building Types. Densities are weighted according to the percentage allocation of Building Types within the Place Type.
Changing the variable assumptions for residential occupancy rate and household size(s) by housing type, as set on the Library Settings page, will change population density. See Use Library Settings for information on managing these settings.
Employment density (Net and Gross) – Net employment density refers to the number of jobs per acre of parcel area. Gross employment density refers to the number of jobs per acre of gross area, including parcel area plus area occupied by rights-of-way. Employment density for a Place Type is calculated as the weighted total of the densities of the included Building Types. Densities are weighted according to the percentage allocation of Building Types within the Place Type.
Changing the variable assumptions for non-residential building occupancy rate and gross floor area per employee by employment sector, as set on the Library Settings page, will change employment density. See Use Library Settings for information on managing these settings.
Average gross floor area per employee – Average gross floor area per employee for a Place Type is calculated based on the gross occupied non-residential floor area and jobs in the included Building Types. Changing the variable assumptions for non-residential building occupancy rate and gross floor area per employee by employment sector, as set on the Library Settings page, will change the average gross area per employee. See Use Library Settings for information on managing the underlying settings.
Parking density – Parking density refers to the total number of parking spaces (of all types) per thousand square feet of total gross building floor area. Parking density for a Place Type is calculated as the weighted total of the densities of the included Building Types. Densities are weighted according to the percentage allocation of Building Types within the Place Type.
Place Type Information
The Place Type Information panel contains basic information for identifying and categorizing the Place Type.
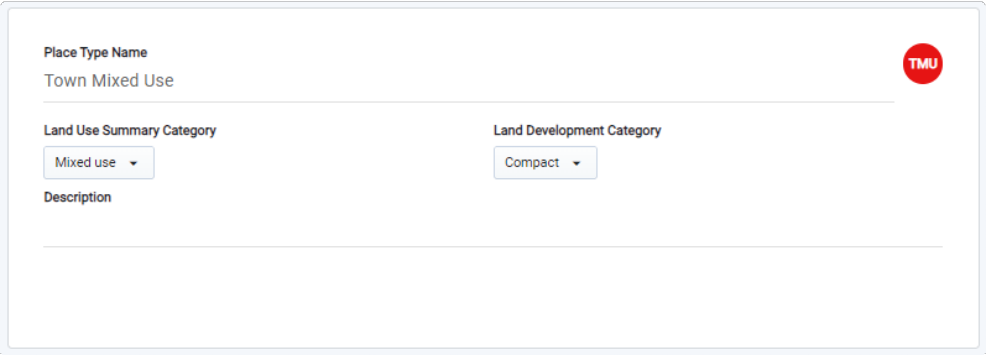 |
Place Type Information panel
Place Type Name – The Place Type Name as entered here appears in the Building Type Library list at the left of the screen.
Place Type Identifier – A colored circle containing the initials of the Place Type name, used as quick identifier here and in the Build Scenario > Place Types menu. A default color is selected based on land use category. Click on the chip to change the color.
Land Use Summary Category – Refers to the Land Use Summary (L1) designation. Select the L1 category that the Place Type should be associated with. (See Land Use Hierarchy for more information.)
Land Development Category – Land Development Category (LDC) is a meta-category used to identify broad development patterns. LDC is included as an attribute column in the Base Canvas and scenario canvases. Typical characteristics of LDCs are outlined in the table below.
Description - A description of the place type. This field is optional.
Land Development Category | Description |
|---|---|
Urban | The most intense category, reflecting a substantial proportion of mid- and high-rise buildings as seen in the core downtown areas of mid-size and larger cities. These areas are supported by higher levels of regional and local transit service. Well connected street networks and the mix and intensity of uses result in a highly walkable environment and relatively low dependence on the automobile for many trips. The majority of housing in Urban areas is multifamily and attached single family (townhome). Generally, most Urban growth occurs as infill or redevelopment in or adjacent to existing urban cores. |
Compact | Compact areas are highly walkable with a rich mix of commercial, residential, and civic uses. Compact areas are well served by regional and local transit service, though not to the same extent as Urban areas, which can be significantly more intense. Streets are well connected and walkable, and essential destinations can typically be reached via a walk, bike, transit, or short auto trip. Compact areas contain a diverse mix of housing, from multifamily and attached single family (townhome) to small-lot single family homes. New Compact growth can occur in already urbanized areas, on the urban edge, or in larger-scale redevelopment projects. |
Suburban | The Suburban category represents the auto-oriented development patterns that predominate in much of the U.S. Densities are lower than those of Compact areas, with uses that are generally not highly mixed or organized to facilitate walking, biking, or transit service. Suburban areas are not typically well served by regional transit service, and may have limited local service. Local street networks are not well connected, and there are fewer destinations available via walk or bicycle. Most trips are made via automobile. The Standard place type can contain a wide variety of housing types, though large-lot single family homes comprise the majority of this development form. Suburban growth can occur on the urban edge or as leapfrog development. |
Rural | The Rural category comprises areas that are primarily dedicated to agriculture or grazing, or are largely undeveloped. |
Building Types by Land Area
The built form characteristics of a Place Type are derived from the mix of Building Types and right-of-way areas specified in this panel.
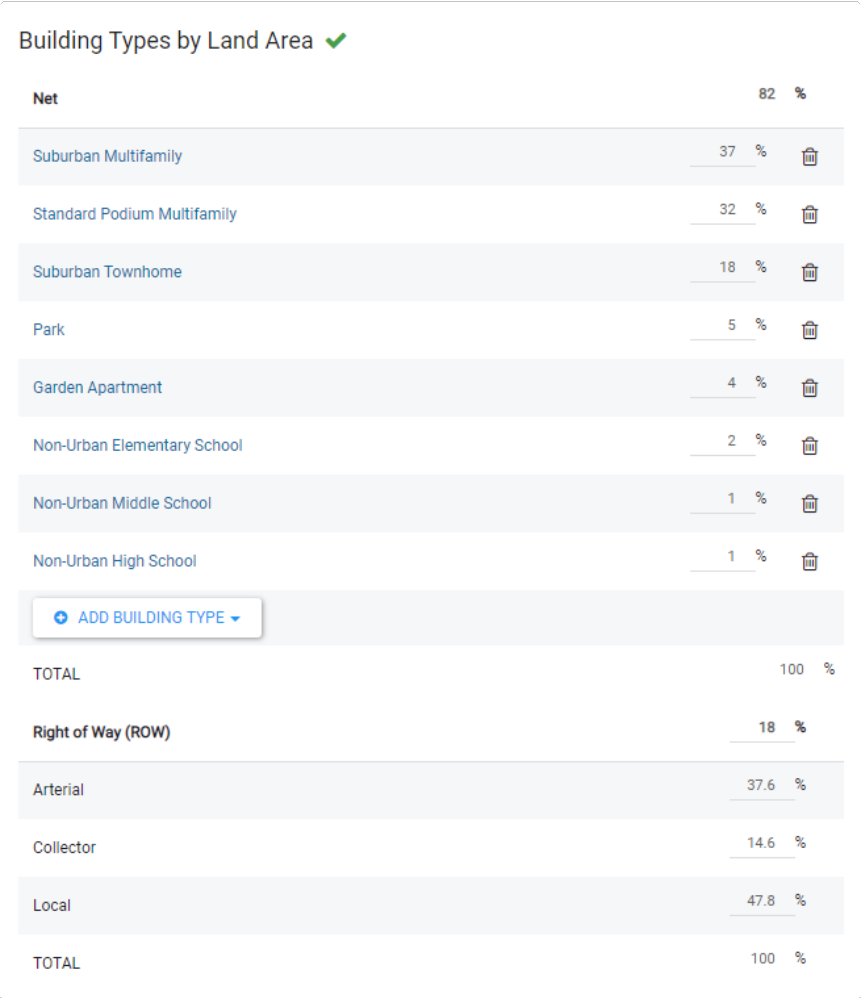 |
Building Type distribution within a Place Type
Net area percentage – The percentage of land area (over one acre) dedicated to net parcel area as distributed among Building Types. The net percentage is calculated based on the right of way percentage to bring the total area distribution to 100%.
Add Building Type – To add a Building Types to the Place Type, click + ADD BUILDING TYPE. This brings up a searchable list of Building Types to choose from. Once you select one, it is added to the Building Types by Land Area list.
Building type percentage – The share of the Place Type represented by the Building Type, in terms of land area. The percentages must total to 100%.
Right of Way (ROW) area percentage – A percentage used to specify the percentage of land area (over one acre) dedicated to area for rights of way. The net area percentage is dependent on the right of way area percentage. Right-of-way area is classified into a hierarchy of three functional roadway classifications: Arterial, Collector, and Local.
Area Coverage (Place Types)
The Area Coverage section offers a summary of how the land area of a Place Type is distributed. The information, all of which is read-only, includes the amount of land area per acre of each type of coverage, and its share of the total. The chart illustrates the distribution of coverage.
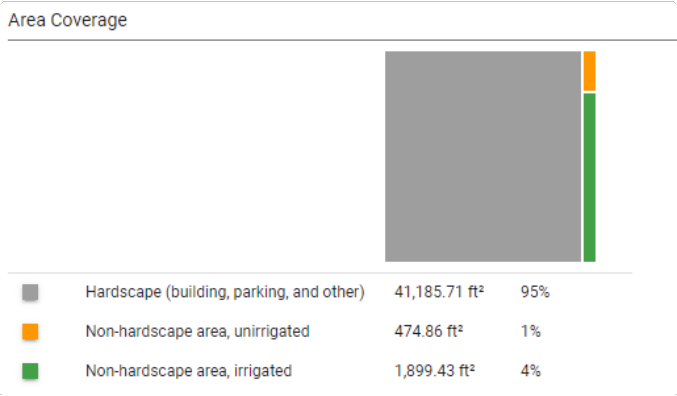 |
Area Coverage panel
The coverage categories include:
Hardscape – This includes building footprint area, structured parking footprint area, surface parking area, and "other hardscape" area as specified for Components. The area per acre by Place Type is calculated as a weighted total of the included Building Type areas.
Non-hardscape area, unirrigated – This area is a product of non-hardscape area and irrigated/non- irrigated percentage. The area per acre by Place Type is calculated as a weighted total of the included Building Type areas.
Non-hardscape area, irrigated – This area is a product of non-hardscape area and irrigated/non- irrigated percentage. The area per acre by Place Type is calculated as a weighted total of the included Building Type areas.
Residential Floor Area Allocation (Place Types)
The Residential portion of the Floor Area Allocation panel summarizes the number of dwelling units and average unit sizes by housing type. The values are calculated based on the housing distribution of the included Building Types.
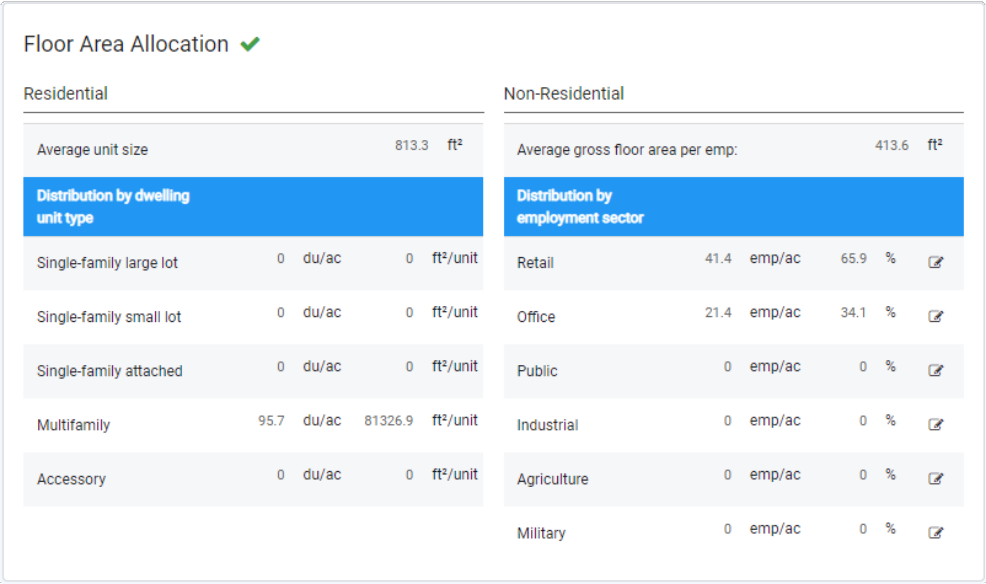 |
Floor Area Allocation panel
Average unit size – The average unit size per dwelling unit, expressed in terms of net residential floor area.
Distribution by dwelling unit type – Information for each dwelling unit type include number of units per acre, and average unit size.
Single-family large lot – Analyst defines large lot homes as those with lot sizes of 5,500 sq. ft. and above. The distinction between large and small lot single family homes supports the use of differentiated assumptions for household size, as well as analysis assumptions for energy and water use.
Single-family small lot – Analyst defines small lot homes as those with lot sizes under 5,500 sq. ft. The distinction between large and small lot single family homes supports the use of differentiated assumptions for household size, as well as analysis assumptions for energy and water use.
Single-family attached – Includes townhomes, rowhomes, duplexes, and other single-family home types with shared walls.
Multifamily – Refers to housing in which multiple units are contained within a single building or group of buildings.
Accessory – Refers to a secondary dwelling unit on a lot occupied by a primary dwelling unit (typically a single-family home).
Non-Residential Floor Area Allocation (Place Types)
The Non-Residential portion of the Floor Area Allocation panel summarizes the employment mix that results from how non-residential building area is distributed among employment uses. Employment is represented by six top-level sectors and a number of sub-sectors that nest into them. Employment density at the Component level is determined by the floor area allocations, along with assumptions for the distribution of employment by subsector, floor area per employee, and non-residential building occupancy. The densities for Place Types are calculated based on the employment area characteristics of the included Building Types and their underlying Components.
Changing the variable assumptions for non-residential occupancy rate and floor area per employee by sector and building density category, as set on the Library Settings page, will change the employment densities. See Use Library Settings for information on managing these settings.
|
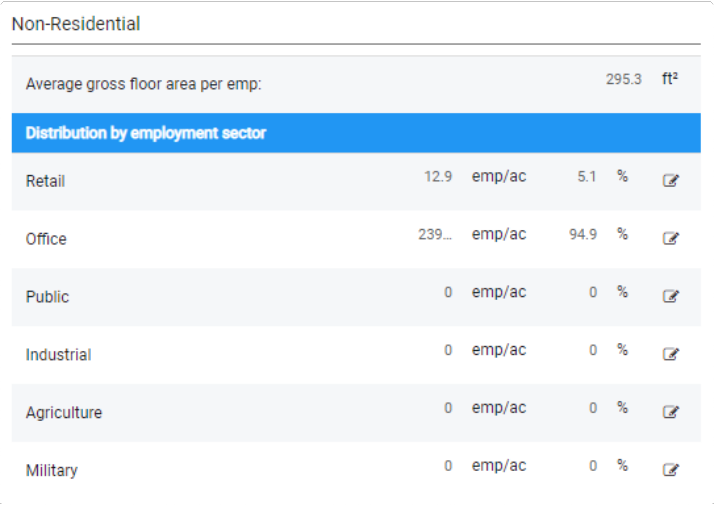
Floor Area Allocation panel
Average gross floor area per employee – Calculated based on the gross occupied non-residential floor area and jobs in the included Components. Changing the variable assumptions for non-residential building occupancy rate and gross floor area per employee by employment sector, as set on the Library Settings page, will change the average gross area per employee. See Use Library Settings for information on managing the underlying settings.
Distribution by employment sector – Summarizes the employment mix for the Place Type in terms of the density and share of employees in each of the six top-level sectors. Job densities are determined by specifications made at the Component level for how non-residential floor area is distributed, and variable assumptions for floor area per employee. For more information, see Non-Residential Floor Area Allocation for Components.
Employment mix and densities cannot be set directly. At the Place Type level, you can tune employment densities by adjusting the mix of Building Types included. These specifications are required to support robust planning and analysis that account for employment by type, and the impacts of different uses on building energy use, water use, carbon emissions, and more.
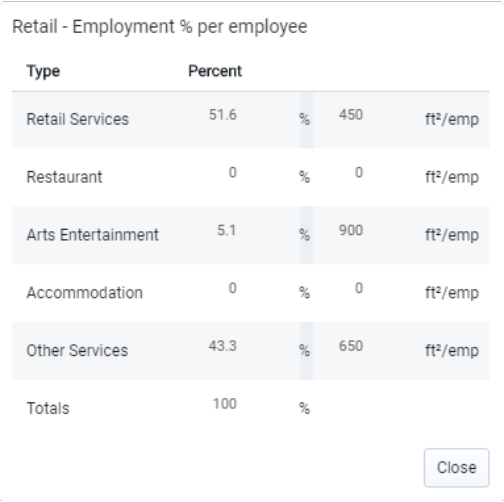
Each sector row contains a value for employment density and the percentage of employees in that sector. Clicking the Edit button
 allows you to view the further distribution of employment into subsectors. The employment sectors and subsectors are listed below.
Retail – Includes Retail Services, Restaurant, Arts & Entertainment, Accommodation, and Other Services.
Office – Includes Office Services and Medical Services.
Public – Includes Public Administration and Education Services.
Industrial – Includes Manufacturing, Wholesale, Transportation & Warehousing, Construction, and Utilities.
Agriculture – Includes Agriculture and Extraction.
Military – Includes Military only.
 |
Distribution of employees by employment sector
 |
Distribution of employees by employment sector