Review and Edit Attributes in the Base Canvas
Generating the Base Canvas involves cleaning, compiling, and processing geographic and tabular data from a number of sources, including parcel data and multiple census datasets. Given the automated nature of this process, and the potential of inaccuracies in source data, you may find areas where the Base Canvas does not reflect existing development accurately.
To address these discrepancies, you can edit features of the Base Canvas. Base Canvas editing allows you to reclassify a feature with a different land use type and update the base values accordingly. You can also change just the land use type while maintaining the feature's original attribute values, or change the attribute values without changing the original land use type. In any case, changes are carried forward to the Base Canvas across all scenarios in your project.
As part of the editing process, you can also refine your canvas by removing individual parcel or census block features.
Build Mode Editing Controls
The controls used to edit land use and development on features of the Base Canvas are accessed via Build mode for the Base Scenario. You can also access the controls by clicking the Build tab of the Layer Details pane for the Base Canvas layer. The interface for Base Canvas editing is the same as that for scenario building.
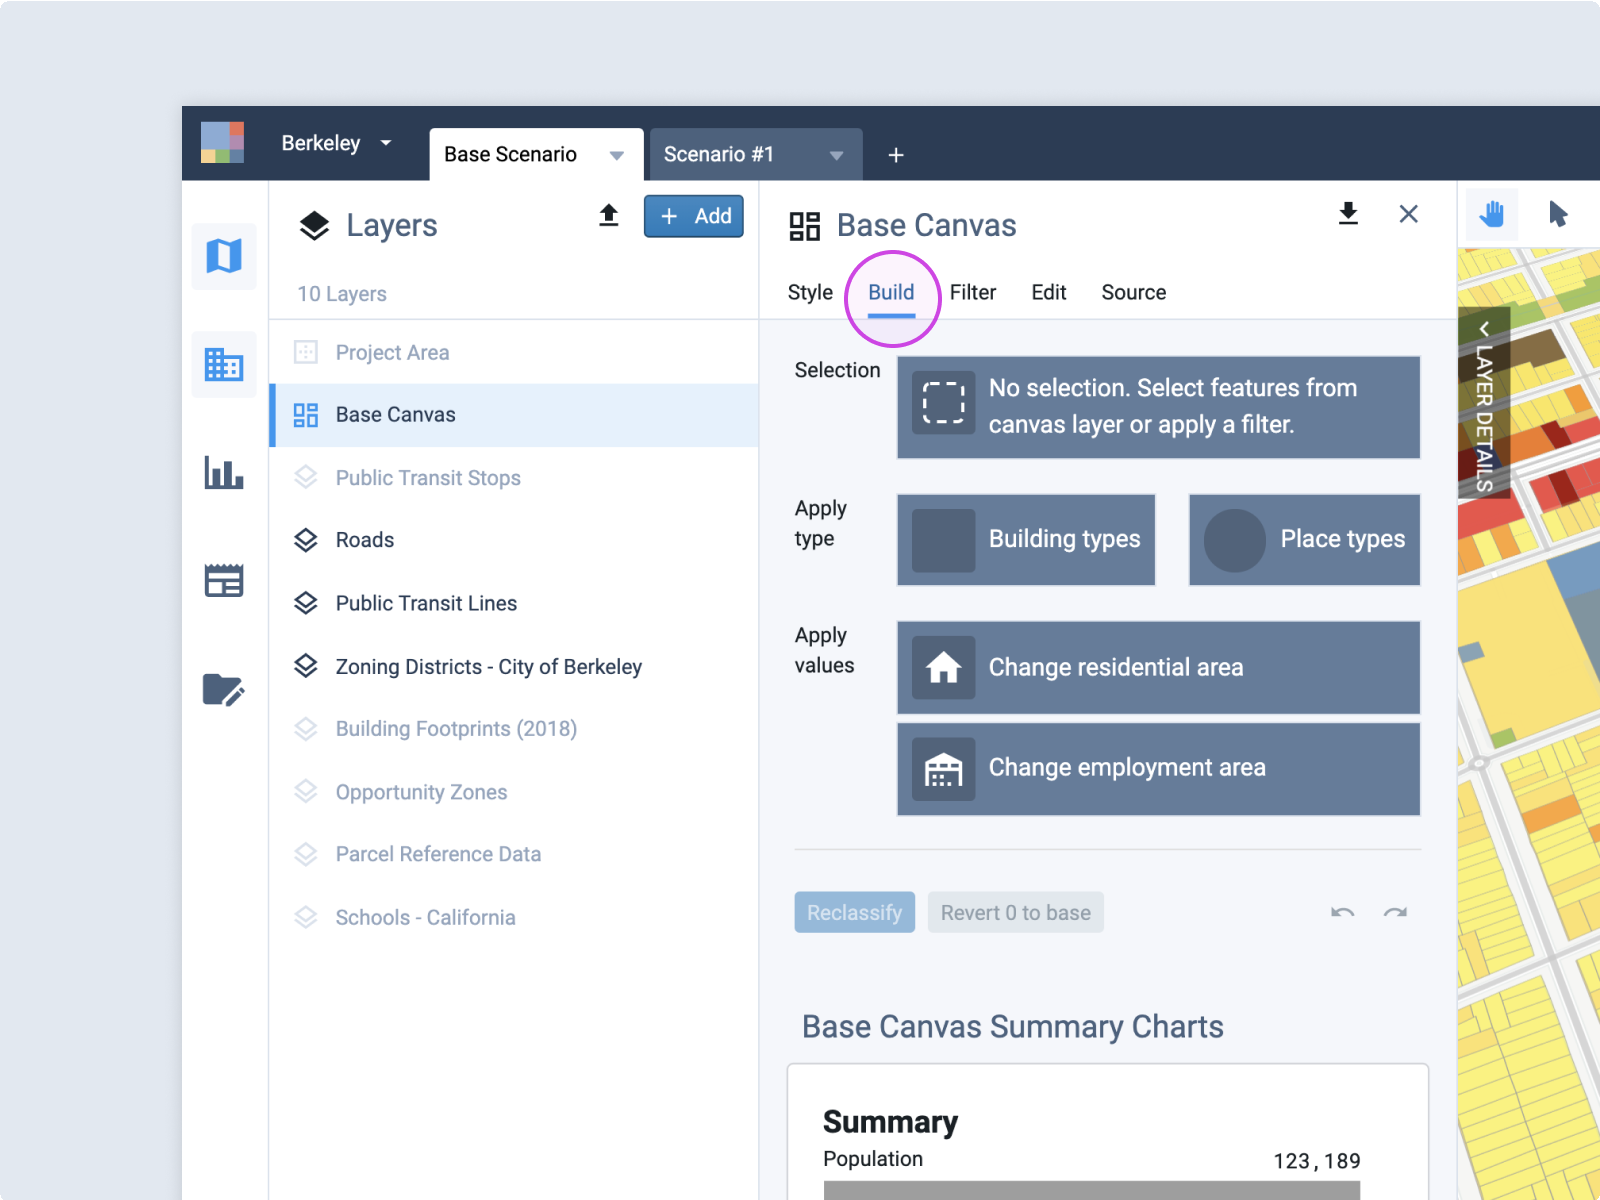 |
The controls for Base Canvas editing are akin to those for scenario building, except that they are used to reclassify existing development instead of asserting future development. They include:
Selection – Summarizes the currently selected canvas features. The first line includes a count of the features selected, along with the count of features in the entire project area canvas. The second line indicates the total area within the selected features.
Apply Type – Clicking Apply type opens either the Building Types or Place Types selection window, from which you can select a type to reclassify with. Types are listed in alphabetical order, by Land Use Summary (L1) category. L1 categories include Mixed Use, Residential, Commercial, Industrial/Warehouse, Civic/Institutional, Transportation/Utilities, Open space, Vacant/Other, Agriculture, Natural resources, Natural/Conservation, and Water.
The Building Types menu is shown below with details expanded for one of the types. You can see the details for a type by clicking the arrow in the upper right corner of an entry. Building Type details include:
Density (net) – Includes net residential and employment densities, which are measured over parcel area.
Building/Parcel Information – Summarizes basic characteristics about the building type, including the average number of floors and floor area ratio (FAR).
Building Use Mix – Summarizes the building floor area distribution among five use categories: Residential, Retail, Office, Industrial, and Other (including Public and other non-residential uses).
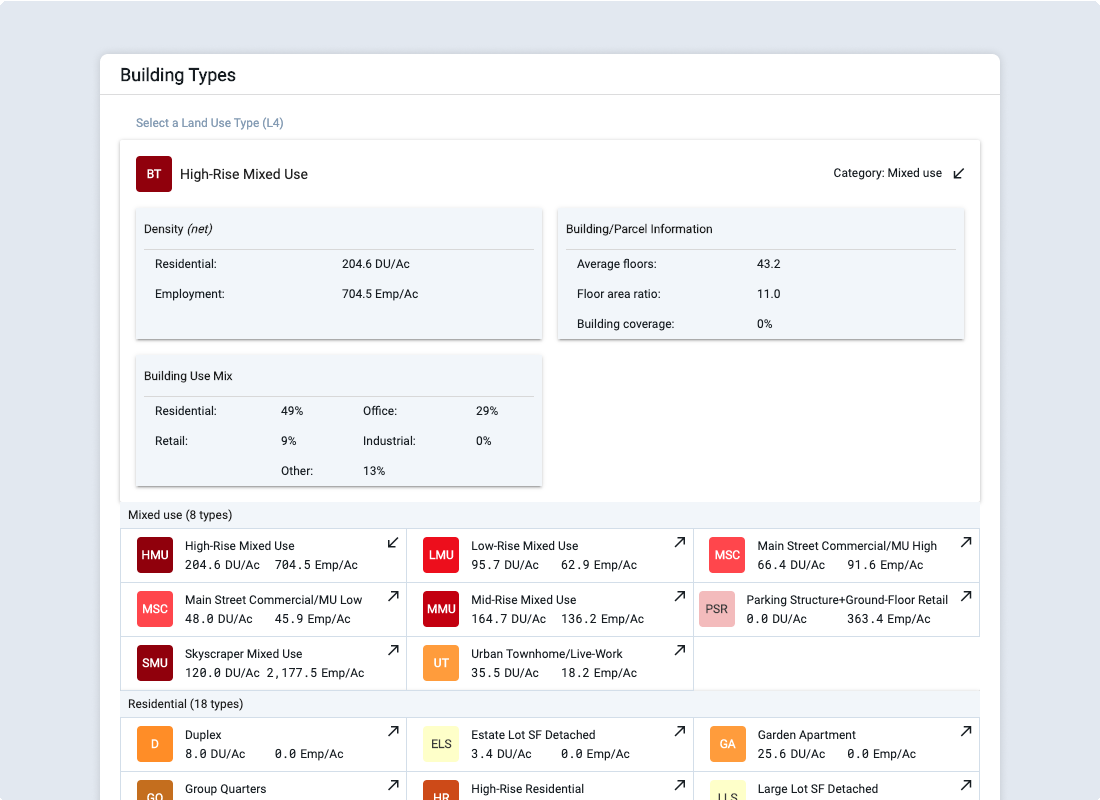 |
Building Types selection window with expanded details
Place Type details include:
Density – Includes net and gross residential and employment densities. Net densities are measured over parcel area, while gross densities are measured over gross area inclusive of rights of way.
Land Use Information – Summarizes the distribution of land between parcels and streets, parks, and civic areas.
Residential Mix – Summarizes the distribution of housing, if applicable, by housing type; types include single-family large lot, single-family small lot, townhome, and multifamily.
Employment Mix – Summarizes the distribution of employment by broad sector: Retail, Office, Industrial, and Other.
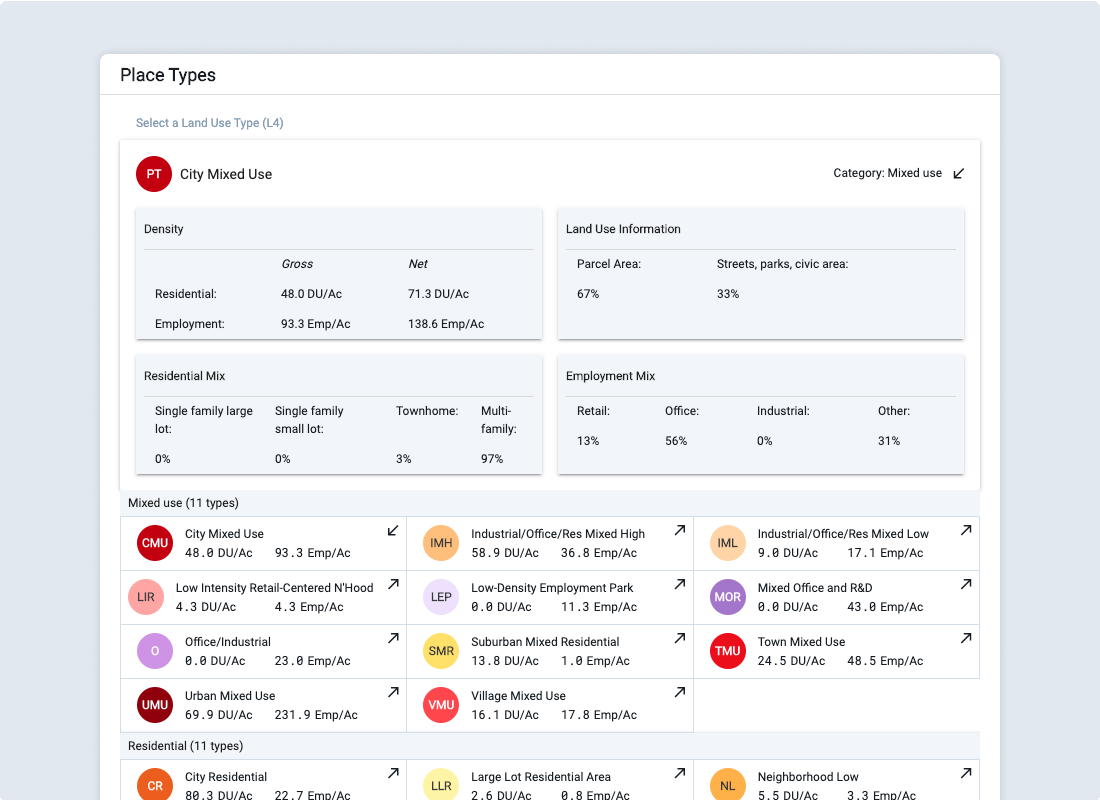 |
Place Types selection window
Apply Values – Includes:
Change residential attributes – Select to replace the original Base Canvas values for population, dwelling units (DU), and associated residential floor area.
 |
Residential attribute entry
Change employment attributes – Select to replace the original Base Canvas values for employees and associated employment floor area.
 |
Employment attribute entry
Reclassify x features – Click to reclassify the x selected feature(s).
Revert x to base – Click to revert the x reclassified feature(s) in the selection to the original Base Canvas condition.
Undo/redo arrows –Click to undo or redo your last reclassification, feature removal, or feature splitting action. Note that your last action may have been applied to a selection of features that is no longer current. Your past sequence of actions is retained across sessions.
Base Canvas Summary Charts
The four charts in this section provide summarized information about new development in the Base Canvas. The bars in each chart indicate counts for the base. The charts include:
Summary – Shows total population, dwelling units, and employment.
Dwelling Units by Type – Shows counts of single-family detached, single-family attached (townhome), and multifamily units.
Employment by Sector – Shows counts of employment by sector, including retail, office, public, industrial, agriculture/extraction, and military.
Building Square Feet by Type – Shows amounts of residential, retail, office, public, and industrial building floor area, in square feet.
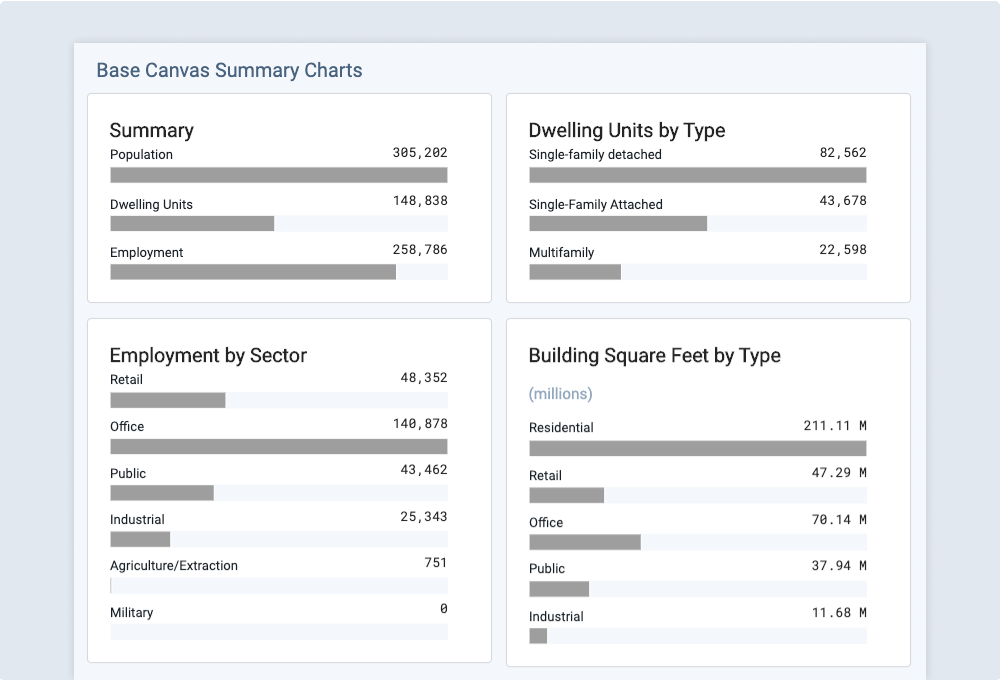 |
Base Canvas summary charts shown in Build mode
Edit the Base Canvas
To start, you’ll enter Build mode. From there, you can edit development using land use types alone, or edit by attribute using manually entered residential and employment attributes.
Enter Build Mode for Base Editing
Select the Base Scenario.
Click the Build icon
 in the Mode bar. Alternatively, you can access the Base Canvas editing controls by activating the Base Canvas layer and selecting the Build tab in the Layer Details pane.
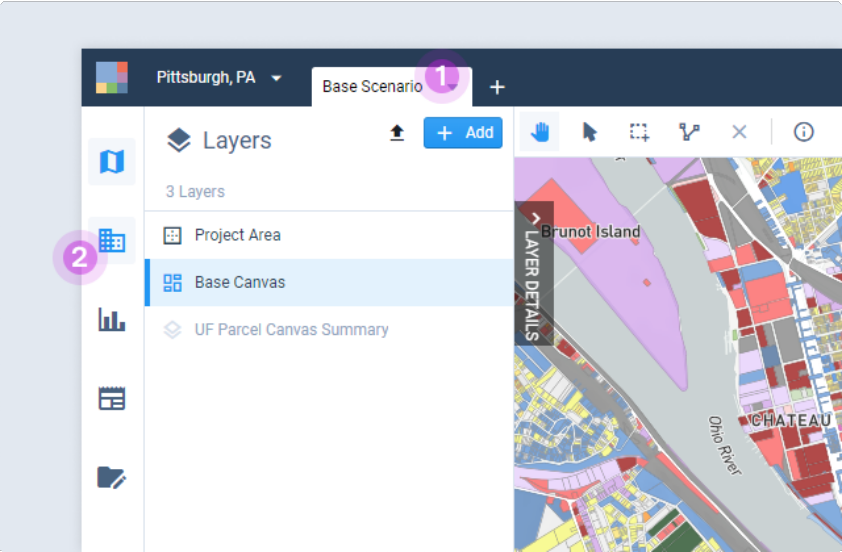
Entering Build mode
Select one or more features on the Base Canvas to reclassify. You can select features using the manual selection tools, or apply filters and/or joins to select features based on particular criteria.
Edit by Type
Click either the Building Types or Place Types button to open a type selection window. The Building Types or Place Types selection window will appear.
Select a type to reclassify with. The menu entry for each type indicates the residential and employment densities. You can click the expand arrow in the upper right corner to see more details; collapse the details to minimize. Select a type and the window will close.
Building Types selection window with expanded details
To maintain the original base values for the feature(s), turn on the Keep original values toggle. If you use this toggle, the features will be reclassified with the new land use type in name only, and all the base values will be kept as is. The residential and employment densities shown in the land use type card will be crossed out to signify that they are not being applied.
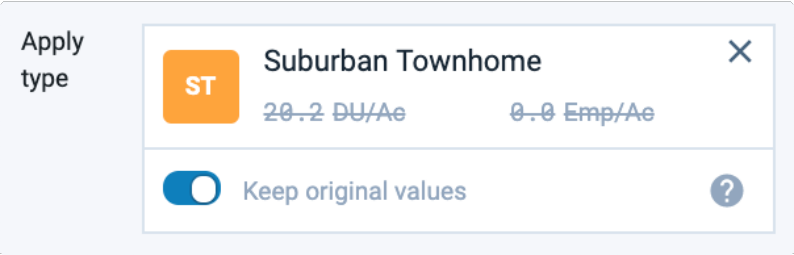
Building Type card with toggle turned on to keep original values
Review the program summary corresponding to your selection. The summary shows the original population, dwelling unit (DU), and employment counts for the base, followed by the counts that will result if the features are reclassified with the selected type. The net differences between the original and new values are also shown. To see dwelling units by type or employment by sector, click the Show details buttons.
If you wish to adjust the residential and employment allocations, skip ahead to step 4 of Edit by Attribute. Otherwise, continue to reclassify your feature(s) as selected.
Click the Reclassify x features button. The feature(s) will be reclassified accordingly once you confirm. The reclassification action will be reflected in all summary charts, data tables, and maps for the Base Canvas and scenarios.
Editing features in the Base Canvas affects all scenarios because growth is allocated relative to the Base Canvas. Each time you reclassify or revert features, Analyst will update all scenarios to reflect new values for the base, increment, and endstate as summarized in reporting charts and represented in the scenario layer. Depending on the number of features you are reverting, the scenario updates may take some time.
Use the Undo
 or Redo
  controls to make sequential changes. Undo and redo apply to your sequence of past actions, independent of the features that are currently selected. If at any point you need to return features to their original base condition, use the Revert to base control described in the following section.
Edit by Attribute
You can edit the features of the Base Canvas with or without changing the original land use type. If the original type classification does reflect existing land use, you can keep it and simply change the residential or employment attributes as needed. Otherwise, start by selecting a land use type that better reflects the existing development, then proceed with changing attributes.
If you want to change the original land use type, click either the Building Types or Place Types button to open a type selection window. The Building Types or Place Types selection window will appear.
Select a type to reclassify with. The menu entry for each type shows its residential and employment densities. Click the expand arrow in the upper right corner to see more details. Select a type, and the window will close.
Review the program summary corresponding to your selection. The summary shows the original population, dwelling unit (DU), and employment counts for the base, followed by the counts that will result if the features are reclassified with the selected type. The net change between the original and new values is also shown. As you change the residential and/or employment area attributes in the steps that follow, the program summary will change. To see dwelling units by type or employment by sector, click the Show details button.
To maintain the original base values for the feature(s), turn on the Keep original values toggle. This option applies only if you selected a land use type. If you turn on this toggle, the base residential and employment values will be kept as is unless you change the allocations in the following steps. The residential and employment densities shown in the land use type card will be crossed out to signify that they are not being applied.
If you leave the toggle off, the features will be reclassified with values according to the selected type unless you change the allocations in the following steps.
If you wish to keep either the original base residential values or the allocation based on the land use type you selected, skip ahead to step 11 to change the employment allocation.
To change the residential allocation, click the Change residential attributes below. A menu of housing types will appear.
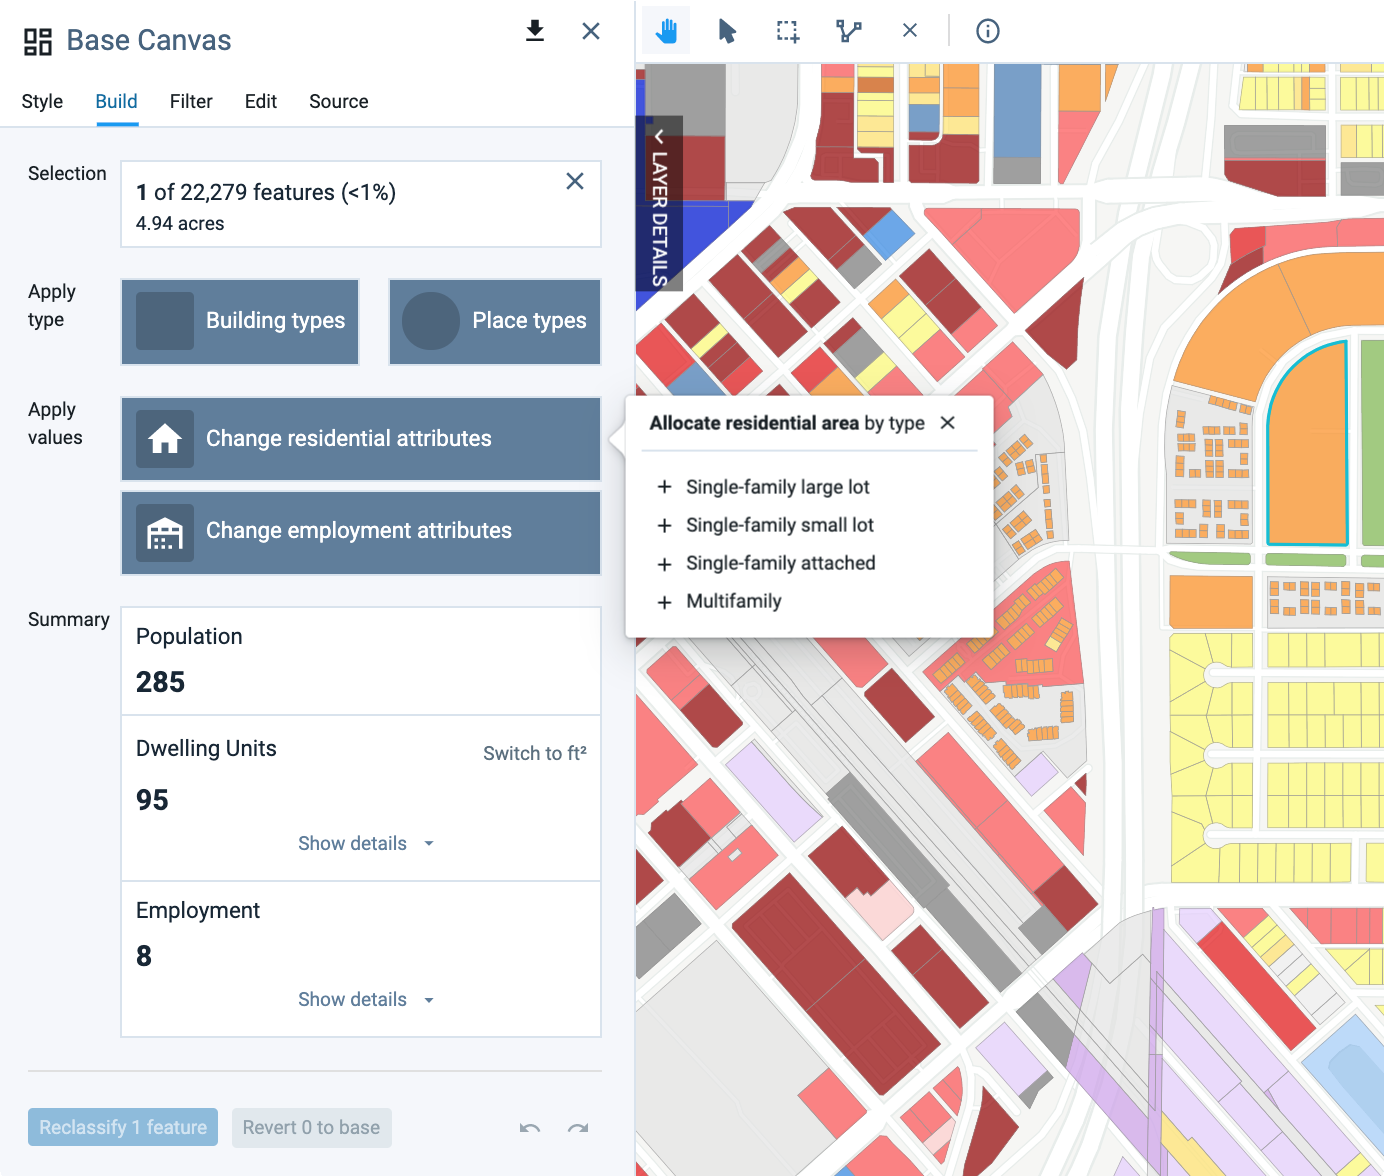
Selecting a housing type to add
Click the + button next to a housing type that you wish to specify. The residential area options will appear.
Allocate residential area by type window
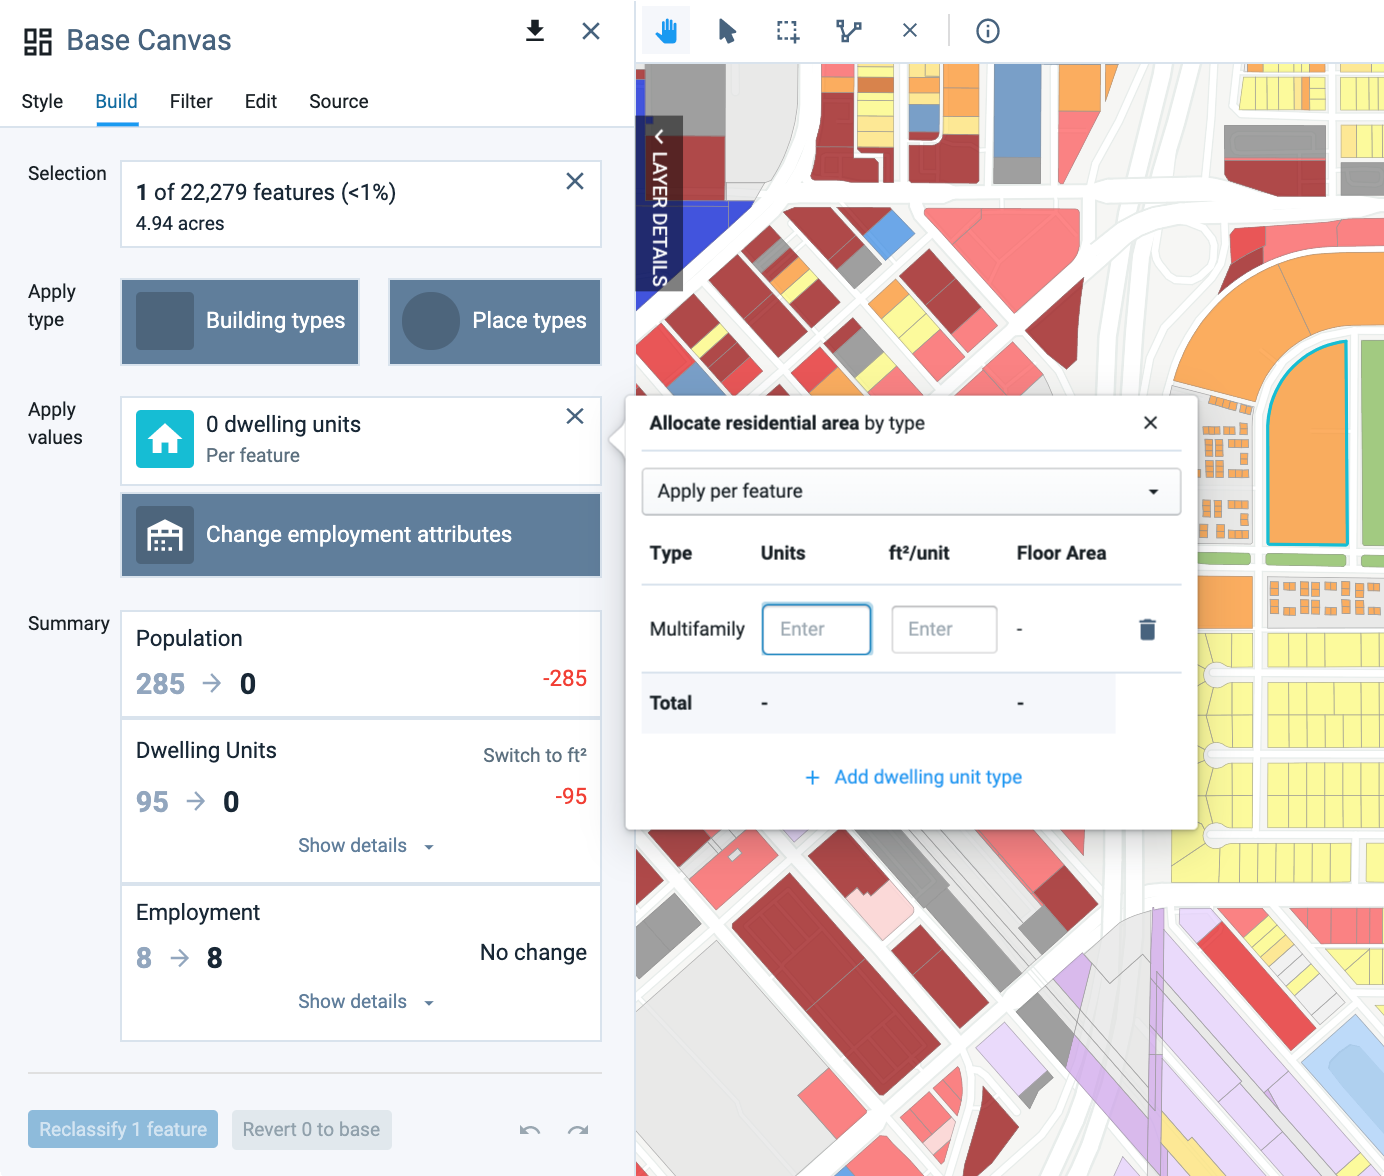
Select Apply per feature or Apply per acre from the drop-down menu. Apply per feature applies the same number of dwelling units and building floor area on each selected feature, regardless of their land area. Apply per acre applies units and floor area by density on the developable land area of each selected feature.
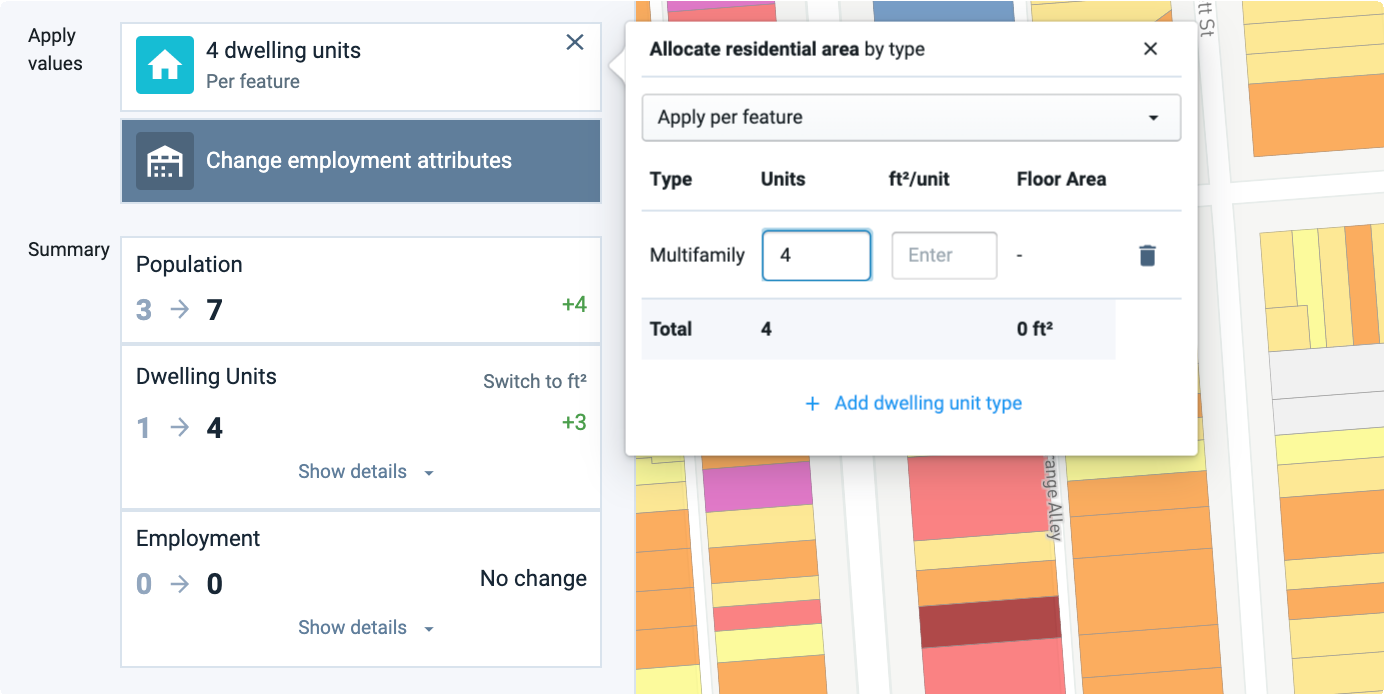
Enter a number of dwelling units and unit size. The total floor area associated with your entries is shown to the right.
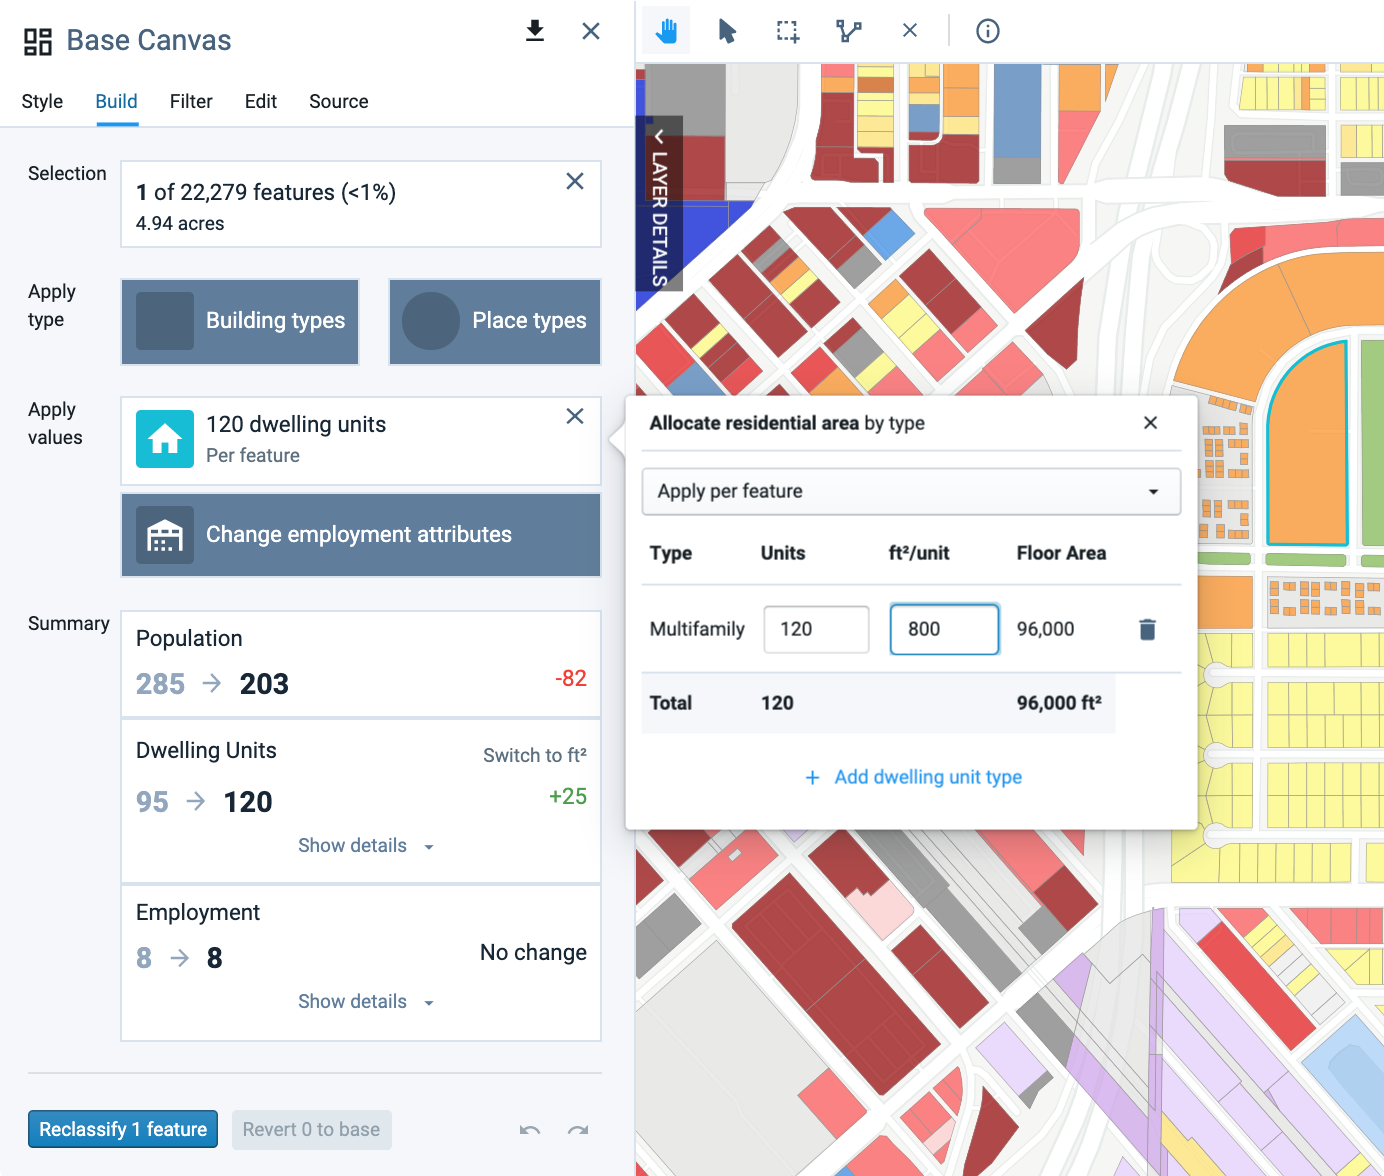
Entering residential attributes
The Summary section will be updated to show the population and dwelling units associated with your entries. The new population counts are based on the household size variables set on the Library Settings page in Manage mode. Population cannot be edited independently of dwelling units for individual features.
Also, notice that the density indicator in the land use type card gets crossed out to indicate that the original residential density for the type no longer applies.
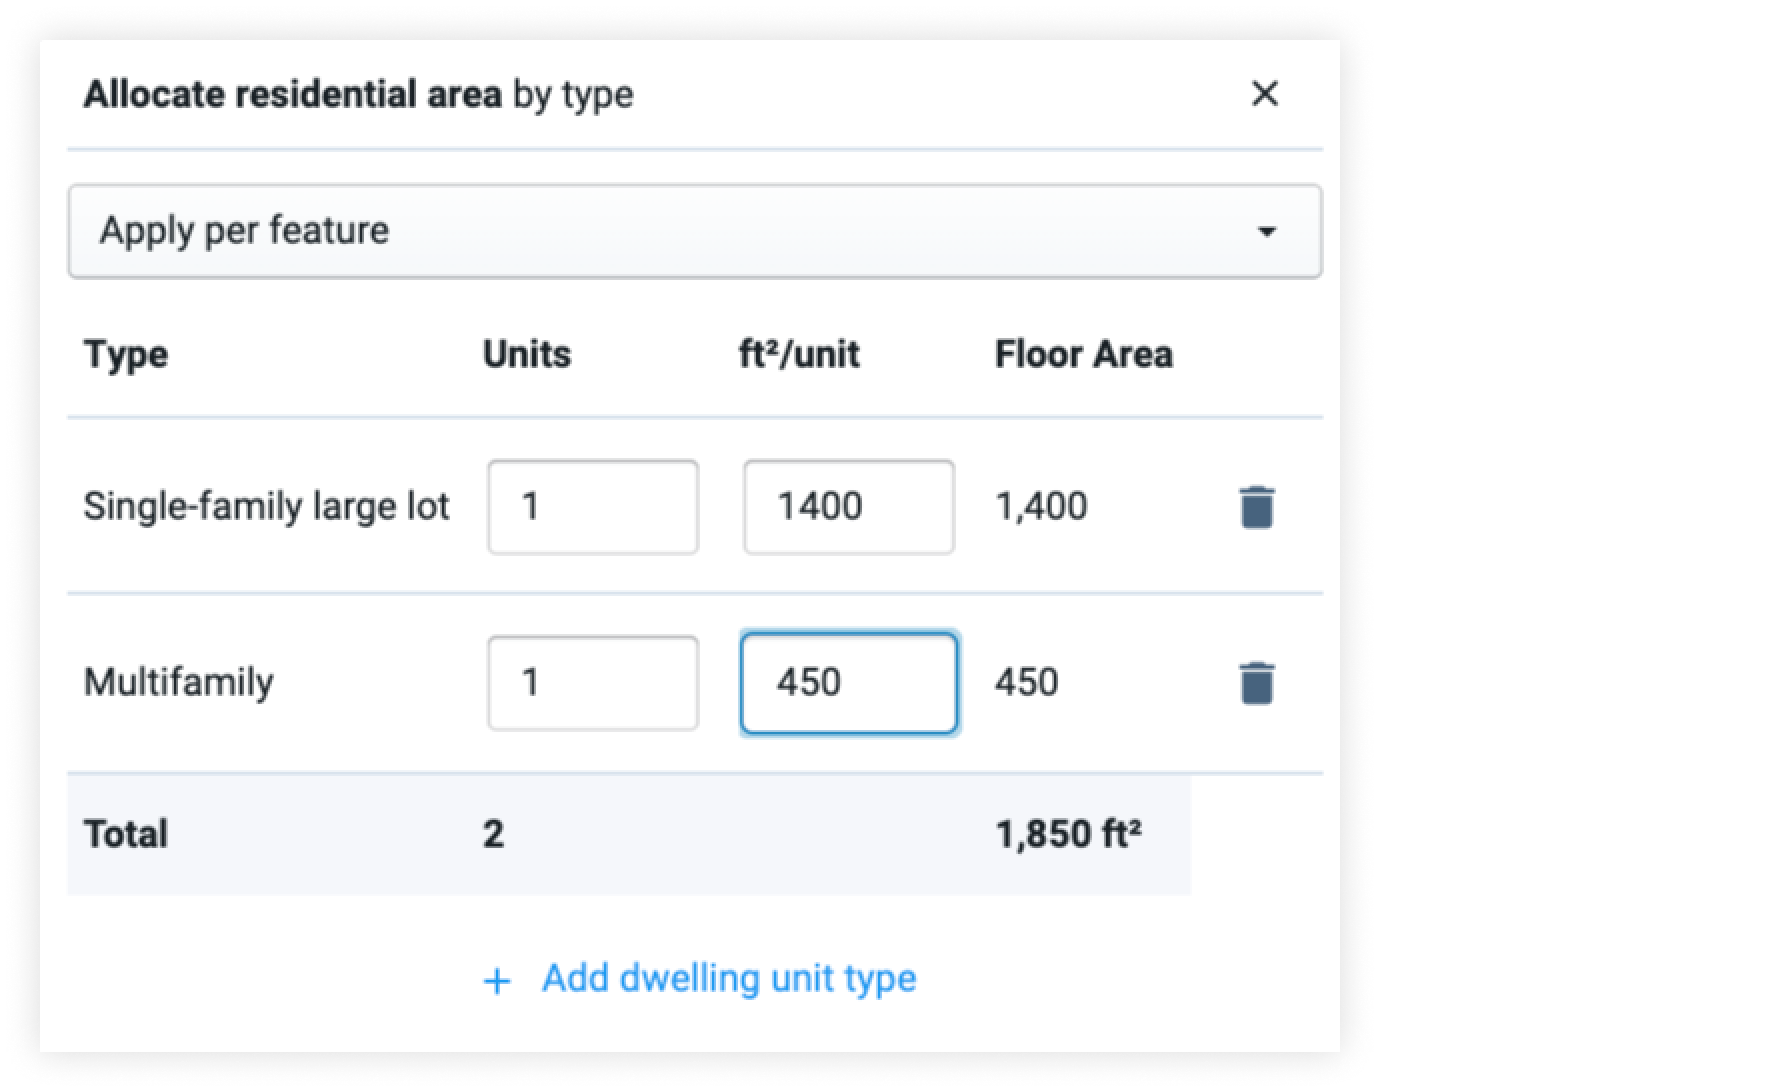
If needed, click then + Add dwelling unit type button to add more entry rows. You can add rows for other types of dwelling units, or for units of the same type with different sizes that exist on the same parcel or block. For example, you can represent a single-family home with an accessory dwelling unit by including a multifamily unit in addition to a single-family unit, as shown in the example below.
Entries are automatically saved; to remove an entry row, click the Delete icon
 .
.Click the X button at the top right of the Allocate residential area by type window to close it.
To change the employment allocation, click the Change employment attributes button. A menu of employment sectors will appear.
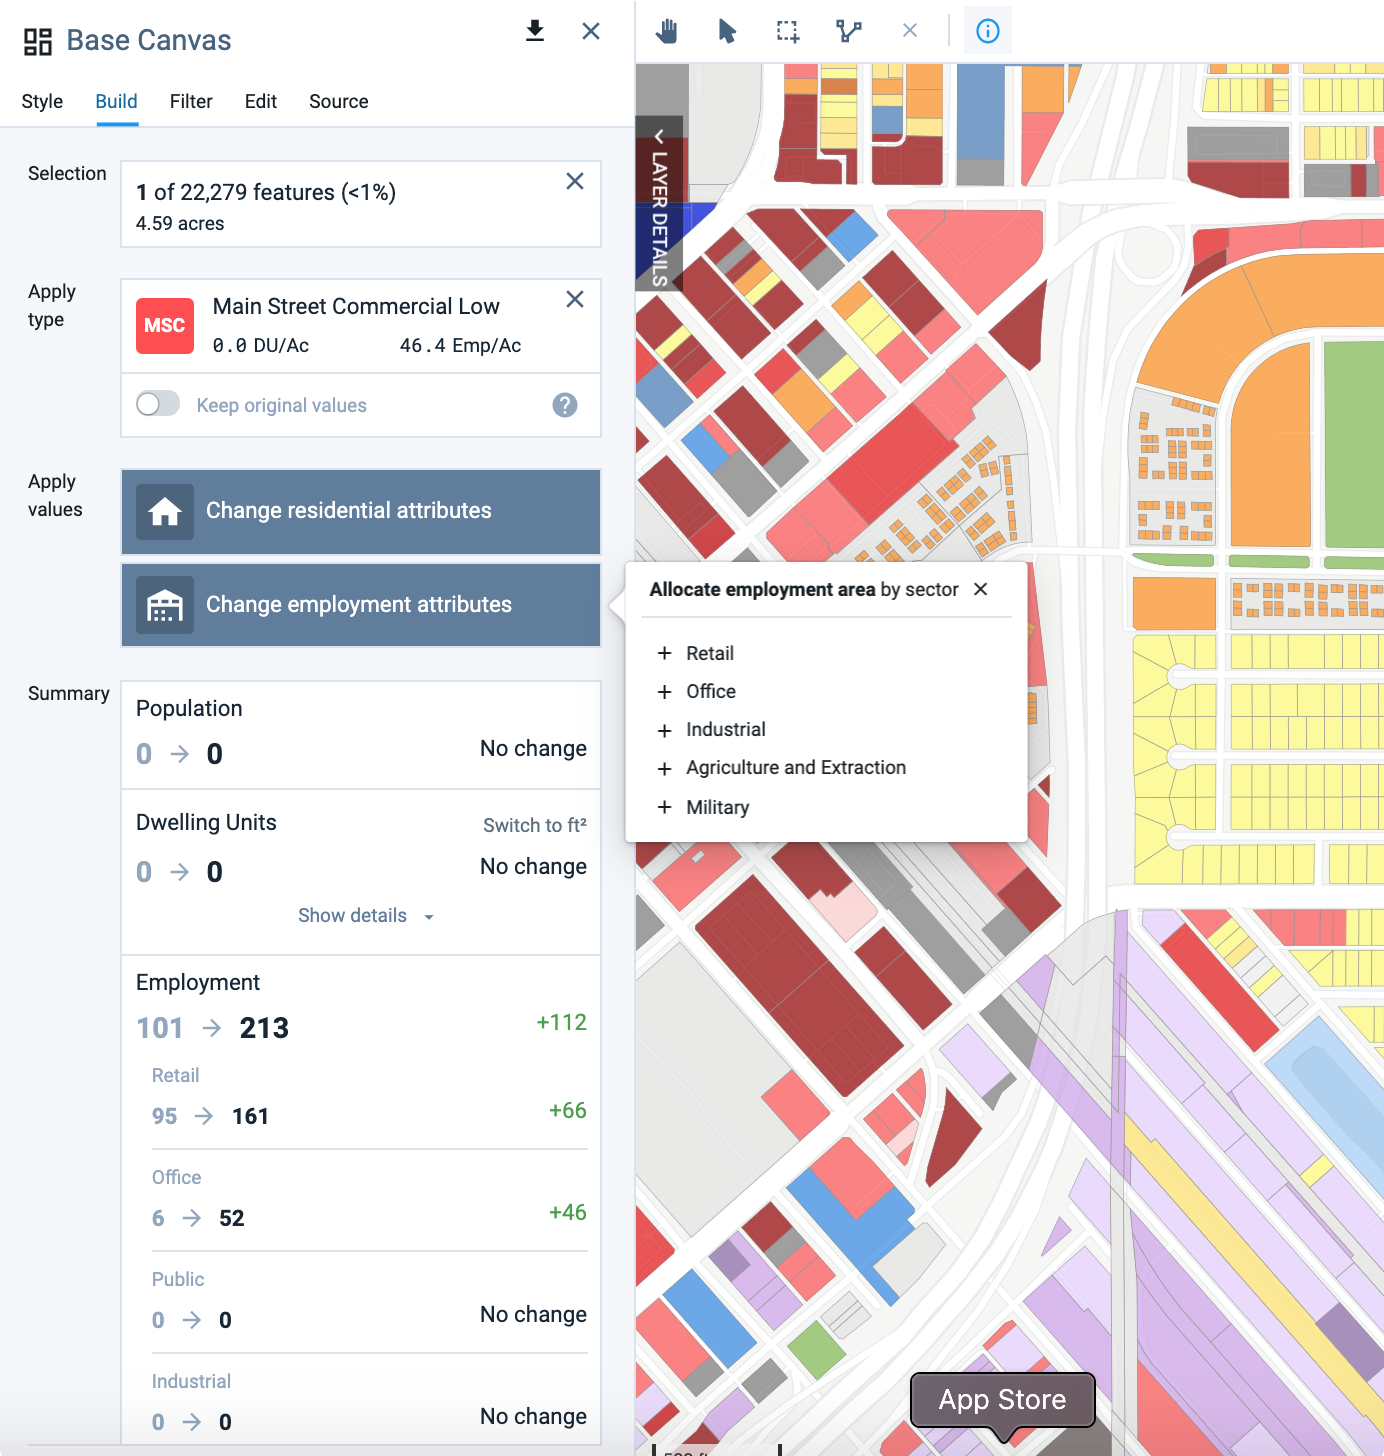
Selecting an employment type to add
Select an employment sector to be included. The Allocate employment area by sector options will appear.
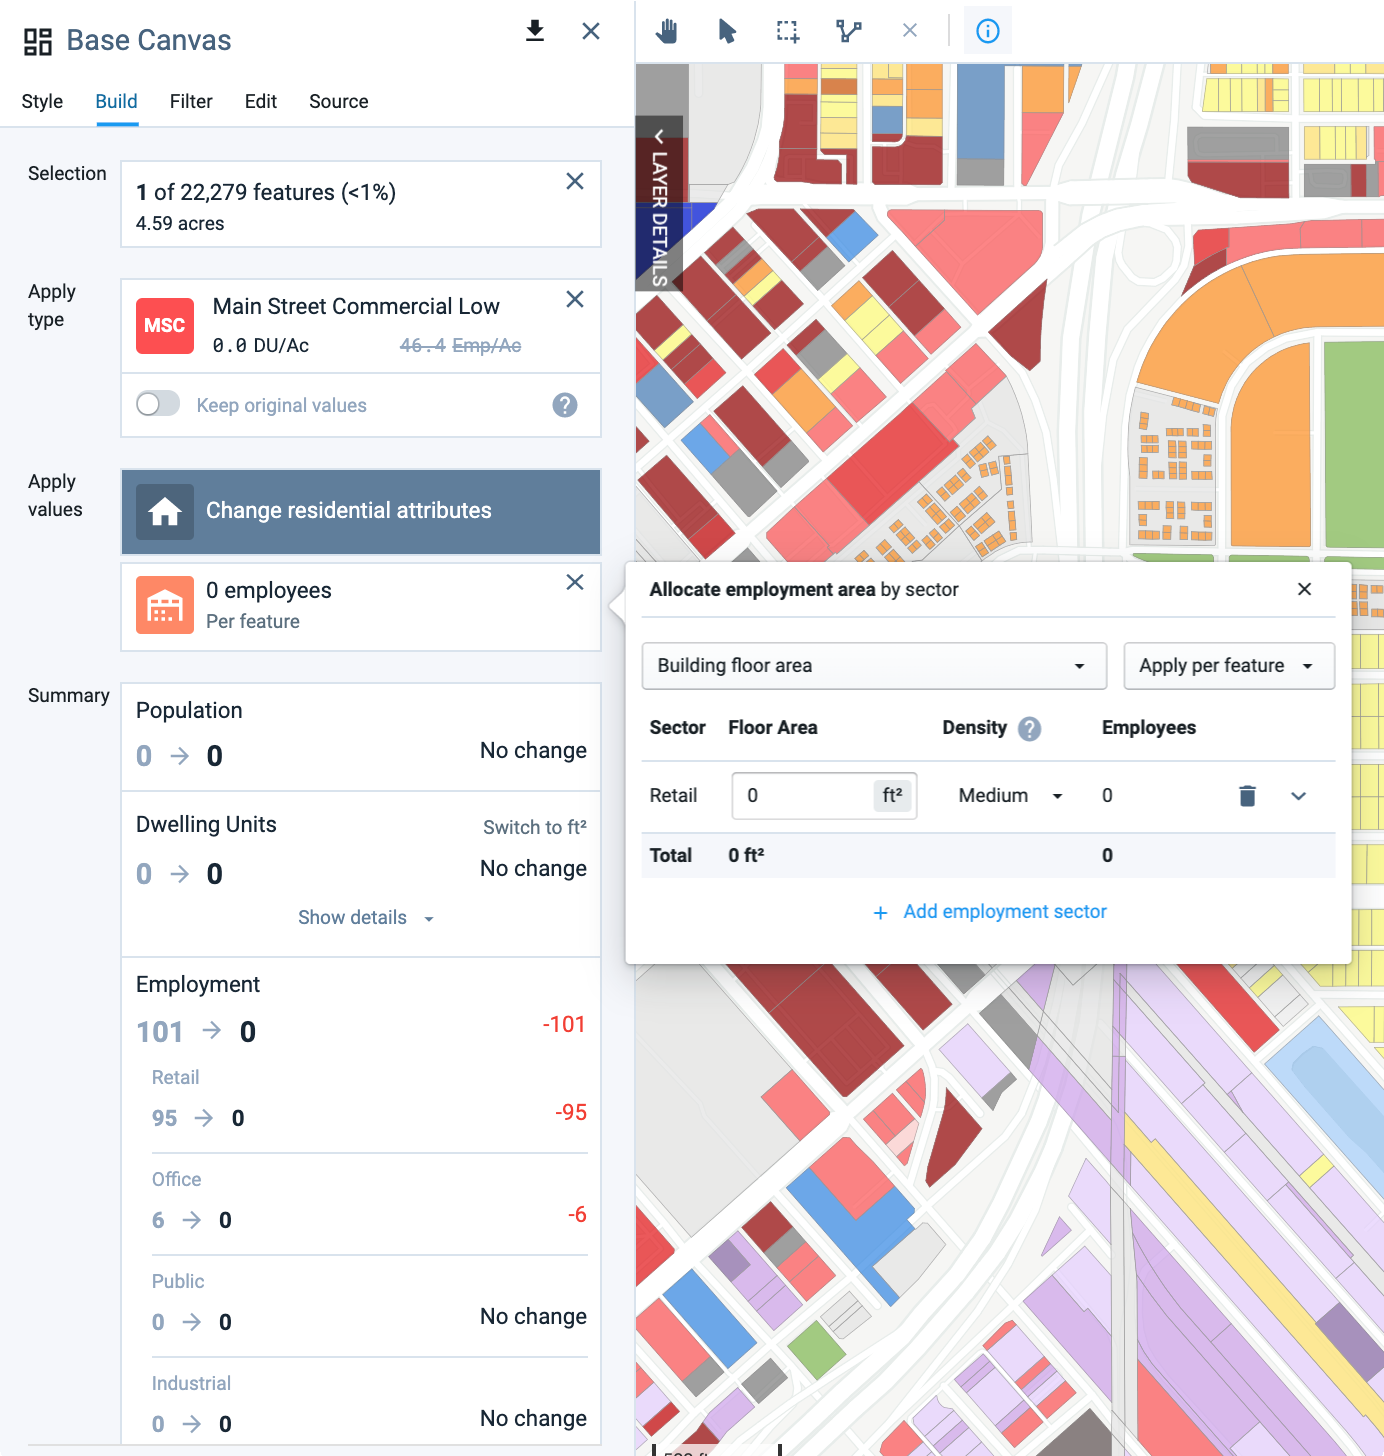
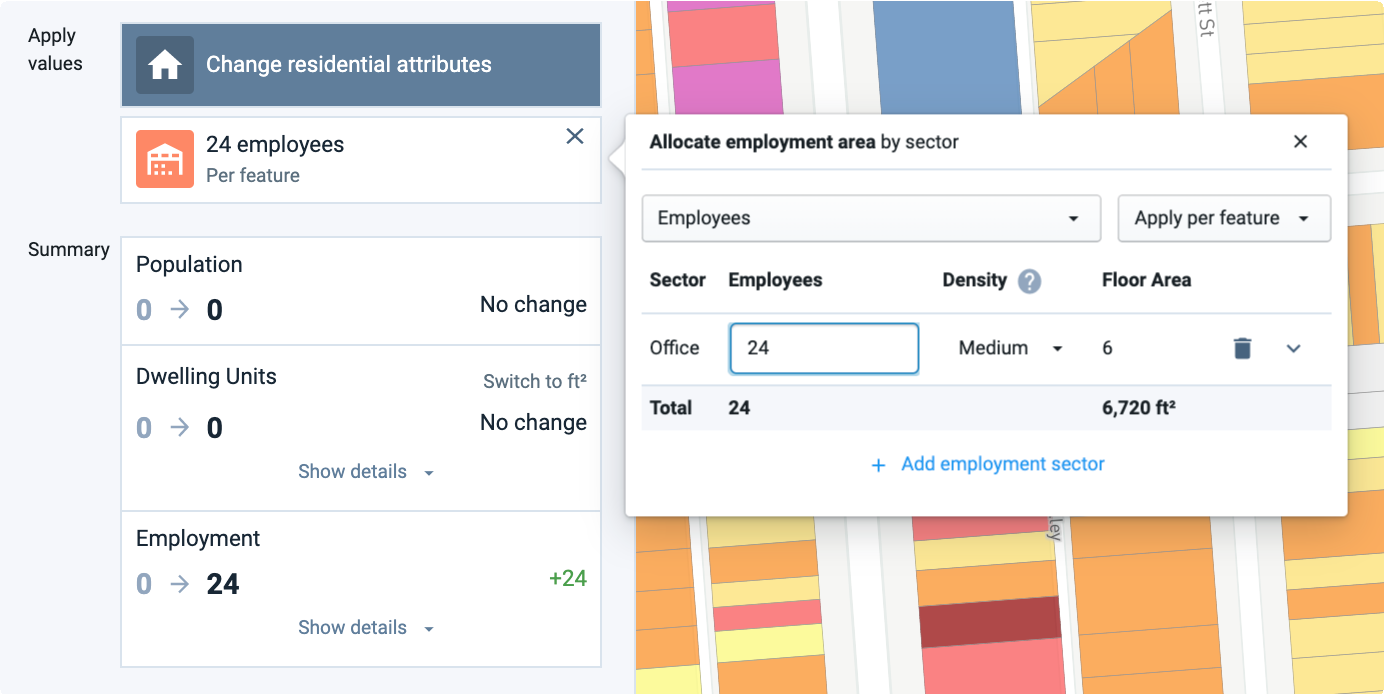
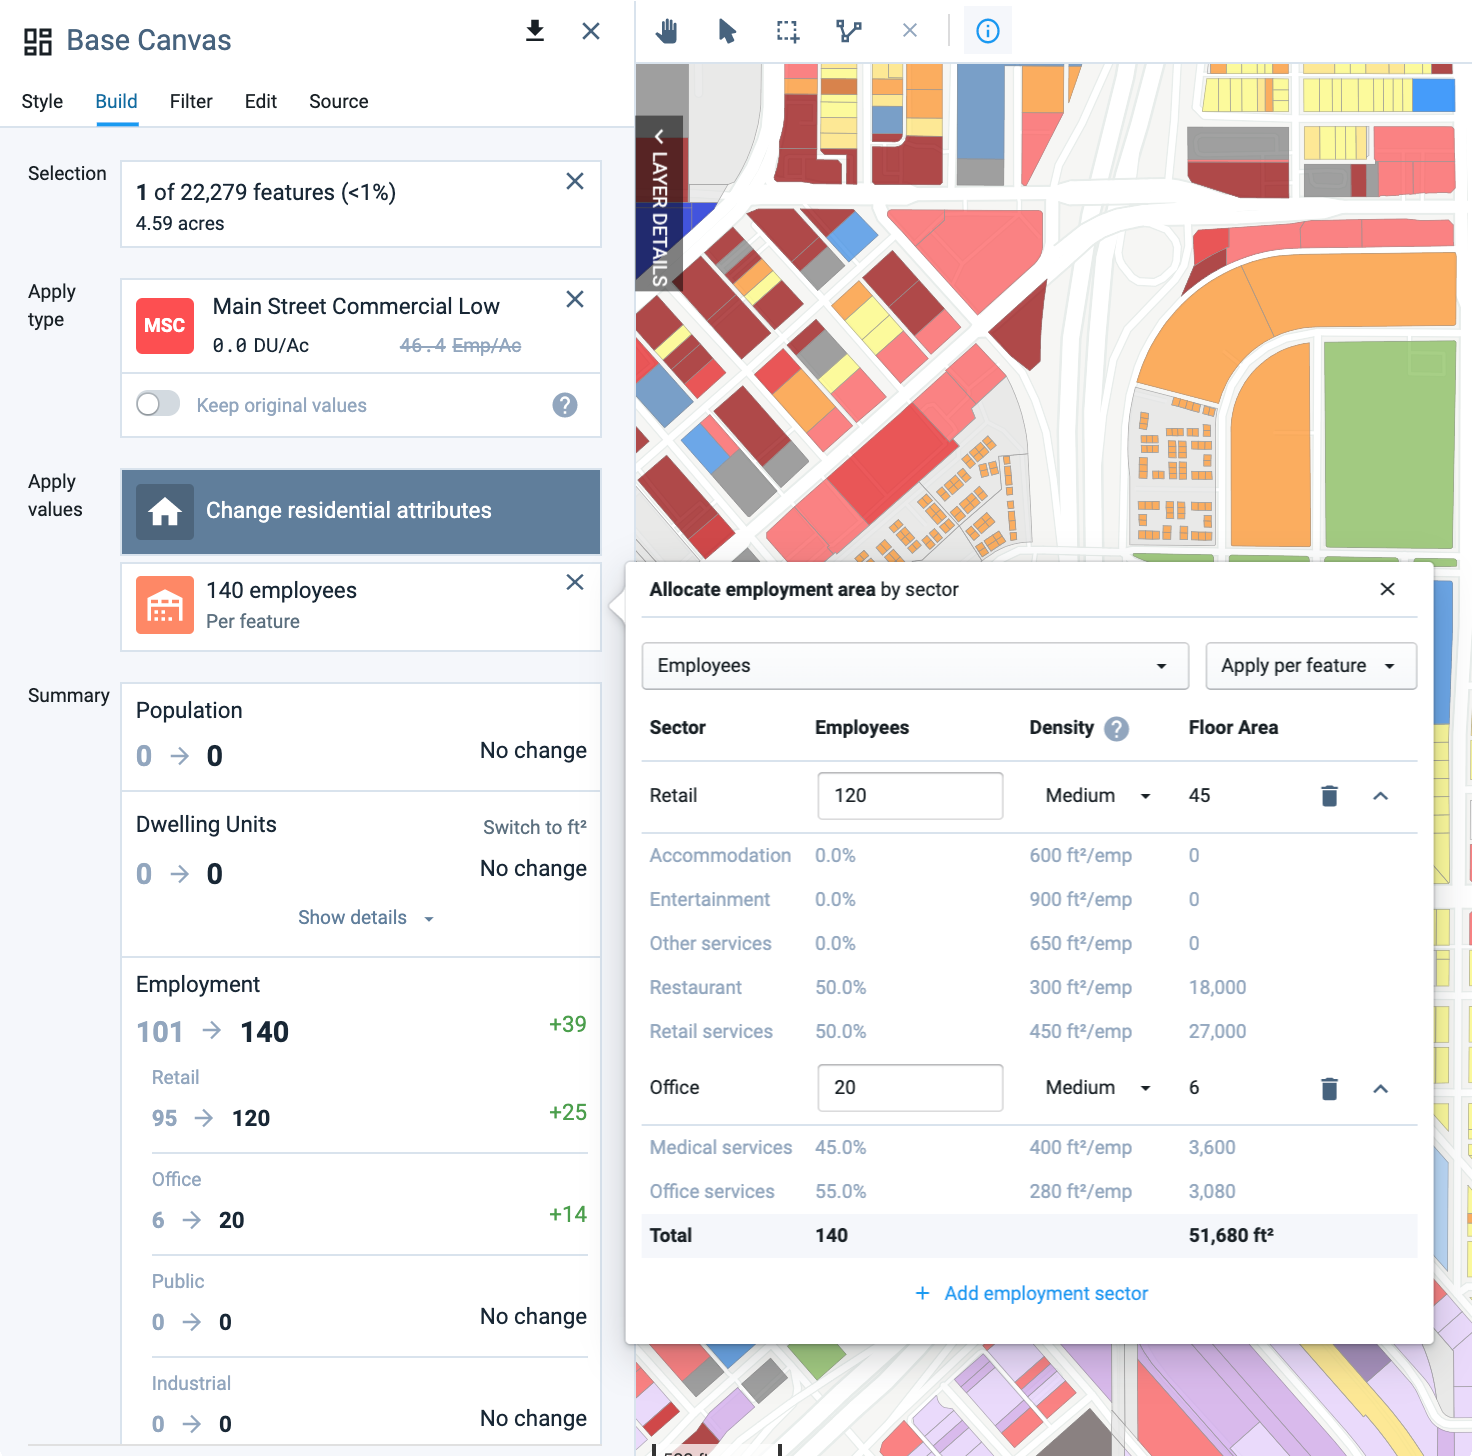
Allocate employment area by sector window
Select Building floor area or Employees from the drop-down menu. You can enter employment information based on gross building floor area, or by numbers of employees.
Select Apply per feature or Apply per acre from the drop-down menu. “Apply per feature” allocates the same numbers of employees and building floor area to each selected feature, regardless of its land area. “Apply per acre” allocates employees and building area by density on the developable land area of each selected feature.
Enter a number of employees or building floor area for the sector. If you entered a number of employees, the corresponding building floor area will be calculated, or vice versa if you entered a building floor area. The relationship between employees by sector and floor area is determined by an underlying distribution of employees by subsector, and variable assumptions for gross floor area per employee.
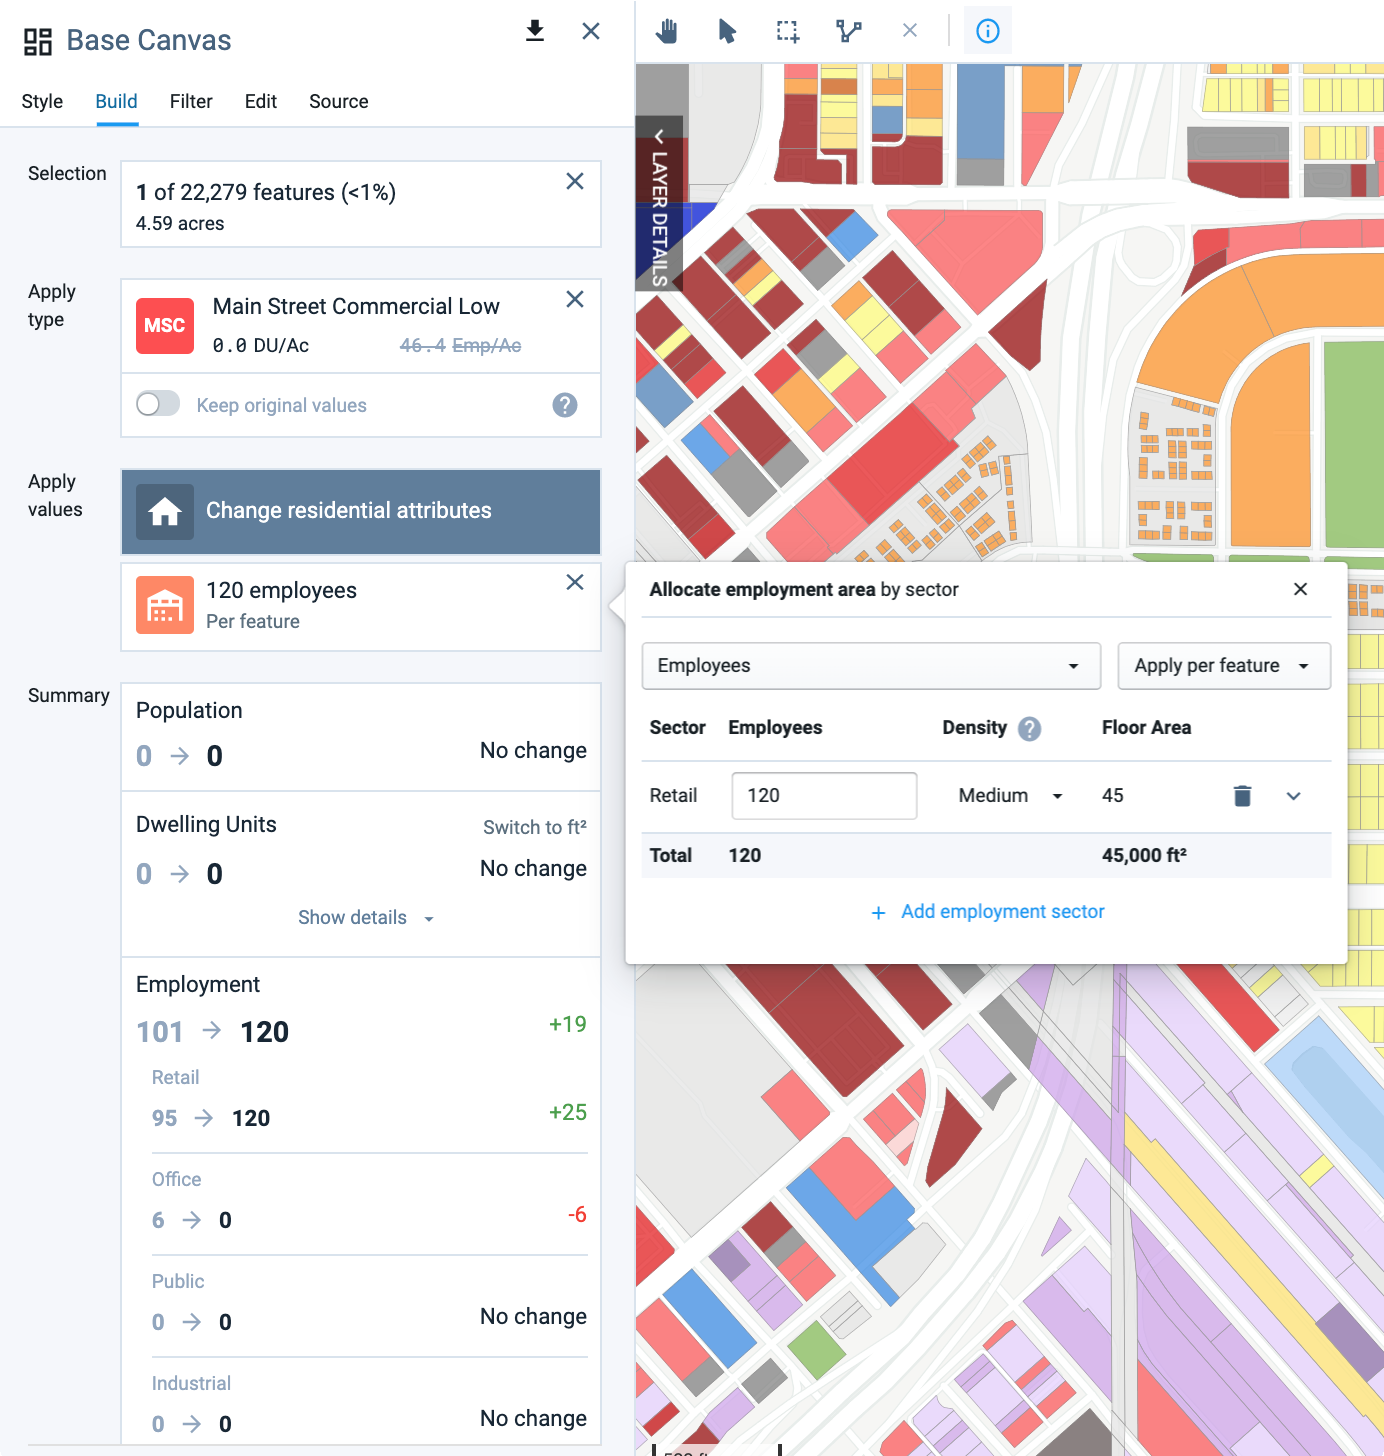
Entering employment attributes
Select a building density category from the Density drop-down menu. The Low, Medium, and High building density categories are the same as those used in creating Components. Each category is associated with a different set of variables for floor area per employee, by subsector. These variables are set on the Library Settings page in Manage mode.
Click the Expand icon
 at the right end of the entry row. The distribution of employees and building floor area by subsector will be shown, along with variable values for square feet per employee.
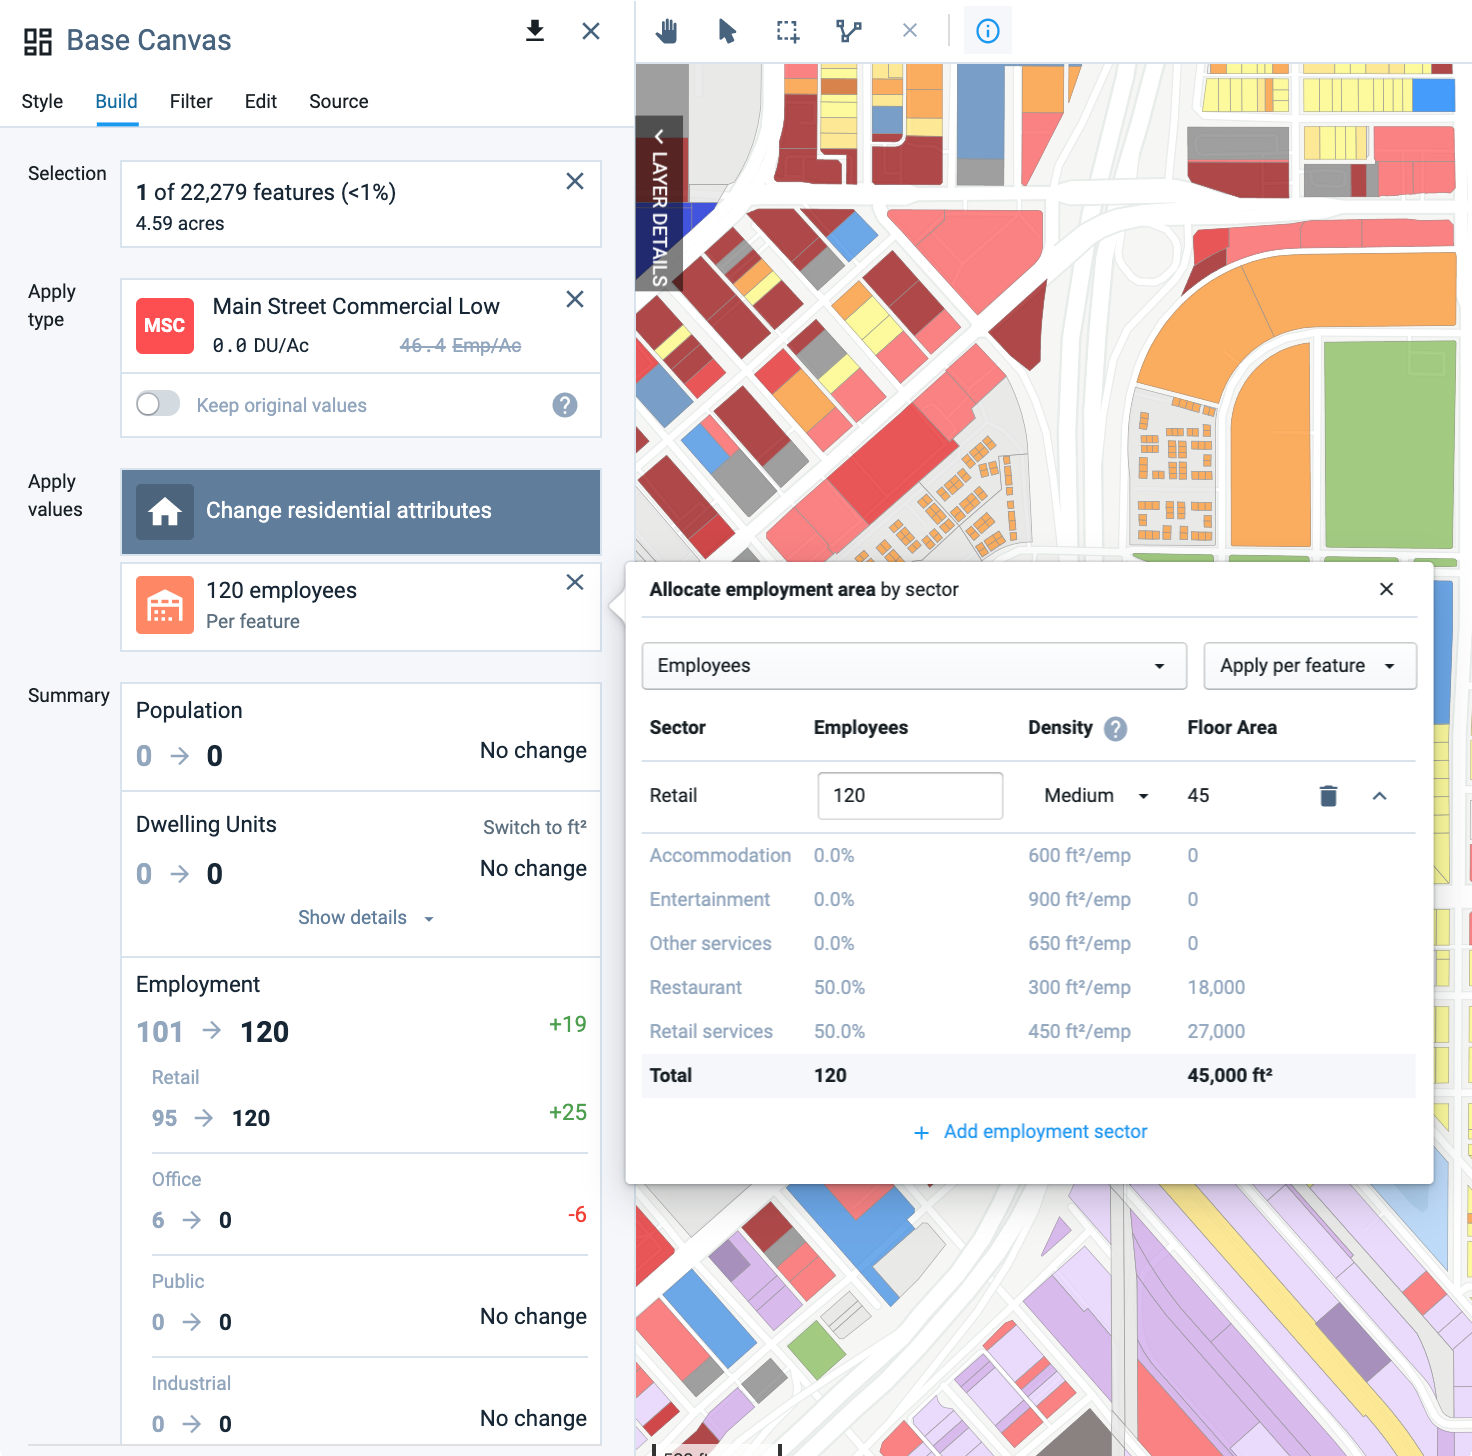
Viewing employment attributes by subsector
The distribution of employees by subsector is based on the default values set on the Library Settings page in Manage mode. While you cannot change the subsector employment distribution through the painting dialog, you can set the defaults in Library Settings prior to painting to populate the dialog with the intended values. The subsector distributions are static defaults, not variables, so changing them will not affect other painted features or land use types.
From the Library Settings page, you can also set the variables for gross floor area per employee. Variables are dynamic, so any changes to them affect all associated land use types, painting actions, and edits to the Base Canvas that involve changing employment values. The variables do not apply, however, to the base employment or building area values of unedited or unpainted features. See Use Library Settings for details on setting the variable values.
Once you specify new employment information, the Summary section will be updated to show the employment and building floor area associated with your entries. Also notice that the density indicator in the land use type card gets crossed out to indicate that the original employment density for the land use type no longer applies.
Click the + Add employment sector button to add more entry rows. Continue to add rows for employment in other sectors, entering attributes as you did for the first selected sector. Entries are automatically saved; to remove an entry row, click the Delete icon
. 
Entering attributes for multiple employment sectors
Click the X button at the top right of the Allocate employment area by type window to close it.
Review the program summary corresponding to your attribute entries. The summary contains population, dwelling unit (DU), and employment counts for the base, followed by the counts to be applied. The net growth or loss between the base and future scenario allocation is also shown. To see dwelling units by type or employment by sector, click the Show details buttons.
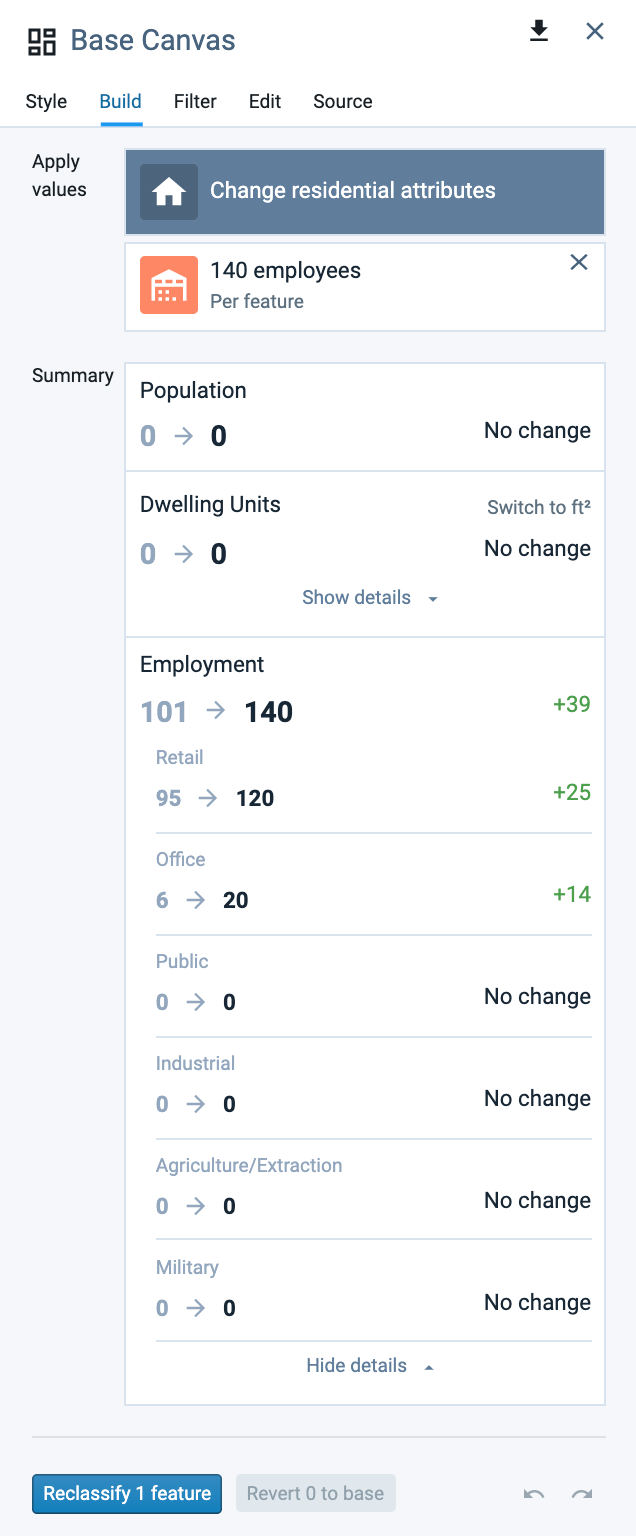
Program summary of attributes to be applied
To reclassify the feature(s) as specified, click the Reclassify x features button. The feature(s) will be reclassified once you confirm. The reclassification action will be reflected in the all summary charts, data tables, and maps for the Base Canvas and scenarios.
Again, editing features in the Base Canvas affects all scenarios because growth is allocated relative to the Base Canvas. Each time you reclassify or revert features, Analyst will update all scenarios to reflect new values for the base, increment, and endstate as summarized in reporting charts and represented in the scenario layer. Depending on the number of features you are reverting, the scenario updates may take some time.
Click the Undo
or Redo controls to make sequential changes. Undo and redo apply to your sequence of past actions, independent of the features that are currently selected. If at any point you need to return features to their original base condition, use the Revert to base control described in the following section.
Revert Features to the Base Condition
Reverting returns features to their original base condition, effectively clearing any past reclassifications for selections of features. Undo and redo, by contrast, are applied to your sequence of past actions independent of the features that are currently selected.
To revert features:
Select any features on the map that you want to revert to the original base values. The Revert x to base button will indicate the x number of features in your selection that have been reclassified in any prior actions.
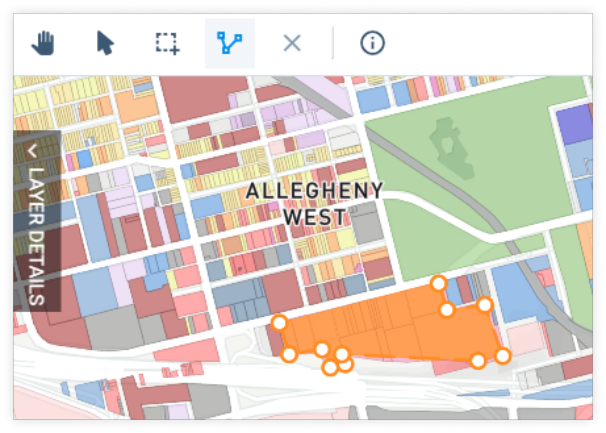
Use the polygon tool to make a selection of 18 features
Click Revert x to base. This will reset the features to their original base condition, including land use classifications and base values. Any features that have not been reclassified previously will be unaffected by the revert action.
When complete, the effects of reverting features will be reflected in the Base Canvas Summary Charts, as well as any scenarios.
Again, editing features in the Base Canvas affects all scenarios because growth is allocated relative to the Base Canvas. Each time you reclassify or revert features, Analyst will update all scenarios to reflect new values for the base, increment, and end state as summarized in reporting charts and represented in the scenario layer. Depending on the number of features you are reverting, the scenario updates may take some time.
Editing the Base Canvas also renders any prior analysis runs as out of date. You will need to re-run analysis after reverting features. The status as to whether results are current or outdated is indicated for each module in Analyze and Report modes.
Base Canvas Modification Flags
Analyst keeps track of what canvas features have been edited, painted, or gridded with a series of column values in the base and scenario canvases. These "modification flags" allow you to identify, at any point in base editing or scenario development, features that have been painted or gridded. The columns appear at the end of the data table and contain "Yes" or "No" values depending on whether individual features have been edited, painted, or gridded. The modification flags include:
Modification flag | Description |
|---|---|
Modified from Original | Indicates whether a feature has been painted or gridded in any way. |
Modified: Gridded | Indicates whether a feature has been created using a gridding operation. |
Modified: Type Paint | Indicates whether a feature has been painted to have a new Building or Place Type name. This can apply whether the feature has been painted by type or attribute, and independent of whether the base residential and employment values have been modified. |
Modified: Employment Attributes | Indicates whether a feature has been painted by attribute to set employment values, including jobs and non-residential building area. |
Modified; Residential Attributes | Indicates whether a feature has been painted by attribute to set residential values, including dwelling units and residential building area. |
Values for modification flags are set to "Yes" when you edit or grid features according to flag criteria. If you undo an editing or gridding action, or revert a feature to its original base condition, the corresponding flag(s) will be reset to "No."
With the modification flags, you can filter your canvas as you would for other columns and values to select edited or gridded features.
Note
The modification flag columns replace the "Painted" column previously used to indicate whether a feature has been painted.