Base Canvas Methodology
The UrbanFootprint Base Canvas is a foundational component of the UrbanFootprint platform, providing essential land use, building, and socio-demographic statistics across 160 million U.S. land parcels. Informed by more than 30 years of urban planning and data science expertise, the Base Canvas integrates and harmonizes dozens of commercial and public data sources through advanced geospatial processing and machine learning. It standardizes diverse land use classifications across the country, and includes imputed population, household, and employment estimates for each parcel, enriching the data and enabling more consistent and nuanced analysis in any location. The Base Canvas delivers unparalleled granularity and accuracy and is refreshed on a regular cadence.
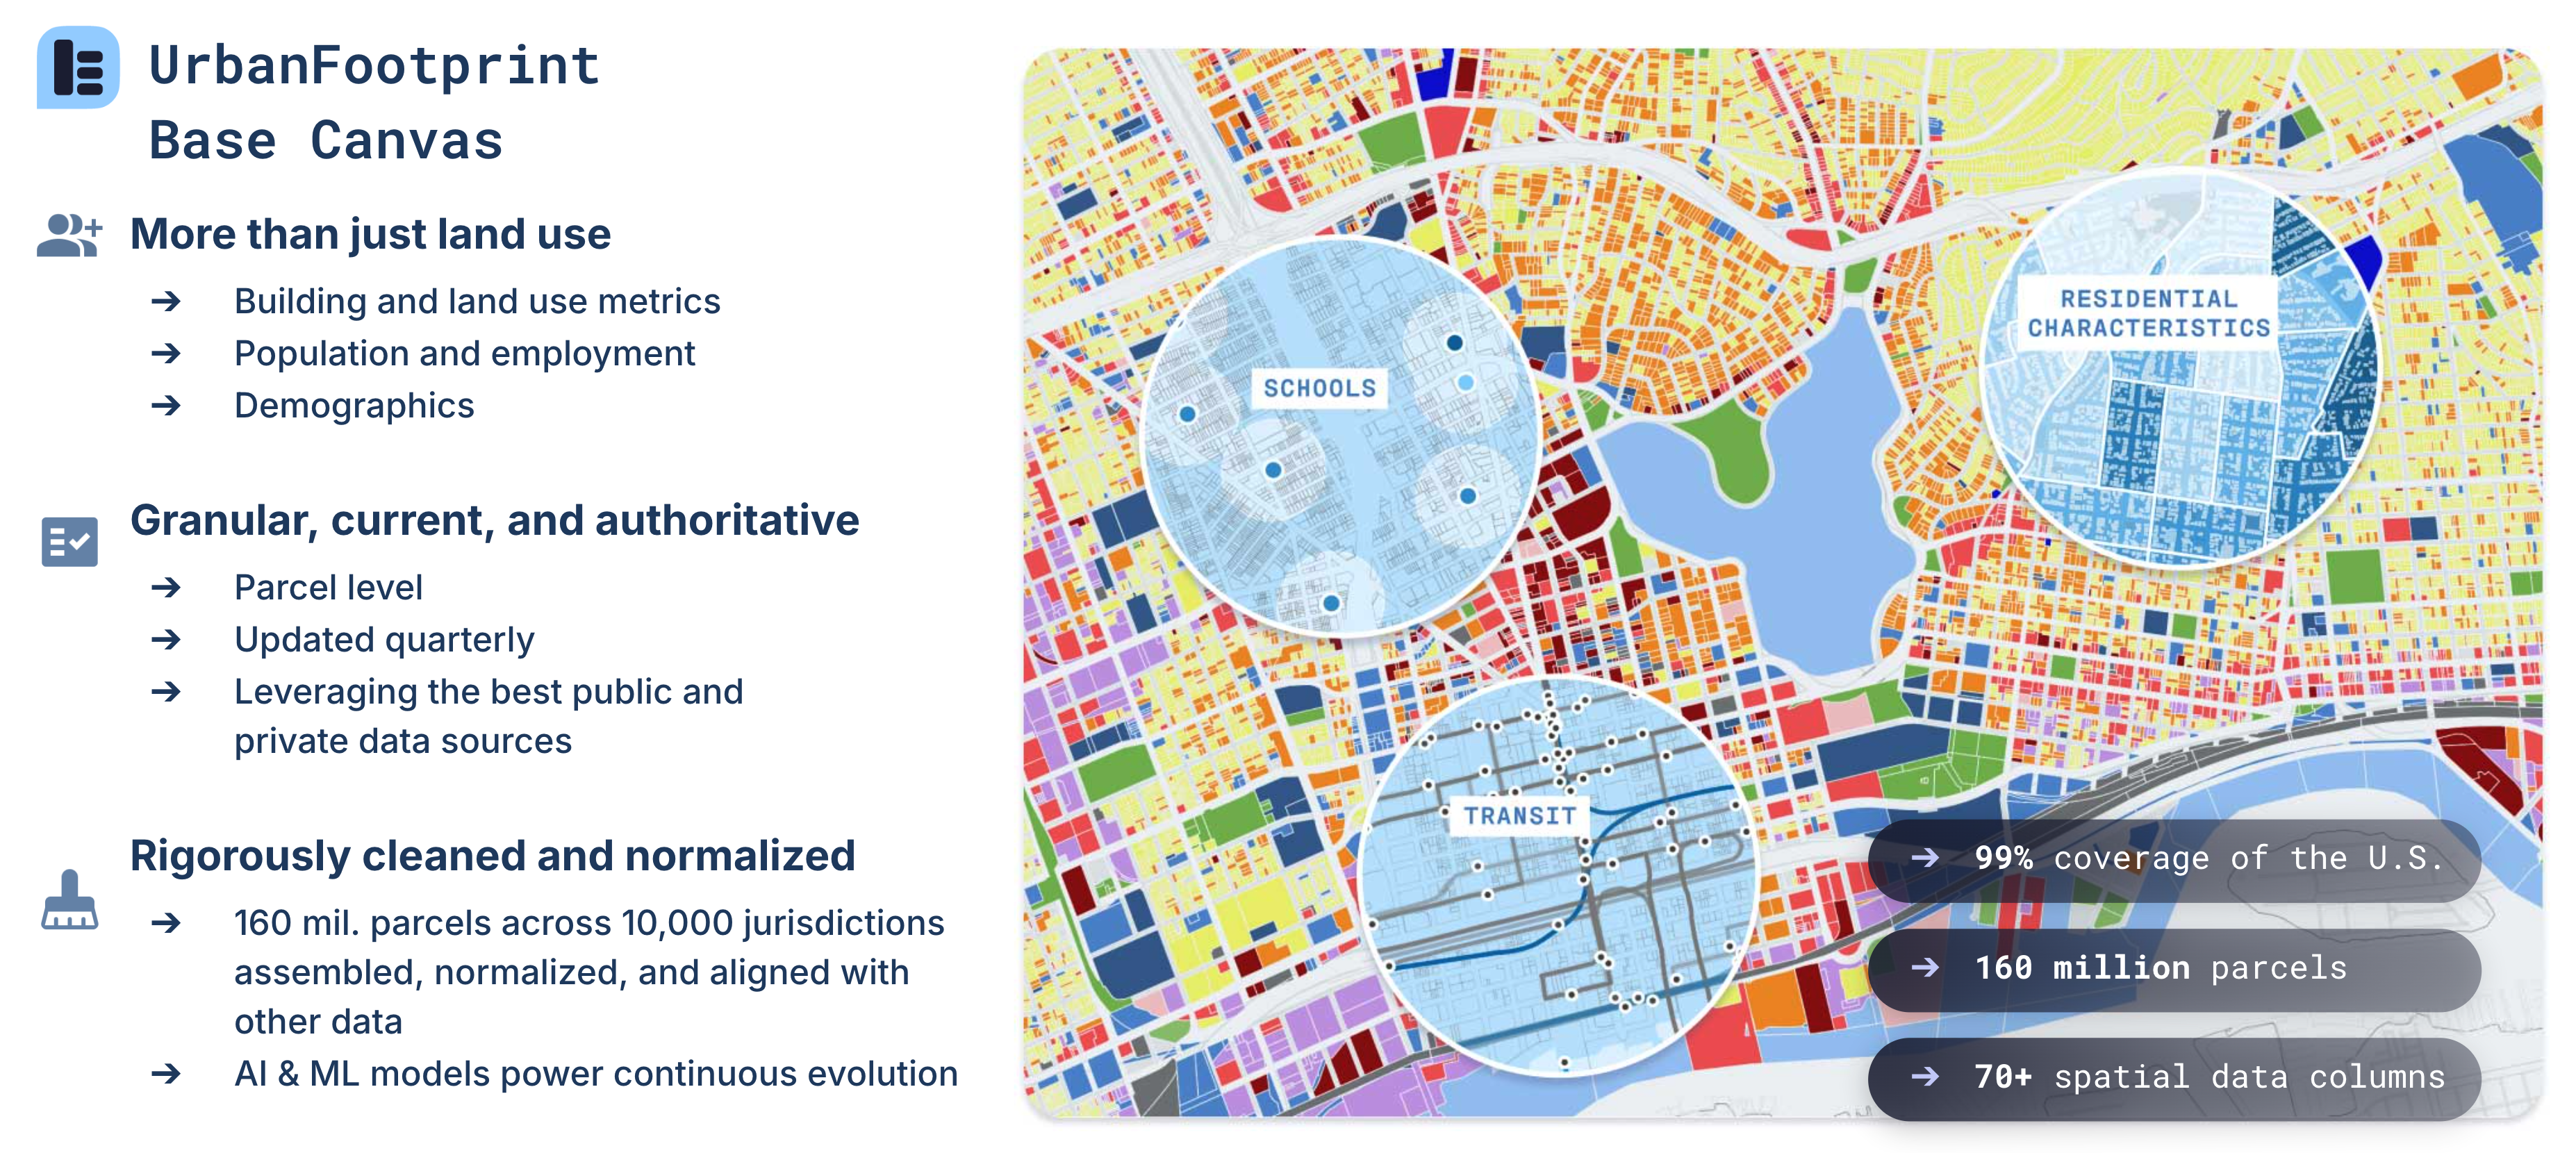
The UrbanFootprint Base Canvas is a nationwide dataset that provides detailed land use, building, and market information for every parcel in the United States, forming the foundation for analysis and understanding of the built environment.
Data Sources and Updates
The Base Canvas creation process incorporates data from a variety of sources, including:
Census data, used to allocate population, households, dwelling units, and employment.
Parcel provider data, used to identify land uses and populate dwelling units, employment, and building attributes where available.
Point-of-interest data from supplemental sources, used for further identification of land uses.
Road data, used for calculating intersection density.
The methodology sections describe in detail how the source datasets are used. Note that the default Base Canvas is updated quarterly to incorporate the latest parcel data releases. October 2025
Methodology Overview
Base Canvas creation involves many steps of data processing and logic application. The process can be summarized into the following stages.
Standardizing geometries, which ensures that parcel features are unique and do not overlap.
Translating land use codes from the parcel data to Analyst land use designations, and using additional data sources to identify specific land uses
Allocating or assigning values for the attributes of the Base Canvas, including:
Dwelling units, using land use information, census information, and parcel data.
Population and Households, using census rates.
Employment by Category, using land use information, census information, and parcel data
Building Area by Type, using parcel data and assumptions.
Parcel Area by Land Use according to land use criteria.
Analyst Land Use Typing, based on land use, density, and location data for specific uses.
Intersection density, calculated at the census block level.
Land Development Category, derived at the census block level.
Irrigated area, estimated based on Building Type assumptions.
The key steps and data used in each stage are described in the sections that follow.
Standardizing Geometries
The Base Canvas is comprised of unique, non-overlapping feature geometries. Base Canvas relies on LightBox SmartFabric, the industry’s most comprehensive and current nationwide parcel dataset which is updated quarterly from sources including tax assessors and county recorder offices.
Before the parcel data can be used, it needs to be cleaned to resolve any geometry issues. Common issues include duplicate IDs, stacked geometries, nested geometries, and overlapping geometries. As a post-process, very tiny geometries (less than 1 square meter) are dropped.
Duplicate IDs
In the rare cases where there are duplicate parcel IDs, the first parcel is retained and the duplicates are dropped. A verification step further ensures that duplicate parcel IDs do not exist in the dataset.
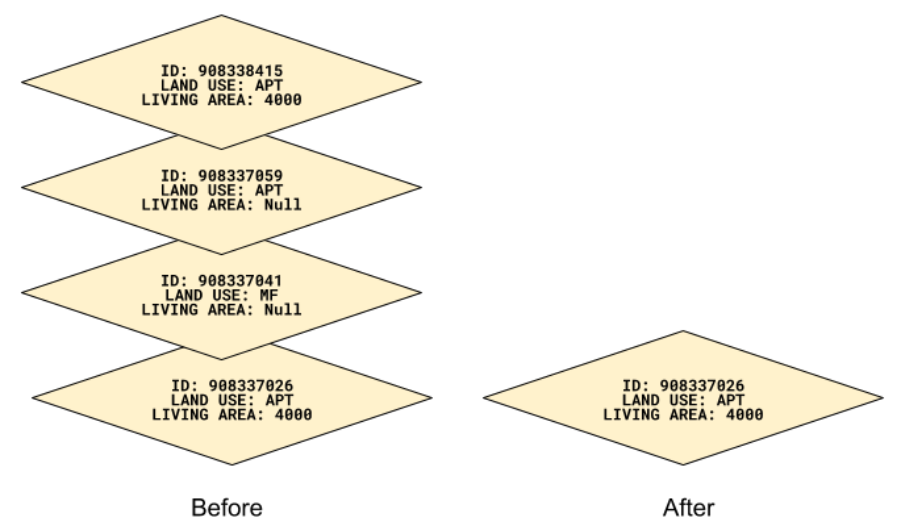
Exact and Near-Duplicate Geometries
In some cases, such as parcels for condominiums, multiple geometries that are exactly the same or nearly the same are stacked on top of each other. While exact geometry stacks are already identified in LightBox SmartFabric, nearly identical stacks are not. These geometries are dissolved into a single flat geometry. For non-numeric data, the attributes of the parcel with the lowest parcel ID are retained. For most numeric data, the maximum across all parcel attributes is retained. However, due to the structure of the underlying data, property value data is generally summed across all parcels with a few notable exceptions in select counties where the maximum method is used.
 |
Nested Geometries
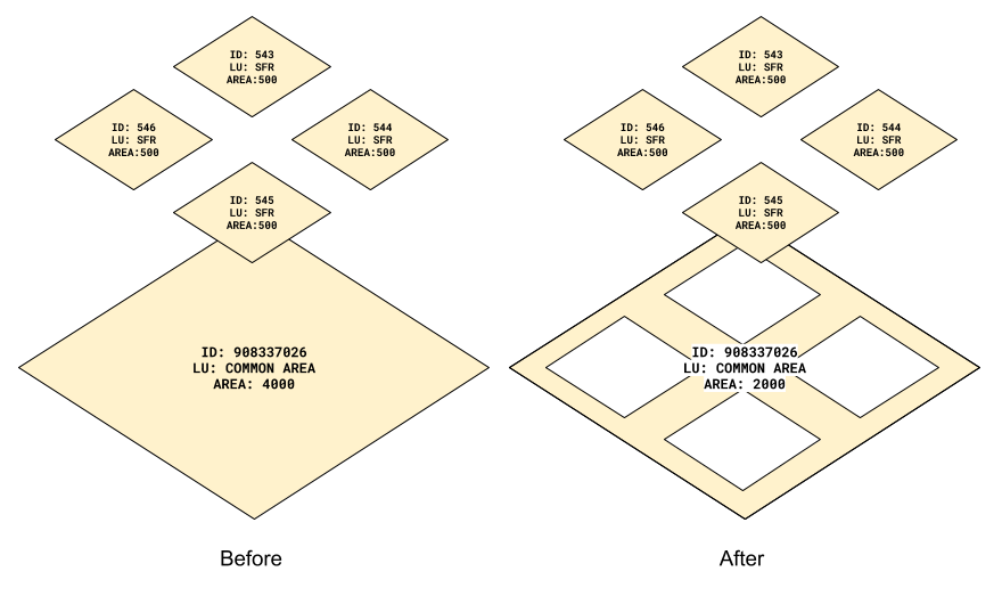
Nested geometries sometimes occur in master-planned developments or subdivided residential neighborhoods where the outdoor area is owned by one entity, but each unit is privately owned. In these cases, a parent geometry (e.g., a planned unit development parcel) can have several child geometries (e.g., the planned units) as individual parcels completely contained by the larger parent geometry. For scenario development to correctly account for the total land area in these cases, it is essential that no land is double-counted, meaning that the parent geometry does not include the area of the child parcels. To fix this, the child geometries are cut out of the parent geometry. The result is that the parent geometry encompasses the shared common area, while each child parcel contains the information for the particular unit.
 |
Overlapping Geometries
Finally, there are parcels that overlap but are not entirely contained in one or the other. This happens most often with condominiums where the floor plans of each unit differ across floors. For this type of parcelization to work in Analyst, it is important that no geometries overlap, even if they represent different floors in a structure. For these cases, the lower parcel ID has its geometry cut out and the overlapping portion is retained for the parcel with the higher parcel ID. The parcel area is recalculated for each new geometry, but each geometry retains its original attribute data, meaning that the unit number and building area are not impacted by the change in geometry.
 |
Translating Land Use Codes
The next stage in the parcel canvas creation process is to assign Analyst land uses to parcels. As a first step, the LightBox SmartFabric Standardized Land Use Codes are "crosswalked" to a set of generalized land use designations to facilitate the process of typing parcels with Analyst's Building Types and higher levels of land use categories (see Land Use Hierarchy for more information). The land use typing is then further refined using supplemental datasets for specific land uses and points of interest.
Crosswalking to General Land Use Designations
Most jurisdictions represent land use at the assessment scale, using codes that reflect specific uses. Analyst “translates” this local information to represent development in terms of Analyst's standardized Building Types, which are foundational to scenario development and analysis. While land use and urban form are the subject of both local/regional land use classification systems and Analyst land use types, they are distinct languages. Land use codes are predominantly use-based and static, whereas Analyst's land use types (including Building Types at the parcel scale or Place Types at the census block scale, and the higher-level generalized categories into which they are classified) are primarily form-based. Analyst land use types are designed to be dynamic and expansive to capture the many variants of built form and land use. To relate Analyst Building and Place Types to the universe of LightBox SmartFabric Standardized Land Use Codes, we use the Generalized Land Use Classification (GLUC) system.
The GLUC system is comprised of approximately 100 general land use designations. A crosswalk is used to associate each land use code from the LightBox SmartFabric parcel data with one of these general land use designations, each of which is associated with one or more Analyst Building Types. As part of Base Canvas creation, a translation algorithm uses this crosswalk to narrow the range of Building Types to which each LightBox SmartFabric Standardized Land Use Code can be translated. In turn, residential and employment densities, as calculated in later steps, are used to select the closest fitting Building Type.
For example, "APARTMENTS (GENERIC)" land use code (#1112) is crosswalked to the general land use designation "All multifamily." A multifamily Building Type will then be selected based on the calculated residential density of the parcel. By contrast, LightBox SmartFabric’s "HIGHRISE APARTMENTS" code (#1107) is crosswalked to the "Multifamily high-rise" designation, which is associated with a more restrictive set of potential Building Types.
The crosswalk between LightBox SmartFabric Standardized Land Use Codes and Analyst land use are available upon request. (Please contact Analyst Support through the in-app chat, or by email.)
Right-of-Way Model
Right-of-way (ROW) parcels, or areas covered by public roads, are hard to identify in source parcel data. To address this, we developed a machine learning model to predict ROW parcels. Our model relies on a variety of parcel attributes including:
The shape of the parcel geometry.
The spatial relationships between the parcel and roads and the parcel and railways.
Addresses and buildings associated with the parcel.
By leveraging these factors, the model can effectively distinguish ROW parcels from non-ROW parcels. While the model may not capture all ROW parcels, it significantly reduces the risk of mistyping non-ROW parcels as ROW. We apply the model to all parcels to predict whether they are ROW. The predictions are used as a “supplemental dataset” for the parcel, as described in Supplemental Datasets.
Supplemental Datasets
Supplemental datasets provide more specificity where the parcel data providers' land use data may be lacking. Analyst uses a number of additional datasets for locating land uses and points of interest as summarized in the Supplemental Datasets for Built Form Typing and Disaggregation Table.
Analyst tags parcels with a land use from the parcel data providers and land uses from these supplemental datasets where they apply. The land use for a parcel is then “resolved” by picking one land use from this set of options. The land use that is most in agreement from the set of options is given priority, unless there is an exception-based rule. For example, between a choice of one Industrial - All, two Commercial - Alls and one Commercial - Office, the Commercial - Office Land Use is chosen since the parcel is most likely a commercial parcel with one land use specifically calling it a “Commercial - Office”.
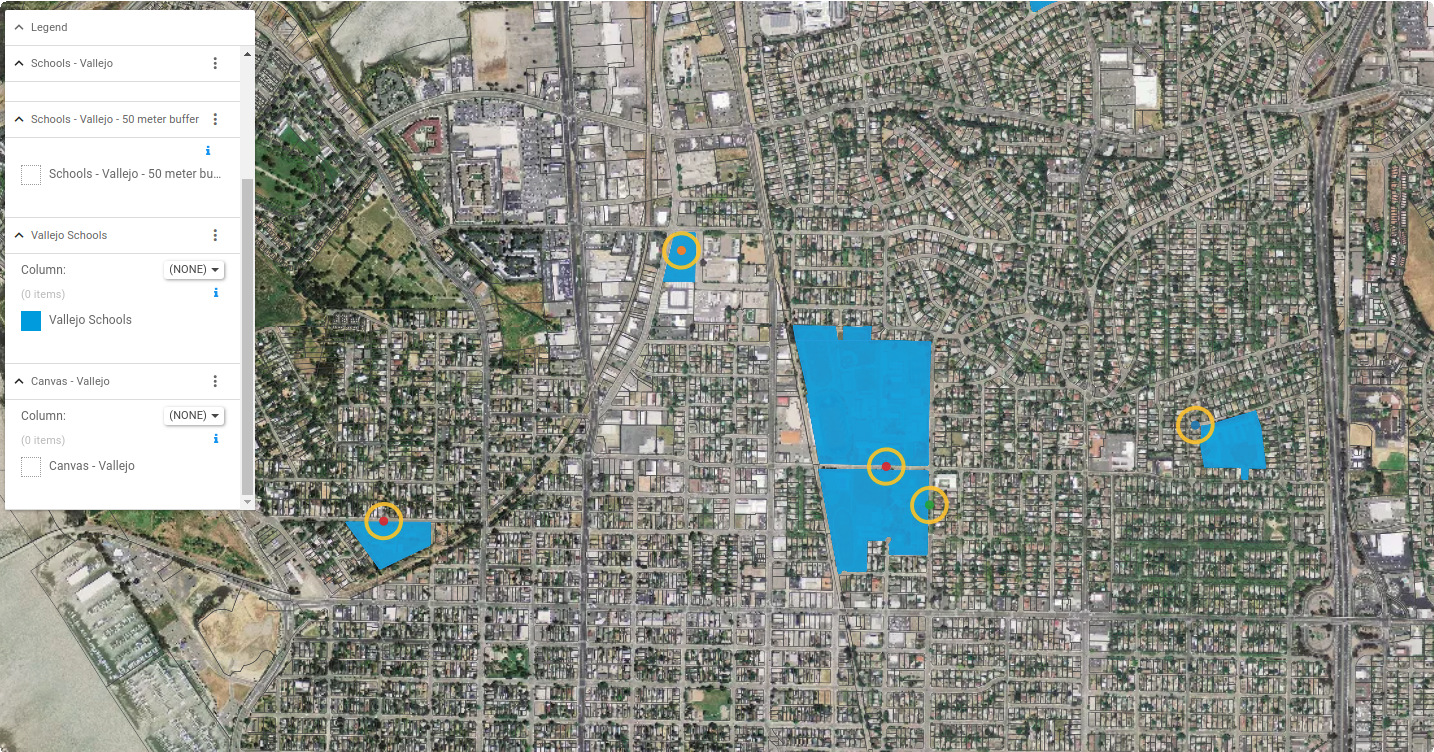
Supplemental datasets can contain either polygon or point features. With polygon datasets, at least 25% of a parcel must be covered by the dataset to be tagged. With point datasets, a parcel is tagged directly if a point intersects it. If a parcel touches a 50-meter buffer around a point, it receives a buffer tag, which is only used to identify land use if a parcel’s original land use code is vacant or null.
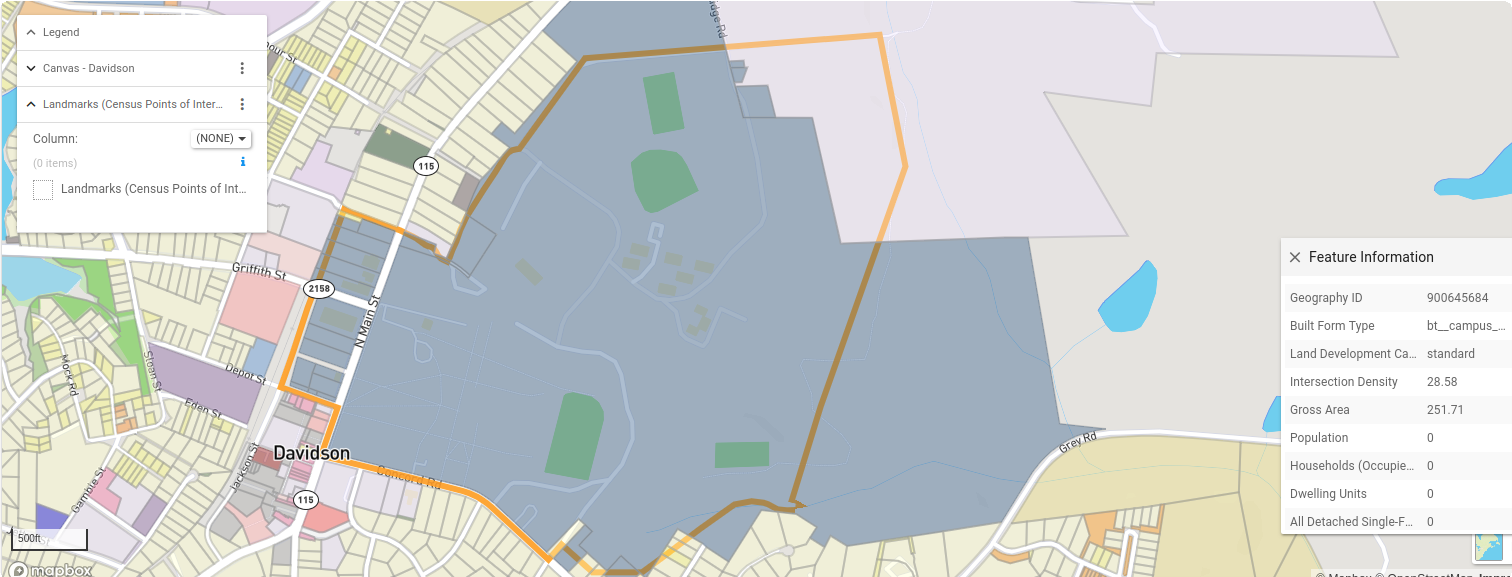
The process of typing parcels using a polygon dataset is exemplified in Polygon-based typing using the Census Landmarks Dataset. The campus geometry defined by the Census TIGER dataset is shown with the orange boundary, while parcels typed as Campus College - Low are shaded blue. All parcels where more than 25% of the polygon intersect with the landmark geometry are retyped accordingly. The large parcel in the upper right side of the image is not typed as campus, as less than 25% of its area intersects with the landmark polygon.
 |
Polygon-based typing using the Census Landmarks Dataset shows examples of direct and buffered tagging using point data, in this case the National Center for Education Statistics (NCES) schools dataset (which provides point locations of K-12 schools). The blue parcels are all typed correctly as schools, either through direct tagging, or buffer tagging and subsequent typing because the parcels had null land use codes.
 |
Lastly, there are some supplemental sources that are used to assign land use types directly. For example, golf courses are assigned the Golf Course Building Type.
Supplemental Datasets for Built Form Typing and Disaggregation Table
Dataset | Source | Geometry Type | UF Land Use/Built Form | ||||||||||||||||||||||||||||||||||||||||||||||
|---|---|---|---|---|---|---|---|---|---|---|---|---|---|---|---|---|---|---|---|---|---|---|---|---|---|---|---|---|---|---|---|---|---|---|---|---|---|---|---|---|---|---|---|---|---|---|---|---|---|
SafeGraph Points of Interest | Point | Varies | |||||||||||||||||||||||||||||||||||||||||||||||
Analyst Right- of-Way Model | Parcel | Right-of-way | |||||||||||||||||||||||||||||||||||||||||||||||
OpenStreetMap (OSM) | Point and Polygon | See Table: OpenStreetMap (OSM) Data Crosswalk Table. | |||||||||||||||||||||||||||||||||||||||||||||||
Parks | Parks and recreation | ||||||||||||||||||||||||||||||||||||||||||||||||
Landmarks | Polygon | Uses the MAF/TIGER Feature Class Code (MTFCC).a | |||||||||||||||||||||||||||||||||||||||||||||||
Military | Polygon | Military | |||||||||||||||||||||||||||||||||||||||||||||||
Prison Facilities | Polygon | Correctional Facilities | |||||||||||||||||||||||||||||||||||||||||||||||
Places of Worship | Point | Religious Centers | |||||||||||||||||||||||||||||||||||||||||||||||
Major Sporting Venues | Point | Commercial Recreation except for Golf Courses which have their own Built Form | |||||||||||||||||||||||||||||||||||||||||||||||
EMS | Point | EMS | |||||||||||||||||||||||||||||||||||||||||||||||
Schools | National Center for Education Statistics (NCES) - Public Schools and Private Schools | Point | Primary and Secondary Educationb | ||||||||||||||||||||||||||||||||||||||||||||||
Hospitals | Point | Hospitals | |||||||||||||||||||||||||||||||||||||||||||||||
Airports | Point | Air Transportation | |||||||||||||||||||||||||||||||||||||||||||||||
Colleges and Universities | Point | Higher Education | |||||||||||||||||||||||||||||||||||||||||||||||
Mobile Home Parks | Polygon | UFLU Mobile Homes | |||||||||||||||||||||||||||||||||||||||||||||||
aThe MAF/TIGER Feature Class Code (MTFCC) is a 5-digit code assigned by the Census Bureau intended to classify and describe geographic objects or features. These codes can be found in the TIGER/Line products. bThe schools are classified as elementary, middle or high based on the highest grade offered at the school. Schools are typed as "urban" if the intersection density of the surrounding census block is greater than 150 intersections per square mile, and "non-urban" if the intersection density falls below this threshold. | |||||||||||||||||||||||||||||||||||||||||||||||||
OpenStreetMap (OSM) Data Crosswalk Table
OSM Property | OSM Tags | UF Land Use |
|---|---|---|
landuse | farmland farm farmyard orchard | Cropland |
commercial | Commercial All | |
industrial | Industrial All | |
forest | All Forest | |
cemetery | Cemeteries | |
retail | All Retail Services | |
reservoir | Utilities | |
basin | Utilities | |
conservation | Greenbelt | |
vineyard | Vineyard | |
amenity | place_of_worship | Religious Centers |
school | Primary/Secondary Education | |
grave_yard cemetery | Cemeteries | |
fire_station police | Fire/EMS | |
shop | convenience supermarket department_store alcohol clothes car car_repair | All Retail Services |
car car_repair | Strip Commercial Center | |
building | house residential | Residential All |
apartments | All Multifamily | |
detached | Single-Family Detached | |
commercial | Commercial All | |
industrial | Industrial All | |
retail | All Retail Services | |
warehouse | Commercial Storage | |
church | Religious Centers | |
university | Higher Education | |
office | Office | |
hotel | Accommodation | |
hospital | Hospitals | |
dormitory | Other Group Quarters | |
leisure | park | All Parks and Recreation |
golf_course | Golf Course | |
nature_reserve | Natural All | |
natural | water | Water |
wetland | Wetland | |
wood | All Woodland |
Dwelling Units
Dwelling unit count for each parcel is derived from the rich collection of LightBox SmartFabric data, which includes tax assessments, buildings, and addresses. We utilize the most reliable, direct indicator of dwelling units first, with fallbacks to secondary sources only when the primary data is unavailable. Dwelling unit count is determined by checking the following sources in sequential order:
The total count of USPS-verified deliverable residential addresses associated with the parcel.
The count of residential units as explicitly identified by the county assessor.
The number of residential assessments on the parcel, provided the parcel is also associated with one or more buildings.
If a count still cannot be established, but the parcel has a non-zero improvement value, assign a default dwelling unit count based on its identified land-use code.
As a final step we verify that dwelling unit densities are reasonable and adjust any outlier values, if needed.
Removing Outliers
We adjust dwelling units in cases where the resulting dwelling unit density is far beyond what could be considered reasonable. For parcels with single-family land uses in the Generalized Land Use Classification system, the following corrections are applied:
Parcels under 0.15 acre with more than five detached single-family dwelling units → reassigned one unit.
Parcels with detached single-family unit density of 50 units/acre, well exceeding what is viable → reassigned units at a density of 5 units/acre.
For parcels with multifamily land uses Generalized Land Use Classification system:
Parcels with a multifamily unit density over 1000 units/acre, well exceeding what is viable → reassigned units at a density of 10 units/acre.
Population and Households
Values for population and households are derived using the dwelling unit counts. The number of dwelling units present on each parcel is multiplied by census rates (ACS 2023 5-Year Estimates) for occupancy to estimate households (households are defined as occupied dwelling units). Population is then calculated using census-derived rates for household size at the tract level.
When there are dwelling units in a tract but the tract has null or zero rates from the census, we use the calculated average of the rates of nearby tracts with a similar LSAD designation.
Employment by Category
Employment by category is first estimated at the census block level using job location data from the US Census Longitudinal Employer-Household Dynamics (LEHD) Origin-Destination Employment Statistics (LODES) dataset (2021). The following states used previous year's data due to limited coverage in the 2021 dataset:
Arkansas and Mississippi - 2018
Alaska - 2016
The block-level employment counts are classified by North American Industry Classification System (NAICS) code, which are crosswalked to the employment subsectors used by Analyst (see NAICS Code Crosswalk to Analyst Employment Categories for the crosswalk table). The employment counts are then disaggregated down to parcels using the process described in the following section.
NAICS Code Crosswalk to Analyst Employment Categories
The Census Longitudinal Employer-Household Dynamics (LEHD) Origin-Destination Employment Statistics (LODES) Workplace Area Characteristics (WAC) dataset accounts for employment using North American Industry Classification System (NAICS) codes, which are mapped to the employment subsectors used in Analyst as follows.
Analyst Canvas Employment Category | LODES WAC Field Code | NAICS Sector | |||||||||||||||||||||||||||||||||||||||||||||||
|---|---|---|---|---|---|---|---|---|---|---|---|---|---|---|---|---|---|---|---|---|---|---|---|---|---|---|---|---|---|---|---|---|---|---|---|---|---|---|---|---|---|---|---|---|---|---|---|---|---|
Extraction Employment (emp_extraction) | CNS01 | Number of jobs in NAICS sector 21 (Mining, Quarrying, and O and Gas Extraction) | |||||||||||||||||||||||||||||||||||||||||||||||
Agriculture Employment (emp_agriculture) | CNS02 | Number of jobs in NAICS sector 11 (Agriculture, Forestry, Fish and Hunting) | |||||||||||||||||||||||||||||||||||||||||||||||
Utilities Employment (emp_utilities) | CNS03 | Number of jobs in NAICS sector 22 (Utilities) | |||||||||||||||||||||||||||||||||||||||||||||||
Construction Employment (emp_construction) | CNS04 | Number of jobs in NAICS sector 23 (Construction) | |||||||||||||||||||||||||||||||||||||||||||||||
Manufacturing Employment (emp_manufacturing) | CNS05 | Number of jobs in NAICS sector 31-33 (Manufacturing) | |||||||||||||||||||||||||||||||||||||||||||||||
Wholesale Employment (emp_wholesale) | CNS06 | Number of jobs in NAICS sector 42 (Wholesale Trade) | |||||||||||||||||||||||||||||||||||||||||||||||
Retail Services Employment (emp_retail_services) | CNS07 | Number of jobs in NAICS sector 44-45 (Retail Trade) | |||||||||||||||||||||||||||||||||||||||||||||||
Transport Warehousing Employment (emp_transport_warehousing) | CNS08 | Number of jobs in NAICS sector 48-49 (Transportation and Warehousing) | |||||||||||||||||||||||||||||||||||||||||||||||
Office Services Employmenta (emp_office_services) | CNS09 | Number of jobs in NAICS sector 51 (Information) | |||||||||||||||||||||||||||||||||||||||||||||||
CNS10 | Number of jobs in NAICS sector 52 (Finance and Insurance) | ||||||||||||||||||||||||||||||||||||||||||||||||
CNS11 | Number of jobs in NAICS sector 53 (Real Estate and Rental a Leasing) | ||||||||||||||||||||||||||||||||||||||||||||||||
CNS12 | Number of jobs in NAICS sector 54 (Professional, Scientific, a Technical Services) | ||||||||||||||||||||||||||||||||||||||||||||||||
CNS13 | Number of jobs in NAICS sector 55 (Management of Companies and Enterprises) | ||||||||||||||||||||||||||||||||||||||||||||||||
CNS14 | Number of jobs in NAICS sector 56 (Administrative and Support and Waste Management and Remediation Services) | ||||||||||||||||||||||||||||||||||||||||||||||||
Education Employment (emp_education) | CNS15 | Number of jobs in NAICS sector 61 (Educational Services) | |||||||||||||||||||||||||||||||||||||||||||||||
Medical Services Employment (emp_medical_services) | CNS16 | Number of jobs in NAICS sector 62 (Health Care and Social Assistance) | |||||||||||||||||||||||||||||||||||||||||||||||
Arts & Entertainment Employment (emp_arts_entertainment) | CNS17 | Number of jobs in NAICS sector 71 (Arts, Entertainment, and Recreation) | |||||||||||||||||||||||||||||||||||||||||||||||
Restaurant Employmentb (emp_restaurant) | CNS18 | Number of jobs in NAICS sector 721 (Accommodation) | |||||||||||||||||||||||||||||||||||||||||||||||
Accommodation Employmentc (emp_accommodation) | CNS18 | Number of jobs in NAICS sector 722 (Food Services) | |||||||||||||||||||||||||||||||||||||||||||||||
Other Services Employment (emp_other_services) | CNS19 | Number of jobs in NAICS sector 81 (Other Services [except Public Administration]) | |||||||||||||||||||||||||||||||||||||||||||||||
Public Administration Employment (emp_public_admin) | CNS20 | Number of jobs in NAICS sector 92 (Public Administration) | |||||||||||||||||||||||||||||||||||||||||||||||
Military Employmentd (emp_military) | - | Number of jobs in NAICS sector 9281 (National Security) | |||||||||||||||||||||||||||||||||||||||||||||||
aemp_office_services is the sum of employment counts for NAICS sectors 51 - 56. bRestaurant and Accommodation employees are grouped into the same two-digit NAICS sector. Accommodation and Food Services employees are assumed to be equally split between restaurant and accommodation sectors for the purpose of separating these sectors for the default block-level canvas. cRestaurant and Accommodation employees are grouped into the same two-digit NAICS sector. Accommodation and Food Services employees are assumed to be equally split between restaurant and accommodation sectors for the purpose of separating these sectors for the default block-level canvas. dFour-digit NAICS codes are not available in the census LODES dataset, making it difficult to differentiate military employees from general public administration employees. emp_military therefore defaults to 0 in the block-level canvas. When better NAICS employment data or land use codes are available, military employees should be separated from emp_public_admin. | |||||||||||||||||||||||||||||||||||||||||||||||||
Disaggregating Block-Level Data to Parcels
Where data is not available at the parcel level, census block-level counts for dwelling units and employment is disaggregated down to the parcels. Disaggregation is guided by the parcels' general land use designation, each of which has rules as to the types of dwelling units and/or employment sectors it can include. For example, a parcel with a Single Family Detached land use designation can take on dwelling units, but not employment, from its parent block. Similarly, a parcel with a Retail land use designation can take on retail employees, but not industrial employees.
From there, dwelling units and employment are distributed among parcels in proportion to their land area, such that larger parcels receive more jobs while smaller parcels receive less.
By default, parcels that are classified as Vacant, Open Space, or Other are excluded from disaggregation. That said, there are some exceptions. If there are dwelling unit or employment counts at the block level, yet all parcels within the block are classified as one of Vacant, Open Space, or Other, the dwelling units or employment get assigned to only the Open Space or Other parcels. If all the parcels are Vacant, the disaggregation logic distributes the dwelling units and employment by land area.
Lastly, data is not disaggregated to parcels under 100 square feet.
Building Area by Type
The building area fields in the Base Canvas are populated using LightBox SmartFabric building data. LightBox SmartFabric Building Footprint Data includes a modeled estimate of each building’s square footage using the modeled number of stories and the building’s planimetric area. For buildings that overlap more than one parcel, the imputed building area is divided across parcels according to the building overlap ratio, which measures the portion of the building on each parcel. For parcels with multiple buildings, the building area is summed across all buildings intersecting with the parcel. When the modeled building area is not available, we use the building footprint area instead.
Building area in the Base Canvas is defined as the total living area, referring to area that would be heated or cooled. This typically excludes garages, unfinished basements, and patios. Total building area for a parcel is allocated to the canvas attributes for building area by housing type and employment by subsector according to the dwelling units and employment present on the parcel. The logic used to distribute the square footage is summarized in the Building Area Distribution Logic Table.
Building Area Distribution Logic Table
Case | Assignment Logic |
|---|---|
Dwelling Units > 0 AND Employment = 0 | Assign Living Square Feet data to housing type present on the parcel. |
Employment > 0 AND Dwelling Units = 0 | Proportionally distribute building area based on number of employees in each subcategory. |
Dwelling Units > 0 AND Employment > 0 | Distribute Living Square Feet into residential an employment uses based on dwelling unit vs. employee proportions. Then assign using the methodology for each case described above. |
Parcel Area by Land Use
The Base Canvas includes parcel area attributes that can be used to track land area for residential, employment, and mixed use development. Parcel area values correspond to the total area of a parcel; that is, the land area is not divided up in any way to reflect different uses within a single parcel. Parcel area is first allocated to one of four mutually exclusive top-level categories according to the criteria outlined in the Top-Level Parcel Area Categories Table.
Top-Level Parcel Area Categories Table
Parcel Area Category | Description |
|---|---|
Residential | Parcels that have dwelling units and no employment |
Employment | Parcels that have employment and no dwelling units |
Mixed Use | Parcels that have both dwelling units and employment |
No Use | Parcels that have neither dwelling units or employment |
Within the top-level residential and employment categories, there are subcategories by dwelling type and employment sector. These parcel area subcategories are not mutually exclusive—each receives the total parcel area if the associated uses are present on the parcel. For example, if a parcel has both retail employment and office employment, both the retail parcel area and office parcel area will be populated with the same value—that for the total area of the parcel. The All Parcel Area Attributes Table includes a full list of the parcel area columns.
All Parcel Area Attributes Table
Parcel Area Column Name | Column Key |
|---|---|
Residential Parcel Area | area_parcel_res |
All Single Family Detached Parcel Area | area_parcel_res_detsf |
Small Lot Detached Single Family Parcel Area | area_parcel_res_detsf_sl |
Large Lot Detached Single Family Parcel Area | area_parcel_res_detsf_ll |
Attached Single Family Parcel Area | area_parcel_res_attsf |
Multifamily Parcel Area | area_parcel_res_mf |
Employment Parcel Area | area_parcel_emp |
All Retail Parcel Area | area_parcel_emp_ret |
All Office Parcel Area | area_parcel_emp_off |
All Public Parcel Area | area_parcel_emp_pub |
All Industrial Parcel Area | area_parcel_emp_ind |
All Agriculture Parcel Area | area_parcel_emp_ag |
All Military Parcel Area | area_parcel_emp_military |
Mixed Use Parcel Area | area_parcel_mixed_use |
No Use Parcel Area | area_parcel_no_use |
Irrigated Area
Base Canvas includes estimates of residential and commercial irrigated area. The values in the parcel canvas are modeled based on general assumptions for the percentage of non-building parcel area that is irrigated. Assumptions are associated with the Building Type assigned to each parcel.
Analyst Land Use Typing
Analyst represents land use on parcels using Building Types. Building Types nest within a classification system composed of four levels, offering users the flexibility to depict development at various degrees of detail. The hierarchy of categories ranges from a high-level summary category (L1) down to specific Building Types and Place Types (L4) (see Land Use Hierarchy for more information). Each feature in the Base Canvas is categorized according to all levels.
As part of the parcel canvas creation process, each parcel is assigned a Building Type from Analyst's default library from among those prescribed for its general land use designation (as described earlier) using density, and, where applicable, land use information from supplemental datasets, to select the best fit. The values for the higher-level L1 to L3 categories are automatically generated via the Building Type designation.
Density-Based Classification
As described earlier, parcels are first assigned an Analyst general land use designation based on their LightBox SmartFabric Standardized Land Use Category Codes (see Crosswalking to General Land Use Designations). Each general land use designation is associated with one or more Building Types, effectively narrowing down the potential candidates. In this step, the Building Type that "most closely" matches the density of each parcel is identified.
“Closeness” is measured as the lowest standardized absolute difference between the Building Type and parcel densities. To do this, the densities of the parcels and Building Types are first standardized into scores by subtracting the mean and dividing by the standard deviation of the corresponding building types set. Then, each parcel’s standardized density score is compared to the standardized scores of its candidate Building Types. The differences are then squared and summed. The Building Type that corresponds to the least sum-of-squares is selected and assigned to the parcel.
If the dwelling unit density and employment density were the axes of a two-dimensional graph, this sum-of- squares would represent the distance between the parcel’s data point and the Building Type data point. Therefore, the least sum-of-squares would represent the building type that is closest to the parcel’s data point. Other attributes could be represented similarly on an n-dimensional graph.
Currently, the process uses dwelling unit density for residential land use designations, employment density for employment land use designations, and both for mixed land use designations.
Non-Density Based Classification
Relying purely on the density-based approach will not capture Building Types representative of special land uses such as parks, open space, schools, or cemeteries. These types are not density-based, so their identification is based on the use of supplemental datasets (see the Supplemental Datasets section for more details). A few exceptions are detailed below.
Institutional types, such as courthouses, libraries, or city halls, cannot be identified using the density-based approach. In the LightBox SmartFabric data, these parcels are sporadically categorized as public, tax exempt, or state property, all of which are hard to parse into specific Building Types. If these parcels have not already been typed using supplemental datasets, they are categorized as Open Space if they are rural (often they are state or regional parks), Non-Urban Civic if they are in developed areas with intersection densities under 150 per square mile, or Urban Civic if they are in developed areas with intersection densities over 150 per square mile.
Intersection Density and Land Development Category
Intersection density and Land Development Category are attributes that reflect the land use context of a parcel. Both are set at the census block level, then passed down to parcels. Each parcel is assigned the intersection density and Land Development Category of the block with which it shares the most area.
Intersection Density
Intersection density is recognized as a proxy for walkability. An intersection is defined as the intersection of any two walk or drive network segments, as derived from Census TIGER roads data. Exact geometric duplicates may occur in the roads dataset or the processed intersections, for example due to bidirectional roads. Both duplicate lines and points are removed to eliminate double-counting. Intersection densities are calculated over a buffered area of 400 meters around each block to smooth out local variations and normalize densities for all locations with respect to their surroundings.
Land Development Category
Analyst Land Development Category is a classification that reflects broad development patterns. They include Urban Infill (Urban), Compact Walkable (Compact), and Suburban (Standard). The Urban category represents areas (typically within moderate and high density urban centers) that have the highest intensity and mix of uses. Compact areas are less intensely developed than Urban areas but very walkable in part because of their mix of residential, commercial, and civic uses. Standard represents auto-oriented, separate-use suburban development patterns. (For custom canvases, a Rural category can be used to represent rural development.)
Land Development Category is assigned to census blocks, and in turn parcels, according to two criteria: intersection density per square mile and activity density (i.e., dwelling unit and employment densities). The categories are used in Base Canvas land use typing, as well some analysis modules (namely the Fiscal Impacts module). The categories also serve to communicate scenario concepts and results.
The criteria for the categories are summarized in Land Development Category Criteria.
Land Development Category | Criteria |
|---|---|
Urban | Intersection density >=150 per square mile, and Employees/gross acre > 70 or dwelling units/gross acre > 40 |
Compact | Intersection density >= 150 per square mile, and Employees/gross acre <= 70 or dwelling units/gross acre ><=40 |
Standard (Suburban) | Intersection density < 150 per square mile |
Rural | Guidelines based on local conditions |
Release Notes
October 2025
Transition to LightBox SmartFabric data. Base Canvas now directly builds on the four core LightBox SmartFabric data sets: parcels, assessor, building footprints, and address data. Integrating LightBox's comprehensive data includes changes to the Base Canvas dwelling unit estimation methodology, building area calculations, and land use typing. With improved data quality from LightBox SmartFabric, Base Canvas now uses more data directly, resulting in a simpler and more transparent dwelling unit estimation methodology and better land use typing.
New parks data. We replaced our previous supplemental parks data sources with the USGS Protected Areas Database of the United States (PAD-US), the official nationwide inventory of protected land and marine areas.
April 2025
Updated parcel data. All of our input parcel data has been updated to the most recently available.
Updated point of interest and contextual data. An update to the underlying point of interest and context data has improved our land use typing to more accurately reflect current conditions.
January 2025
Updated Census input data. We updated various Census input data sources to the most recent available aggregate data. In most cases we use the 2023 American Community Survey, but dwelling unit data is sourced from 2020 Decennial block data for higher spatial precision.
Improved property value data. We updated our algorithm for estimating parcel level property value data and validated the improvements using data from state departments of revenue tax data.
Updated parcel data. All of our input parcel data has been updated to the most recently available.
Updated point of interest and contextual data. An update to the underlying point of interest and context data has improved our land use typing to more accurately reflect current conditions.
November 2024
Updated Census input data. We updated various Census input data sources to the most recent available aggregate data. In most cases we use the 2022 American Community Survey, but some data is only available from the 2020 Decennial.
Updated employment data. We updated our main source for calculating parcel-level employment estimates to use the latest available data from Census LEHD Origin-Destination Employment Statistics
Updated parcel data. All of our input parcel data has been updated to the most recently available.
Updated point of interest and contextual data. An update to the underlying point of interest and context data has improved our land use typing to more accurately reflect current conditions.
July 2024
Updated the 2021 project area boundary geometries to 2022.
Refined the Airport land use classification.
Updated the layers for public and private schools to the National Center for Education Statistics (NCES) to their 2021- 2022 dataset.
Updated parcel data. All of our input parcel data has been updated to the most recently available.
An update has also been made to the underlying point-of-interest data, resulting in improved commercial land use types.
January 2024
Updated parcel data. All of our input parcel data has been updated to the most recently available.
Improved Dwelling Unit numbers. We have improved our typing for multifamily units, leading to more accurate dwelling unit numbers.
October 2023
Improved data processing algorithm. We updated our data handling process for the parcel data from one of our providers, resulting in improved estimates to many fields.
Updated parcel data. All of our input parcel data has been updated to the most recently available.
Updated contextual data. An update to the underlying context data has improved our land use typing to more accurately reflect current conditions.
July 2023
Improved commercial land use typing. An update to the underlying point-of-interest data has improved the typing of commercial land use.
More accurate land use and employment information. An update to the underlying OpenStreetMap point and polygon data yields more accurate land use typing and employment information.
Incorporated an additional parcel provider. We integrated an additional data provider with nationwide coverage.
Improved Dwelling Unit assignment. We leveraged additional parcel data to better align our dwelling unit estimation with the Census.
May 2023
Improved land use typing for Right of Way parcels. We built a machine-learning model to identify parcels that are actually public Right of Way (such as roads). Incorporating this model into the Base Canvas improved our overall parcel typing, and increased the share of parcels typed as Right of Way from 0.002% to 0.48% nationwide.
More accurate land use and employment information. An update to the underlying OpenStreetMap point and polygon data yields more accurate land use typing and employment information.
Improved commercial land use typing. An update to the underlying point-of-interest data has improved the typing of commercial land use.
January 2023
More accurate land use and employment information. An update to the underlying OpenStreetMap point and polygon data yields more accurate land use typing and employment information.
Improved commercial land use typing. An update to the underlying point-of-interest data has improved the typing of commercial land use.
November 2022
Expanded coverage. 60 new counties have been added, pushing our nationwide cover up to 99% of the U.S.
Improved commercial land use typing. An update to the underlying point-of-interest data has improved the typing of commercial land use.
More accurate land use and employment information. An update to the underlying OpenStreetMap point and polygon data yields more accurate land use typing and employment information.
August 2022
Near-nationwide coverage. Nearly 2,000 new counties have been added, tripling the number supported and resulting in coverage of 97% of the US.
Improved commercial land use typing. An update to the underlying point-of-interest data has further improved the typing of commercial land uses.
January 2022
Updated building footprints data. An update to the underlying building footprints data (Microsoft Building Footprints) has increased the coverage of our dwelling units data and irrigated land area calculations, and in some cases has improved our commercial land use typing.
Improved commercial land use typing. An update to the underlying point-of-interest data has improved the typing of commercial land uses.
More accurate land use and employment information. An update to the underlying OpenStreetMap point and polygon data yields more accurate land use typing and employment information.
Bug Fix. Previously, calculated columns in the parcel reference data layer such as Floor Area Ratio, Improvement to Land Value Ratio, Market Improvement to Land Value Ratio, and Assessed Improvement to Land Value Ratio erroneously reported a zero when inputs to the calculation were missing or not applicable. With this release, the calculated value will also be reported as not available in those cases.
September 2021
Addition of Oconee County, GA
Addition of download capabilities for Imperial County, CA and Cochise County, AZ Updated parcel geometries and attribute data for hundreds of U.S. counties Improved typing of commercial land use
July 2021
Expanded coverage. The Base Canvas for California has been expanded to cover an additional 15 counties for complete parcel coverage of the entire state. Parcel geometries and attribute coverage have also been updated for hundreds of counties across the U.S.
Improved commercial land use typing. An update to the underlying point-of-interest data improves the typing of commercial land uses.
More accurate land use and employment information. An update to the underlying OpenStreetMap point and polygon data yields more accurate land use typing and employment information.
January 2021
Updated employment data. By updating the underlying data source from the U.S. Census Bureau’s LODES 2017 to the newly released LODES 2018, the UrbanFootprint Base Canvas now provides you with the latest available census-based employment data, adding nearly 3.5 million jobs nationwide.
Updated parcel geometries and attributes. Parcel geometries have been updated for 132 counties. Parcel attributes have been updated for 1,022 counties.
More accurate typing of parks and multifamily parcels. The assignment of current land use to parcels with parks and multi-family residential buildings has been improved to result in fewer incorrectly assigned park or residential parcels.
October 2020
In addition to our regular update, this quarter’s release includes some exciting improvements:
More accurate typing of commercial parcels based on newly integrated SafeGraph point-of-interest (POI) data, improving how commercial use is identified (including offices, retail sites, medical services) and how job categories are separated at the parcel level
Updated census metrics, using the latest Census ACS 2018 dataset, to improve how missing population or household rates are handled at the census tract level
May 2020
Base Canvas Attributes
You can view and export a copy of the Base Canvas schema, which includes the attribute names, column keys, and descriptions directly from Analyst.
Select the Base Canvas layer in the Layers list.
From the Layer Details pane, click Download layer
 and select Column descriptions > CSV.
When the layer is ready, click DOWNLOAD in the pop-up notification to download the Base Canvas Metadata CSV file.