Land Use Scenario Building
Land use scenarios are built by applying population, housing, employment, and development attributes to the parcels or blocks of a scenario canvas. These attributes can be applied by "painting" canvas features with land use types (Building Types or Place Types). As a complement to painting by type, you can also paint "by attribute" to directly specify values for dwelling units, employment, and their associated building area.
Before starting, it's a good idea to review the land use types and library settings that you'll be using. You can use the default set of types that come loaded with Analyst, or you may choose to create your own. For more information, see Building Types and Place Types.
Scenario Building Controls
The scenario painting controls are located on the Build tab of the Layer Details pane for the Scenario Canvas layer.
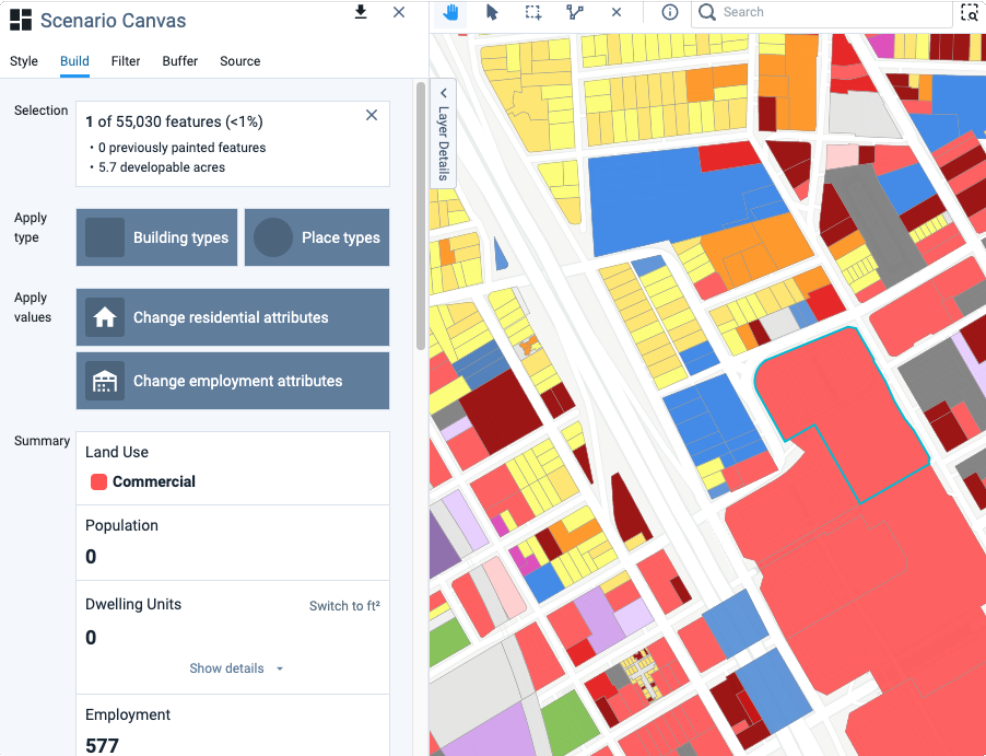 |
Building scenario controls
Selection – Summarizes the currently selected canvas features. The first line includes a count of the features selected, along with the count of features in the entire project area canvas. The second line indicates the total developable area within the selected features.
Type – Clicking opens either the Building Types or Place Types selection window, from which you can choose types to paint with. Types are grouped by Land Use Summary (L1) category and listed in alphabetical order. L1 categories include Mixed Use, Residential, Commercial, Industrial/Warehouse, Civic/Institutional, Transportation/Utilities, Open space, Vacant/Other, Agriculture, Natural resources, Natural/Conservation, and Water.
You can see more details about a type by clicking the arrow in the upper right corner of an entry.
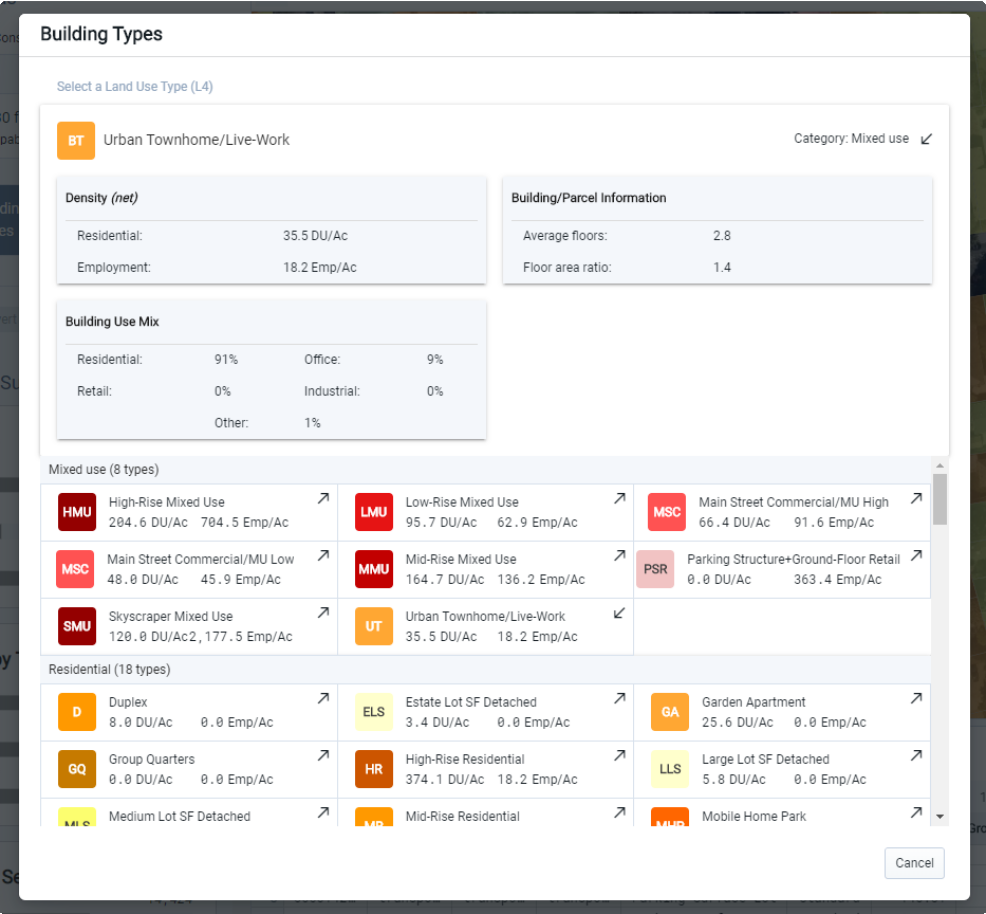
Building Types - The Building Types menu is shown below with the details expanded for one of the types. Building Type details include:
Density (net) – Includes net residential and employment densities, which are measured over parcel area.
Building/Parcel information – Summarizes basic characteristics about the building type, including the average number of floors, floor area ratio (FAR), and building coverage.
Building Use Mix – Summarizes the building floor area distribution among five use categories: Residential, Retail, Office, Industrial, and Other (including Public and other non-residential uses).
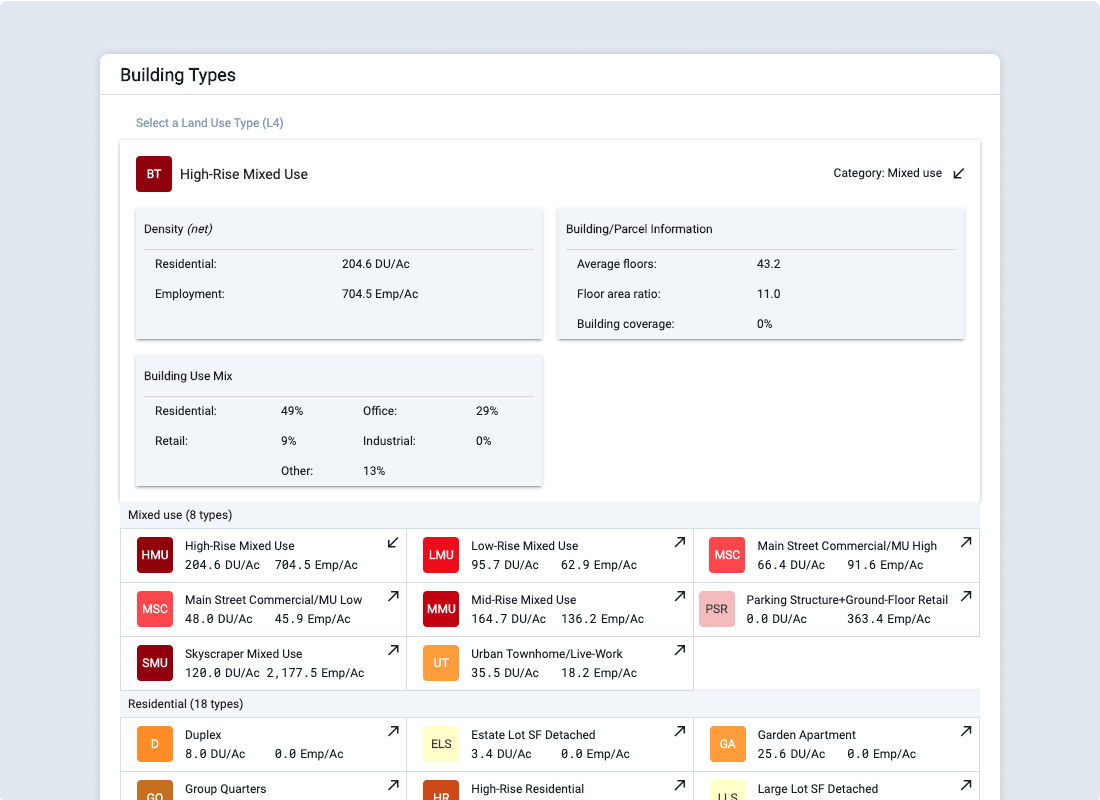
Building Types selection window
Place Types - The Place Types menu is shown below with the details expanded for one of the types. Place Type details include:
Density – Includes net and gross residential and employment densities. Net densities are measured over parcel area, while gross densities are measured over gross area inclusive of rights of way.
Land Use Information – Summarizes the distribution of land between parcels and streets, parks, and civic areas.
Residential Mix – Summarizes the distribution of housing, if applicable, by housing type; types include single family large lot, single family small lot, townhome, and multifamily.
Employment Mix – Summarizes the distribution of employment by broad sector: Retail, Office, Industrial, and Other.
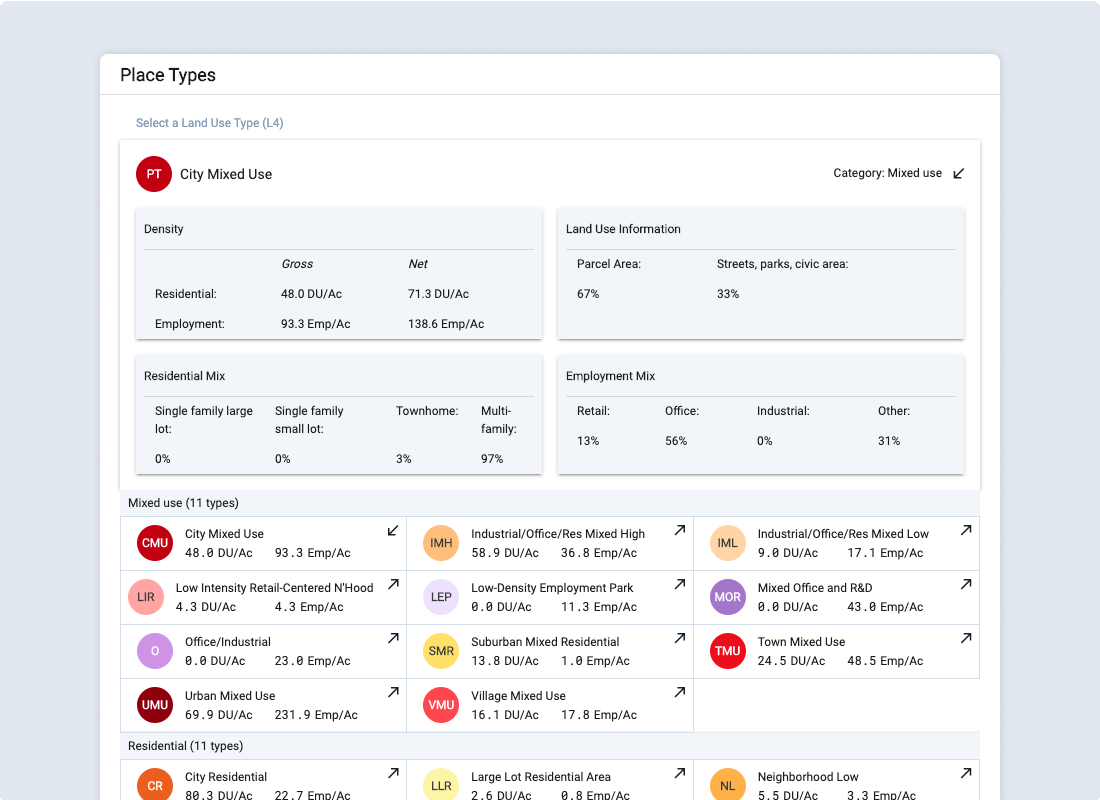
Place Types selection window
Apply Values – These controls are used to paint features by specifying residential and employment attributes, rather than applying land use type densities.
Change residential attributes – Through this control, you can specify numbers of dwelling units by type and unit sizes, and apply them per feature or per acre to the developable area of the selected feature(s).
Residential attribute entry
Change employment attributes – Through this control, you can specify numbers of employees or amounts of building floor area by sector, and apply them per feature or per acre to the developable area of the selected feature(s).
Employment attribute entry
Summary – Land use program information appears when you select a type to paint with, and/or enter attribute values to apply. The table includes counts of population, dwelling units (DU), and employment within the selected feature(s) for three conditions:
Base value – DU, population, and employment in the Base Canvas, shown in gray text.
New value – DU, population, and employment that the feature(s) will contain if painted with the currently selected type or attributes, shown in black text.
Net change – The net change in DU, population, and employment between the Base and future conditions, shown in green text for growth or red for loss.
Paint x features – Click to paint the x selected feature(s).
Revert x to base – Click to revert the x painted feature(s) in the selection to the Base Canvas condition.
Undo
 – Click to undo your last paint.
Note
You can continue to click Undo to revert previous paints. By doing this, you can return the Scenario or Base Canvas layers to their original state.
Redo
 – Click to redo a paint that has been undone.
Scenario Canvas Summary Charts
The four charts in this section provide summarized information about new development in your scenario, serving to gauge progress as you paint. The bars in each chart are stacked to indicate counts for the base and increment (growth, or net positive change) or decrement (loss, or net negative change), which together amount to total future development. Hovering over the bars displays counts for the base and increment or decrement. The counts displayed on the chart indicate the endstate totals for the scenario, along with the net change represented by scenario paints. The charts include:
Summary – Shows total population, dwelling units, and employment.
Dwelling Units by Type – Shows counts of single-family detached, single-family attached (townhome), and multifamily units.
Employment by Sector – Shows counts of employment by sector, including retail, office, public, industrial, agriculture/extraction, and military.
Building Square Feet by Type – Shows amounts of residential, retail, office, public, and industrial building floor area, in square feet.
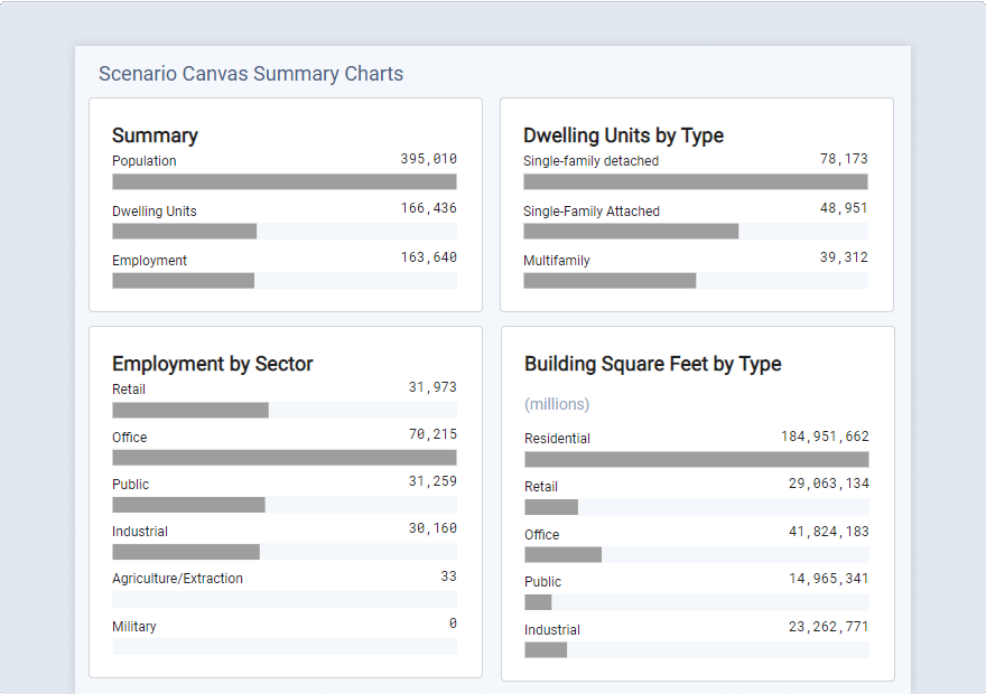 |
Scenario summary charts shown in Build mode
Build a Land Use Scenario
To start, you’ll need to set up a scenario and enter Build mode. From there, you can paint development using land use types alone, or paint by attribute using manually entered residential and employment attributes. As you build scenarios, you'll also need to manage and monitor painting actions.
Enter Build Mode
Create a new scenario, if you haven't already.
Click the tab of the scenario you will be working on.
Activate the Scenario Canvas layer. The Scenario Canvas represents your scenario. When you create a new scenario from the Base Scenario, the Scenario Canvas is created as a copy of the Base Canvas.
Symbolize the Scenario Canvas layer on the Land Use Type (L4) column. This column contains the Building and/or Place Type classifications for the Base Canvas.
Enter Build mode by clicking the Build icon
 in the Mode bar. Alternatively, you can enter Build mode by activating the Scenario Canvas layer and selecting the Build tab in the Layer Details pane. The Build controls appear in the Layer Details pane.
Select one or more features on the Scenario Canvas to paint. You can select features using the manual selection tools, or apply filters and/or joins to select features based on particular criteria—for example, vacant parcels, parcels within walking distance of transit, or underutilized parcels suitable for redevelopment.
Paint by Type
Click either the Building Types or Place Types button to open a type selection window. The Building Types or Place Types selection window will appear.
Select a type to paint with. The menu entry for each type shows its residential and employment densities. Click the expand arrow in the upper right corner to see more details. Select a type and the window will close.
Review the program summary corresponding to your selection. The summary shows the population, dwelling unit (DU), and employment counts for the base, followed by the counts that will result if the features are painted with the selected type. The net growth or loss between the base and future scenario allocation is also shown. To see dwelling units by type or employment by sector, click the Show details buttons.
If you wish to adjust the residential and employment allocations, skip ahead to step 4 of Paint by Attribute. Otherwise, continue to paint your feature(s) as selected.
Click the Paint x features button. The feature(s) will be painted accordingly. The painting action will be reflected in the scenario canvas summary charts, on the map, and in the data table for the scenario.
Paint by Attribute
Click either the Building Types or Place Types button to open a type selection window. The Building Types or Place Types selection window will appear. While you can paint by attribute without setting a land use type, we recommend that you select one to reflect the new land use in the scenario canvas, and in maps.
Select a type to paint with. Selecting a land use type is an optional starting point for painting by attribute. You may retain either the residential or employment attributes prescribed by the type while manually specifying the other. If you go on to manually specify the residential and employment attributes to be painted, then the type you select will apply in name only. Selecting a type will set the L1 to L4 land use categories of the feature, which are important for mapping and working with scenarios.
The menu entry for each type in the Building Types or Place Types selection window shows its residential and employment densities. Click the expand arrow in the upper right corner to see more details. Select a type and the window will close.
Building Types selection window
Review the program summary corresponding to your selection. The Summary section shows the population, dwelling unit (DU), and employment counts for the base, followed by the counts that will result if the features are painted with the selected type. The net growth or loss between the base and future scenario allocation is also shown. As you change the residential and/or employment area attributes in the steps that follow, the program summary will change. To see dwelling units by type or employment by sector, click the Show details buttons.
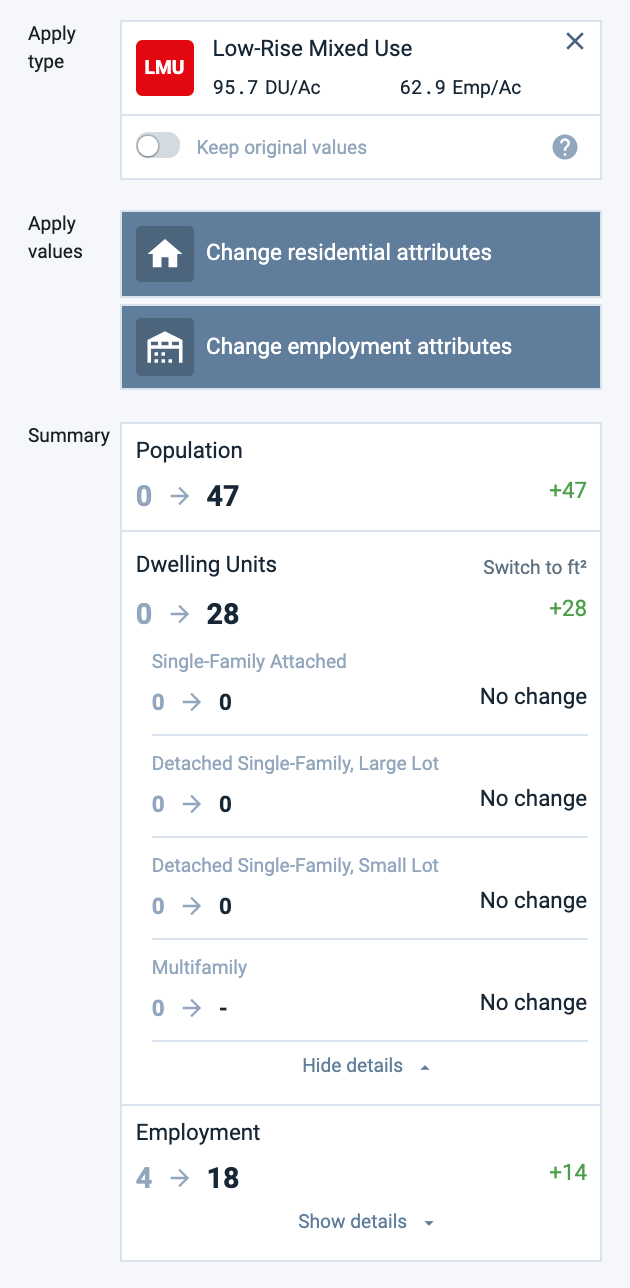
View of the Summary section, with dwelling unit details expanded
To change the residential allocation, click the Change residential attributes button. A menu of housing types will appear.
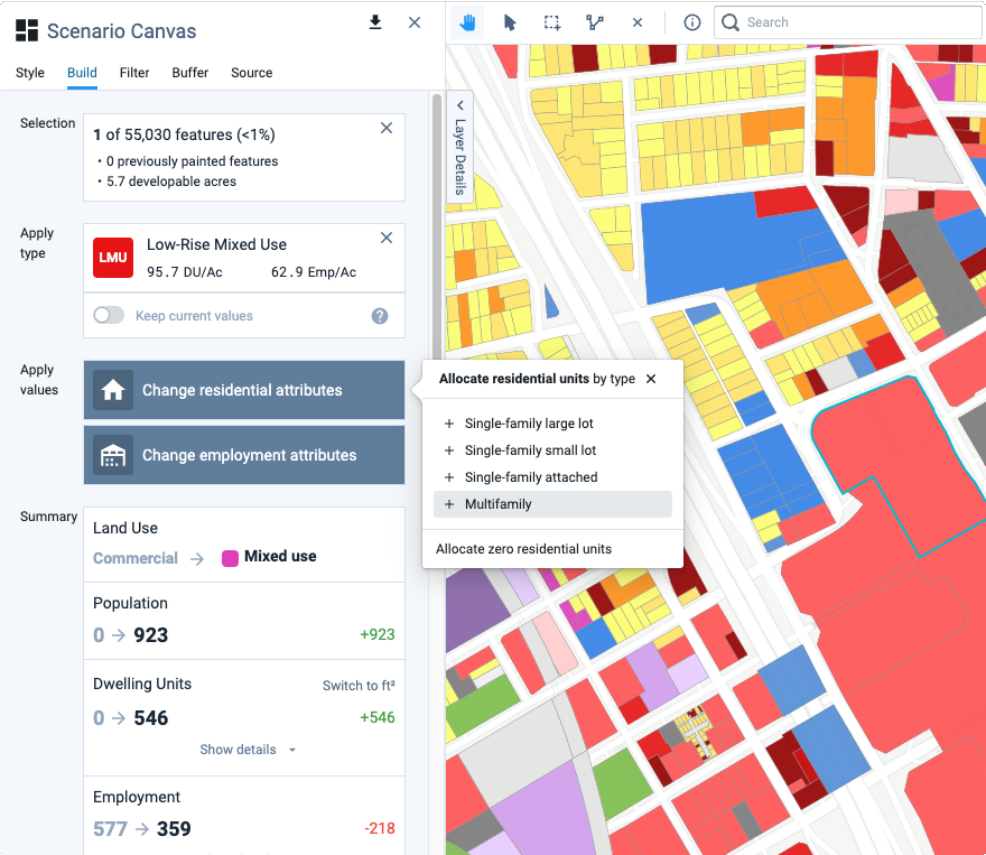
Selecting a housing type to add
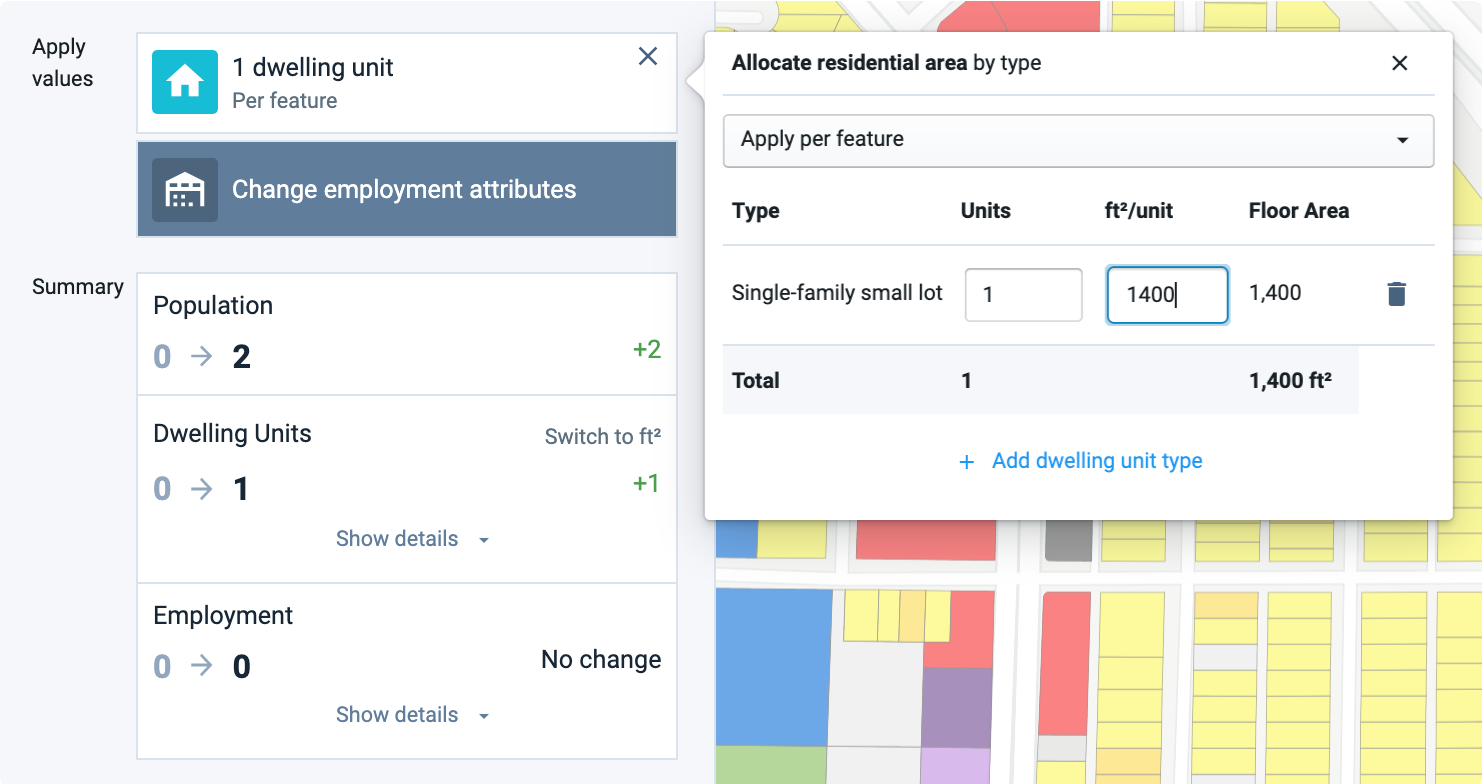
Select the housing type that you wish to specify. The Allocate residential area by type window will appear with an entry row for the selected housing type.
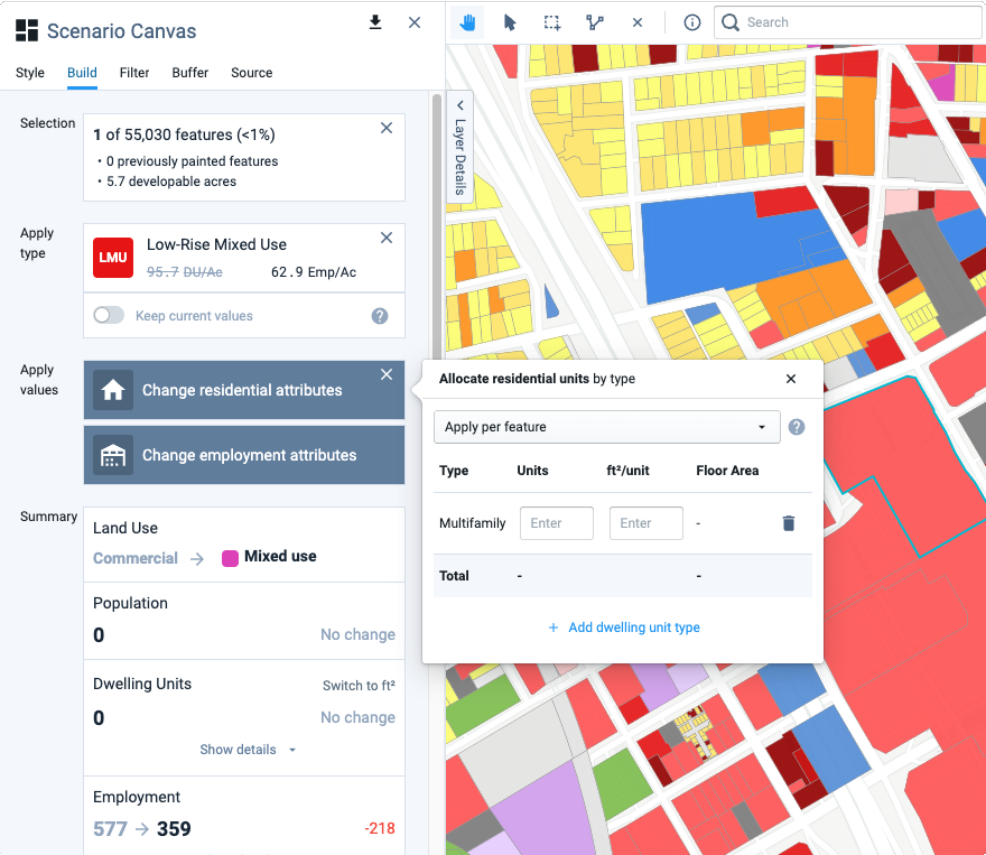
Allocate residential area by type window
Select Apply per feature or Apply per acre from the drop-down menu. Apply per feature paints the same numbers of units on each selected feature, regardless of their land area. Apply per acre paints units by density on the developable land area of each selected feature.
Enter a number of units and unit size. Residential unit sizes are expressed in terms of net floor area per unit. The total floor area associated with your entries is shown to the right.
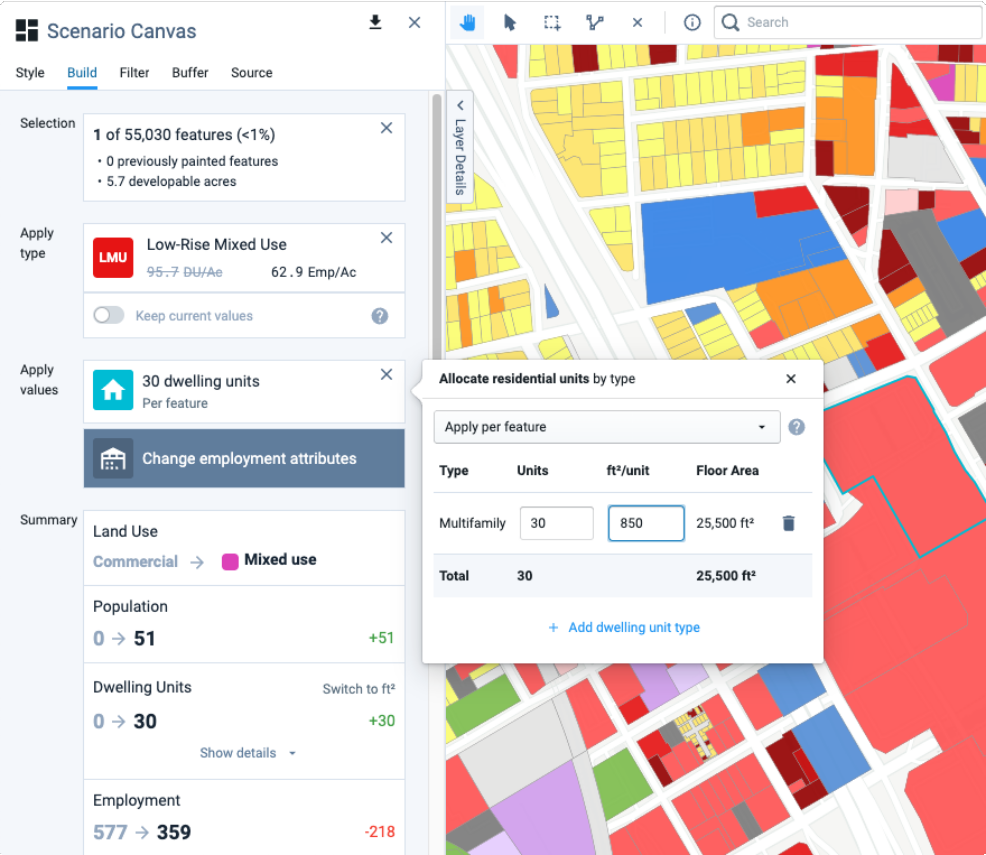
Entering residential attributes
The Summary section will be updated to show the total dwelling units and population associated with your entries. Population is calculated using the project-wide variables for the average multifamily household size and overall residential occupancy. These variables are set on the Library Settings page in Manage mode. Population cannot be edited independent of dwelling units for individual features.
Also notice that the density indicator in the land use type card gets crossed out to indicate that the original residential density for the type no longer applies. Since we haven't yet changed the employment attributes, the original employment density still applies.
Click the + Add dwelling unit type button to add more entry rows. You can add rows for other types of dwelling units, or for units of the same type with different sizes. For example, you can create multiple multifamily entries to represent a building type with a mix of studio and one-bedroom apartments. Or, you can represent a single family home with an accessory dwelling unit by including a multifamily unit in addition to a single family unit. Entries for these examples are shown below.
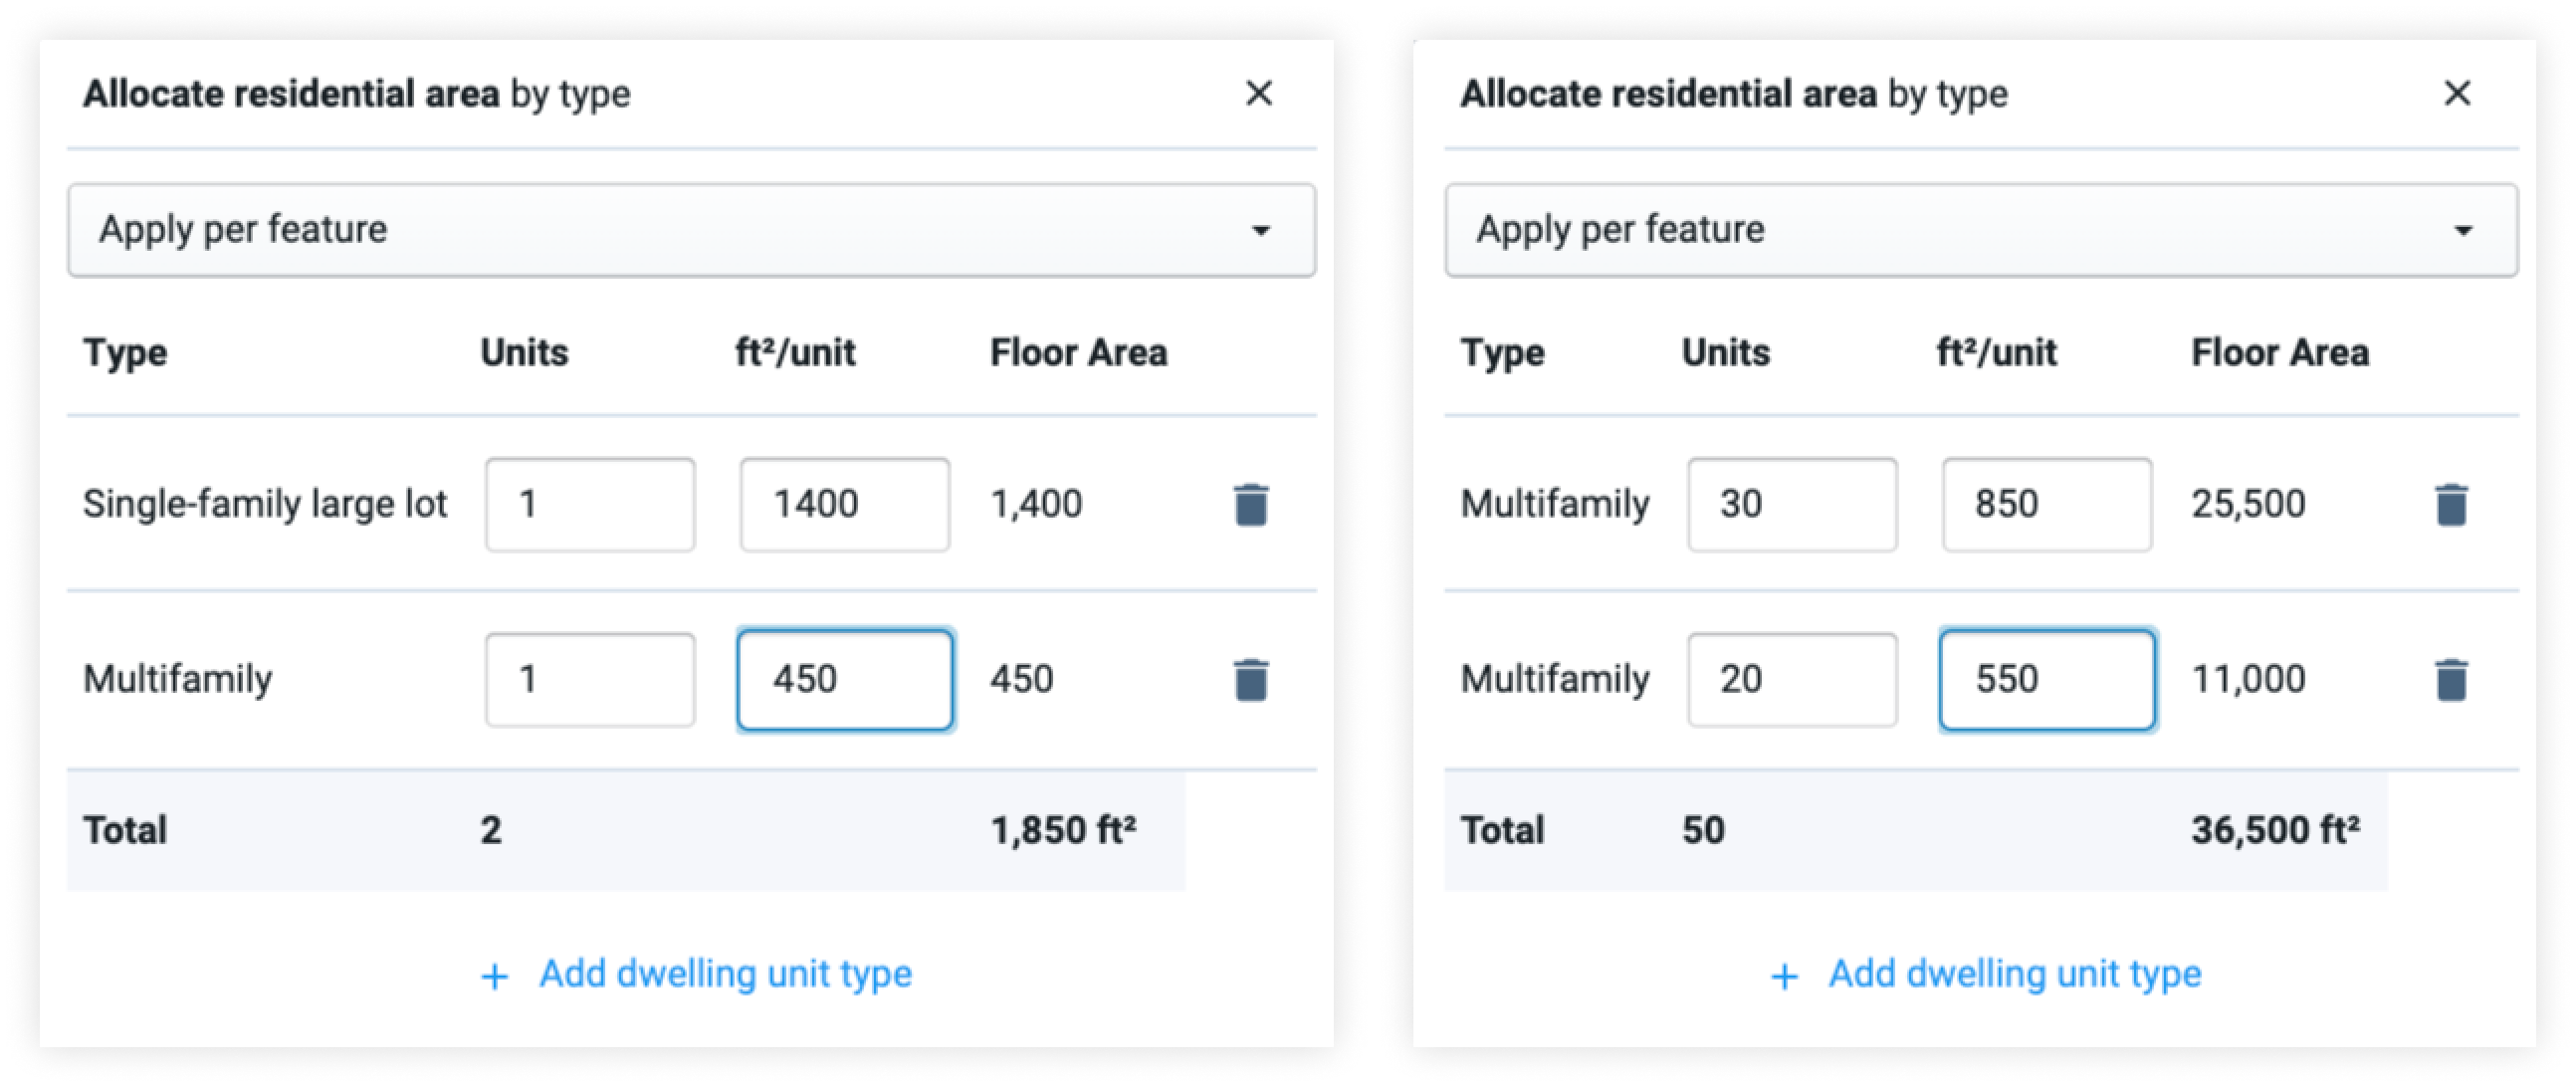
Entries for a mix of housing unit types or sizes
Entries are automatically saved; to remove an entry row, click the Delete icon
 .
. Click the X button at the top right of the Allocate residential area by type window to close it.
To change the employment allocation, click the Change employment attributes button. A menu of employment sectors will appear. Remember that you have the option of changing residential attributes without changing employment attributes, or vice versa.
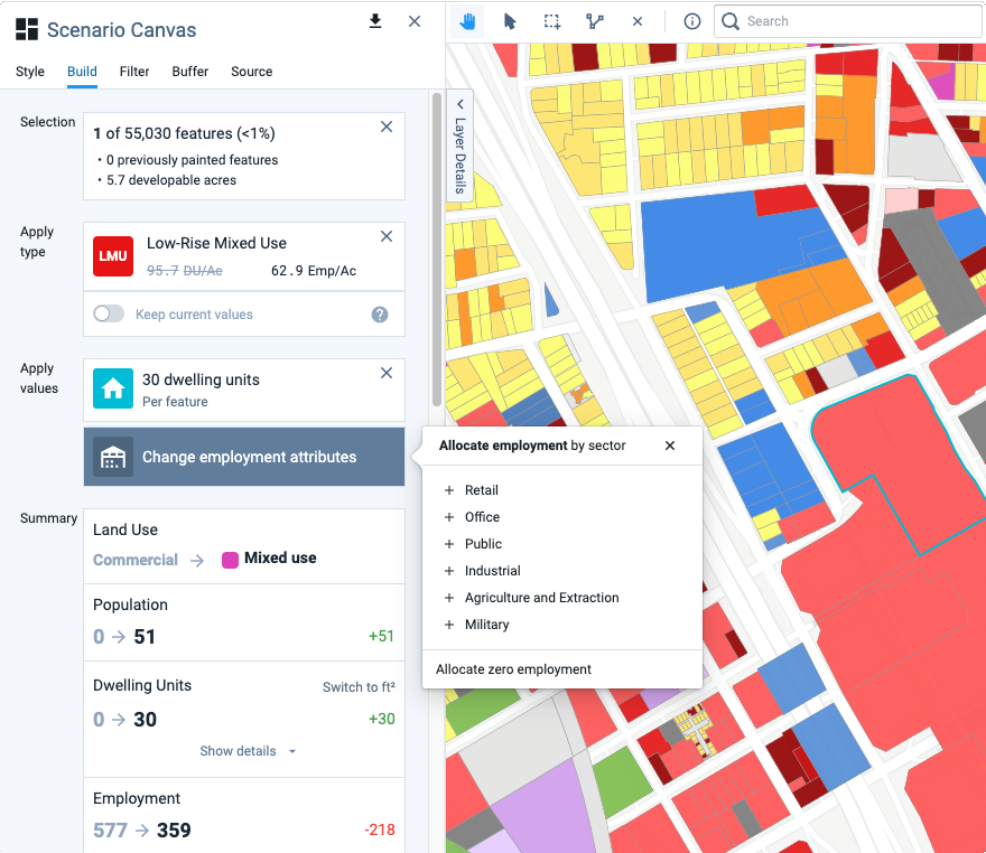
Selecting an employment type to add
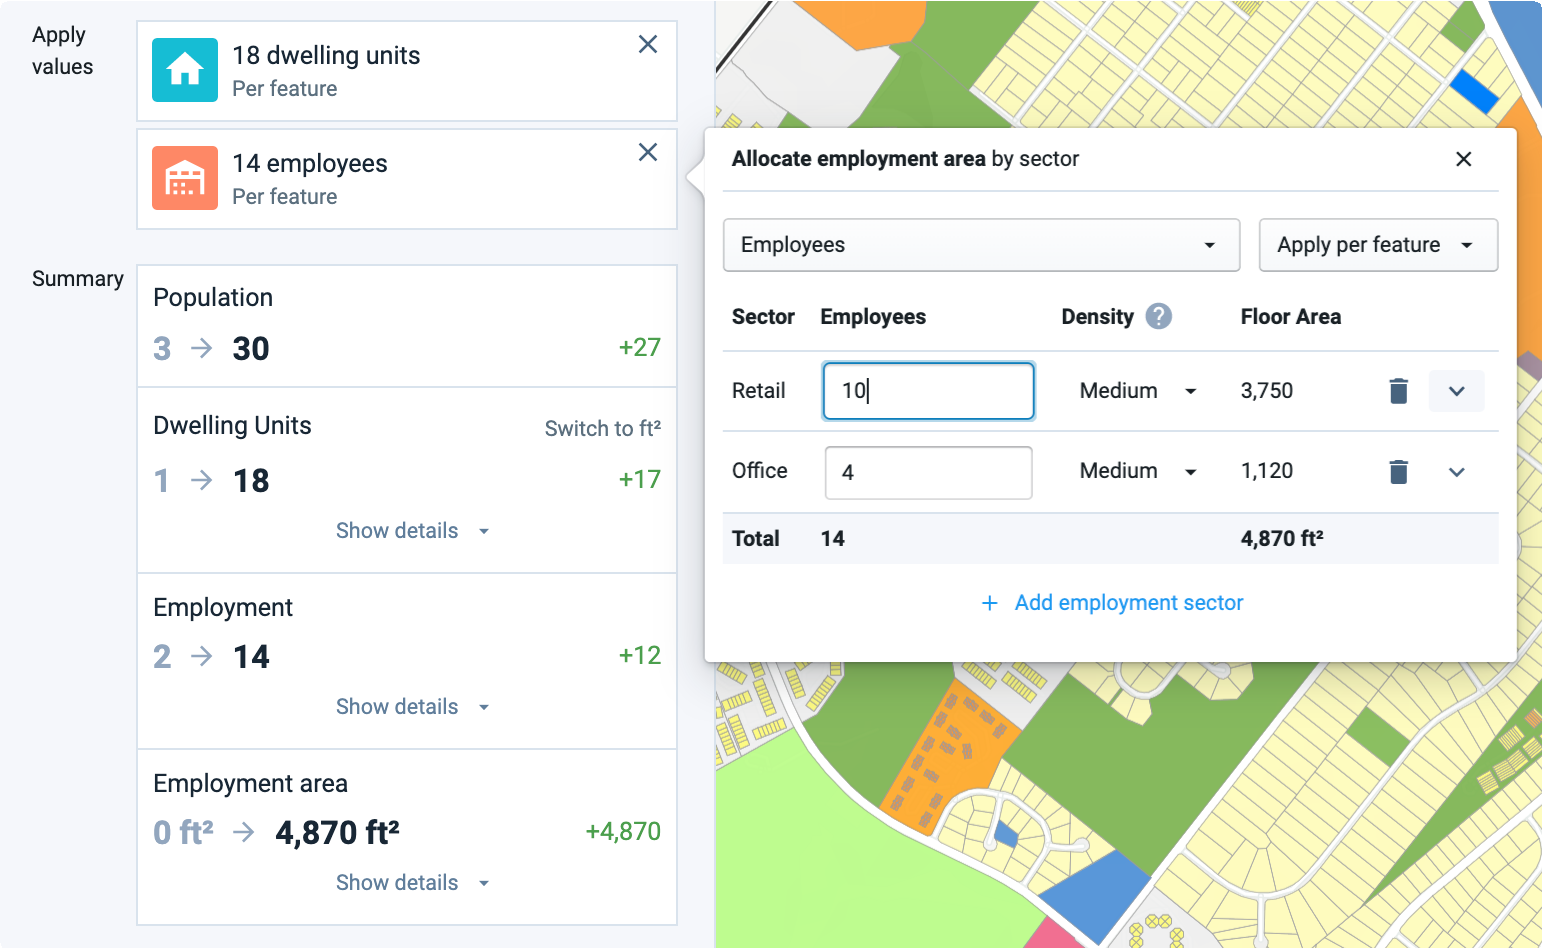
Select an employment sector to be included. The Allocate employment area by sector window will appear.
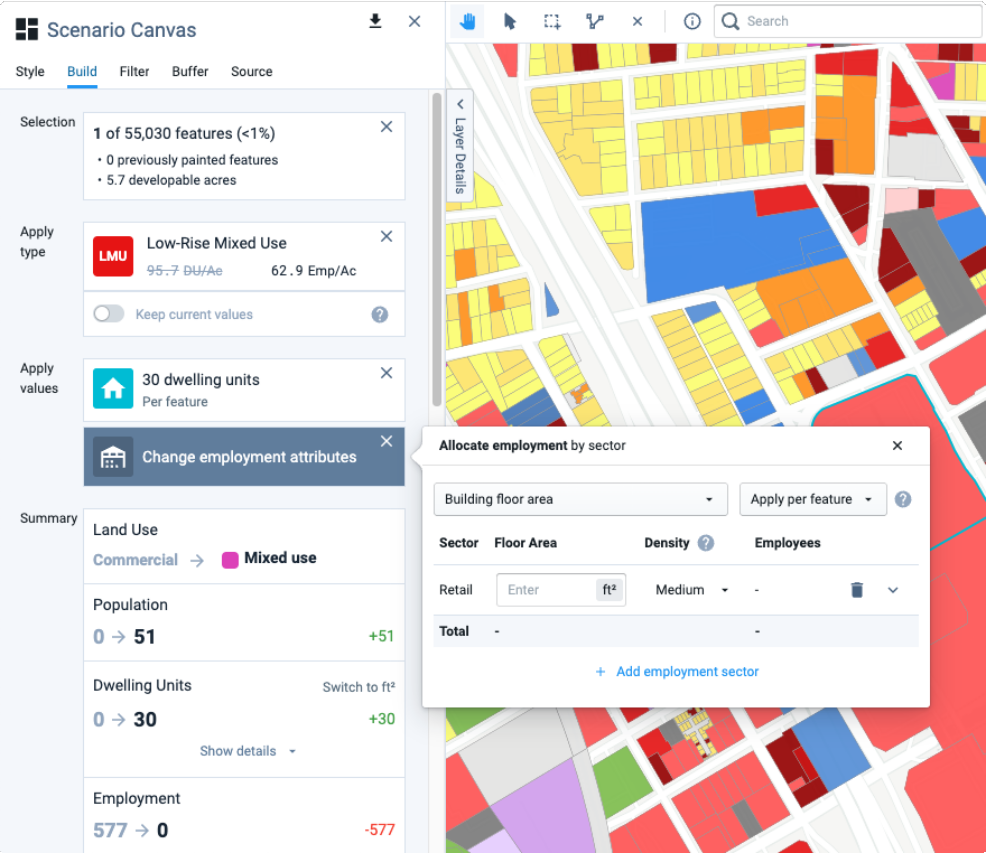
Allocate employment area by sector window
Select Building floor area or Employees from the drop-down menu. You can enter employment information based on gross building floor area, or by numbers of employees.
Select Apply per feature or Apply per acre from the drop-down menu. Apply per feature paints the same numbers of employees and building floor area on each selected feature, regardless of their land area. Apply per acre paints employees and building area by density on the developable land area of each selected feature.
Enter a desired number of employees or building floor area for the sector. If you enter a number of employees, the corresponding gross building floor area will be calculated, or vice versa if you enter a building floor area. The relationship between floor area and employees by sector is determined by an underlying distribution of employees by subsector, and variable assumptions for gross floor area per employee. We'll see these values soon.
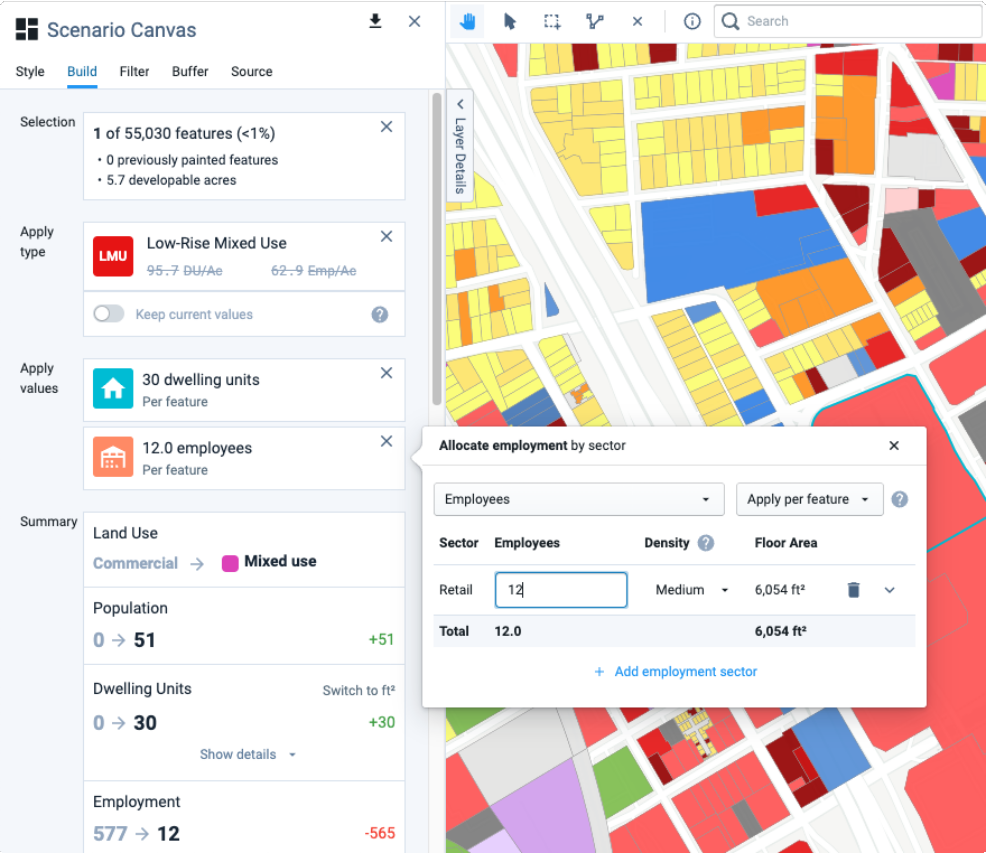
Entering employment attributes
Select a building density category from the Density drop-down menu. The Low, Medium, and High building density categories are the same as those used in creating Components. Each category is associated with a different set of variables for floor area per employee, by subsector. These variables are set on the Library Settings page in Manage mode.
Click the Expand icon
 at the right end of the entry row. The distribution of employees and building floor area by subsector will be shown, along with variable values for square feet per employee. In our example, we have a 50/50 distribution of employees between the Restaurant and Retail services subsectors, and an allocation of 500 square feet and 800 square feet of gross floor area for each, respectively.
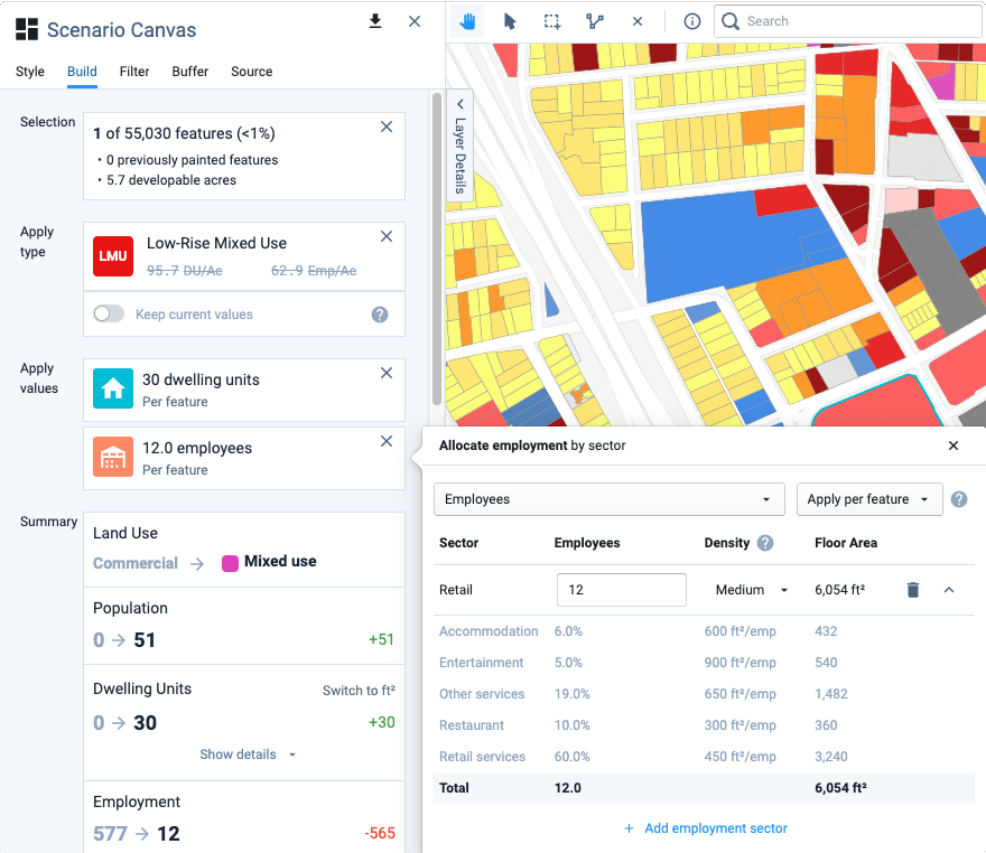
Viewing employment attributes by subsector
The distribution of employees by subsector is based on the default values set on the Library Settings page in Manage mode. While you cannot change the subsector employment distribution through the painting dialog, you can set the defaults in Library Settings prior to painting to populate the dialog with the intended values. The subsector distributions are static defaults, not variables, so changing them will not affect other painted features or land use types.
From the Library Settings page, you can also set the variables for gross floor area per employee. Variables are dynamic, so any changes to them affect all associated land use types, painting actions, and edits to the Base Canvas that involve changing employment values. The variables do not apply, however, to the base employment or building area values of unedited or unpainted features. See Use Library Settings for details on setting the variable values.
Once you specify new employment information, the Summary section will be updated to show the employment and building floor area associated with your entries. Also notice that the density indicator in the land use type card gets crossed out to indicate that the original employment density for the land use type no longer applies. Entries are automatically saved; click the Delete icon
to remove entry rows.Click the + Add employment sector button to add more entry rows. You can add rows for employment in other sectors, following the previous steps to enter attributes. Again, entries are automatically saved. Click the Delete icon
if you wish to remove a row. 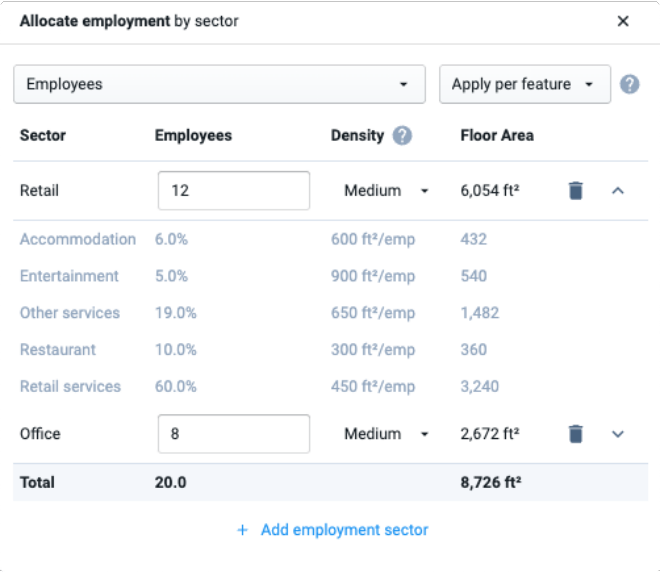
Entering attributes for multiple employment sectors
Click the X button at the top right of the Allocate employment area by type window to close it.
Review the program summary corresponding to your attribute entries. The summary contains population, dwelling unit (DU), and employment counts for the base, followed by the counts to be painted. The net growth or loss between the base and future scenario allocation is also shown. To see dwelling units by type or employment by sector, click the Show details buttons.
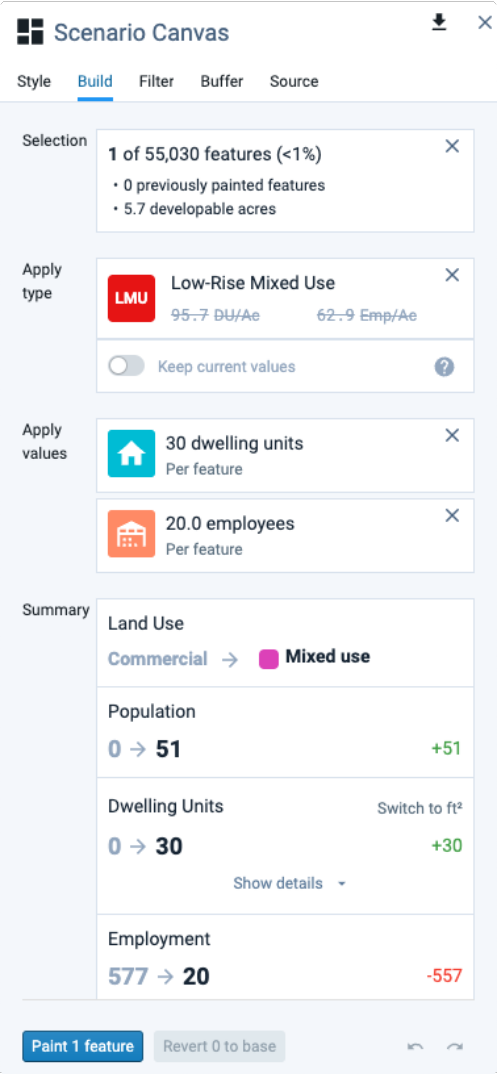
Program summary of attributes to be painted
To paint the feature(s) as specified, click the Paint x features button. The feature(s) will be painted accordingly. The change will be reflected in the scenario canvas summary charts, on the map, and in the data table for the scenario.
Manage and Monitor Painting Actions
To make any changes, use the Revert x to base , Undo
, or Redo controls. Reverting effectively returns features to their base condition. Undo and redo are applied to your sequence of past actions, independent of the features that are currently selected.As you continue to select and paint features, track scenario development progress using the scenario canvas summary charts. This is useful for building scenarios that meet control totals for new growth.
Enter Report mode and select Summary Statistics to view comparative statistics for your scenario. The charts in this mode allow you to compare scenarios with each other.
Enter Analysis mode and run analysis modules as needed. You can run analysis to gauge impacts, for example land consumption, as you develop a scenario. Note that once you make land use changes any prior analysis runs will become outdated; the status as to whether results are current or outdated is indicated in Analysis and Report modes.
Track Scenario Paints
Analyst keeps track of what canvas features have been painted, or gridded, with a series of column values in the base and scenario canvases. These paint tracking or "modification flags" allow you to identify, at any point in scenario development, features that have been painted or gridded. The columns appear at the end of the data table, and contain Yes or No values depending on whether individual features have been painted or gridded. The modification flags include:
Modification flag | Description |
|---|---|
Modified from Original | Indicates whether a feature has been painted or gridded in any way. |
Modified: Gridded | Indicates whether a feature has been created using a gridding operation. |
Modified: Type Paint | Indicates whether a feature has been painted to have a new Building or Place Type name. This can apply whether the feature has been painted by type or attribute, and independent of whether the base residential and employment values have been modified. |
Modified: Employment Attributes | Indicates whether a feature has been painted by attribute to set employment values, including jobs and non-residential building area. |
Modified: Residential Attributes | Indicates whether a feature has been painted by attribute to set residential values, including dwelling units and residential building area. |
Values for modification flags are set to Yes when you paint or grid features according to flag criteria. If you undo a painting or gridding action, or revert a feature to its base condition, the corresponding flag(s) will be reset to No.
With the modification flags, you can filter your canvas as you would for other columns and values to select features, and subsequently use the selection in summarizing data (for example, to see the land area of all painted parcels) and mapping.
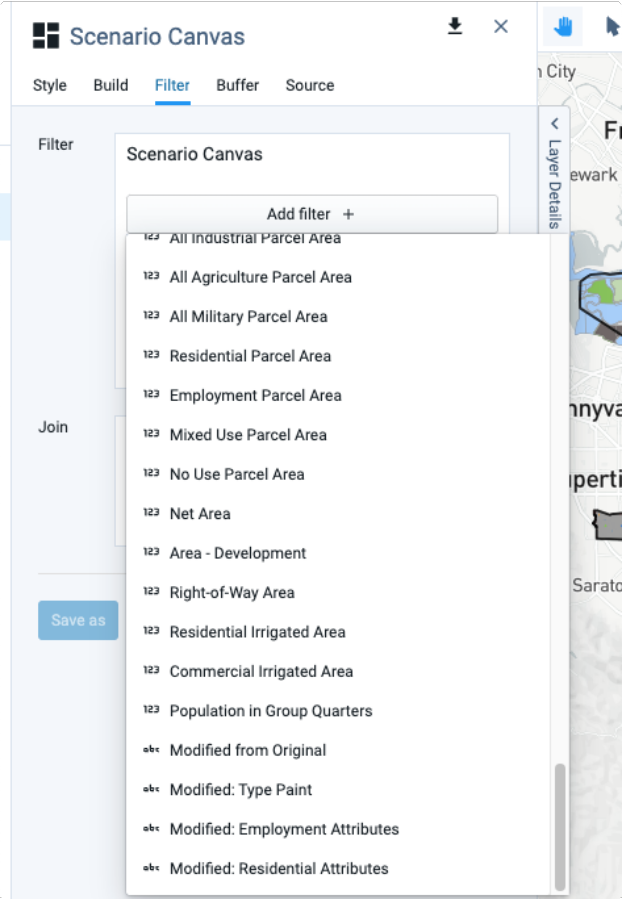 |
Filtering using the modification flags
Note that you can also set your scenario layer to show only the features that you’ve painted by selecting the Show only painted geometries option in the Layer Options menu for the Scenario Canvas.
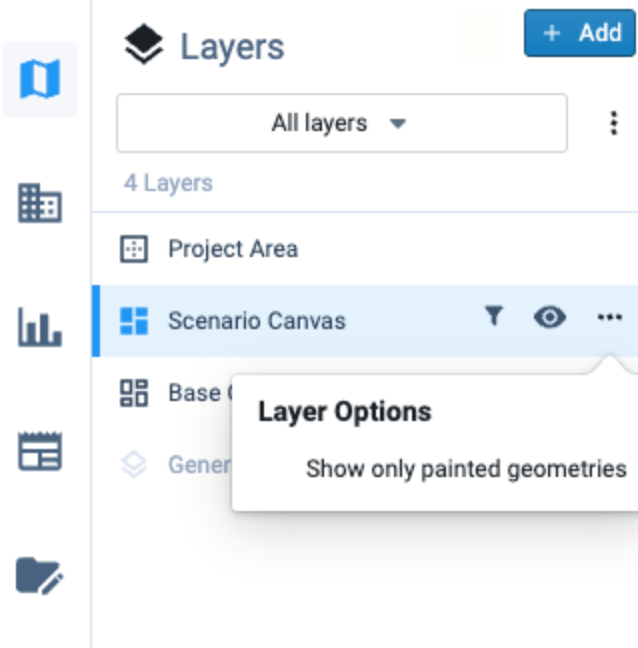 |
Option to view painted features only
Note
The modification flag columns replace the “Painted” column previously used to indicate whether a feature has been painted.