Current and Future Severe Drought
The UrbanFootprint Current and Bias-Corrected Future Severe Drought model provides current and bias-corrected future frequencies of severe drought in months per decade. Severe drought is where impacts start to become substantial; for example, crop or pasture loss is likely, water shortages are common, and water restrictions are imposed. You can use our severe drought frequency in conjunction with Built Environment data such as population and property to understand a location’s exposure to drought both now and in the future.
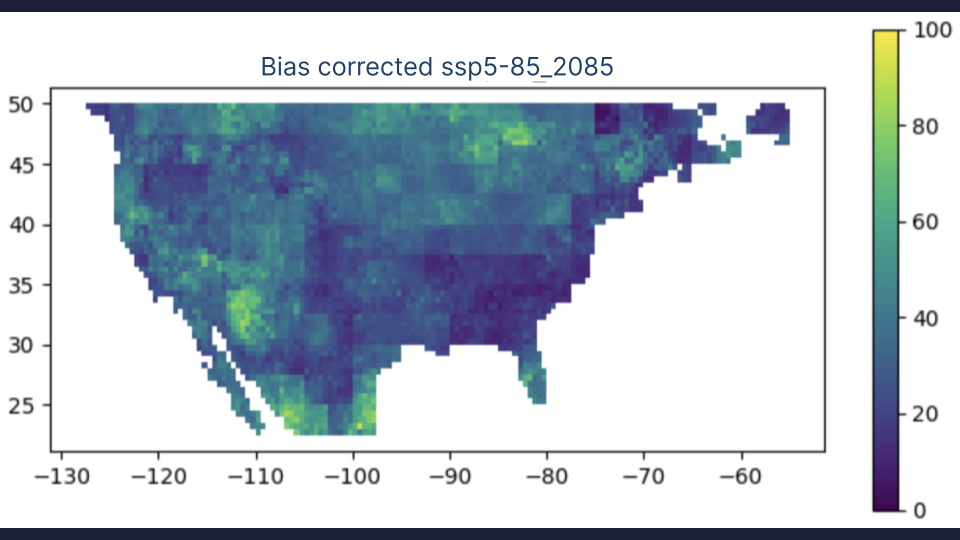 |
Severe drought defined as less than -3 in 2085 under the SSP5-85 scenario
Availability: Location Insights | Climate & Hazard Insights
Drought causes billions of dollars of economic loss to the US each year, with hundreds of millions of acres of agriculture exposed to some level of drought conditions. Severe drought in the US is associated with several impacts . For example, crop or pasture loss is likely, water shortages are common, and water restrictions are imposed. However, there is regional variability in the impacts of drought.
Furthermore, drought impacts are changing with the climate, and current drought patterns and risks may be underrepresenting the future risk of drought. The future climate is known to get warmer, and warmer worlds generally are wetter. The amount of moisture an atmosphere can hold is directly related to its temperature. However, future soil moisture increases will be distributed unevenly, and many locations are expected to become drier. A common paradigm in the literature is that the dry gets drier, and the wet gets wetter (Held and Soden, 2006). However, that is a rule of thumb with many caveats, and climate model simulations are required for the best estimates of future drought conditions. Over the United States, drought is widely expected to increase, and process-based climate model output is needed to quantify this changing risk effectively.
We use the self-calibrating variant of the Palmer Drought Severity Index (scPDSI) to estimate drought in the United States. The scPDSI is the drought index that has been used the longest to estimate drought conditions. It reflects both the supply and demand portions of soil moisture, making it well-suited to project into the future.
Historial and Current Drought
We report the frequency of severe drought in months per decade because that is a threshold at which the impacts become substantial. In the scPDSI, negative values indicate drought, and a value of -3 is considered severe drought. We use the CRU scPDSI historical data from 1900-2020 to represent current risk. This dataset is global in extent and available at 0.5° x 0.5° latitude/longitude resolution. Other scPDSI datasets are available, including those from the US drought monitor. However, the US drought monitor dataset does not include AK and HI and only extends back to 1980.
Using the historical data from 1900-2020 creates an inherent assumption that past drought reflects current drought frequency. Given climate change, this assumption is biased but generally acceptable for two reasons:
Historical change in climate is small compared to the next 80 years.
Drought and many other climate variables have substantial variability on annual to decadal time periods. Extending the dataset's length gives more accurate approximations of the drought distribution. We calculate the current frequency of severe drought from the monthly time series of scPDSI for each grid cell between 1900 and 2020.
Bias-Correct Future Drought
We also calculate a bias-corrected future severe drought using the multimodal mean scPDSI from 25 CMIP6 models from Zhao and Dai (2022). This dataset is provided at 2.5° x 2.5° resolution. CMIP6 is considered the "state of the art” for understanding future climate. However, global models have intrinsic biases that add uncertainty to the projection. Specifically, the multi-model mean has much less variability and, thus, less severe drought months than the observations for the same historical period (Figure 2). In other words, the observed data indicates a greater range of drought than what the muti-model mean predicts.
Comparison of Modeled and Observed Drought illustrates the issue of the biases comparing the temporal distributions of scPDSI in the CMIP6 multi-model mean between 1900-2012 (end of the historical period) with the observed drought scPDSI between 1900-2020 for each grid cell. The green line in both plots indicates the threshold for severe drought (an scPDSI < -3). Each curve in the plot represents the cumulative distribution of the scPDSI for a given pixel. Thus, the value of the curve where it intersects the green line tells you the probability of a severe drought in a given year. Based on the historical observations, the CMIP6 data exhibits a range that is compressed more than expected. For example, in the CMIP6 model, most of the modeled historical distributions are close to 0 at the green line (meaning that the model estimates very little severe drought). For the actual historical record, the chance of severe drought ranges from 0.05 to approximately 0.6 (or more than half the time) for some areas. These plots indicate that CMIP6 produces low drought estimates relative to actual observed historical drought. While the UrbanFootprint dataset attempts to correct for the bias in CMIP6, bias correction is imperfect.
There are a few reasons why the CMIP6 multi-model mean has a narrower range. First, the model is at a coarser resolution, so areas that may be very dry or wet are getting averaged with the surrounding environments. Secondly, the multi-model mean reduces the variance within any given model.
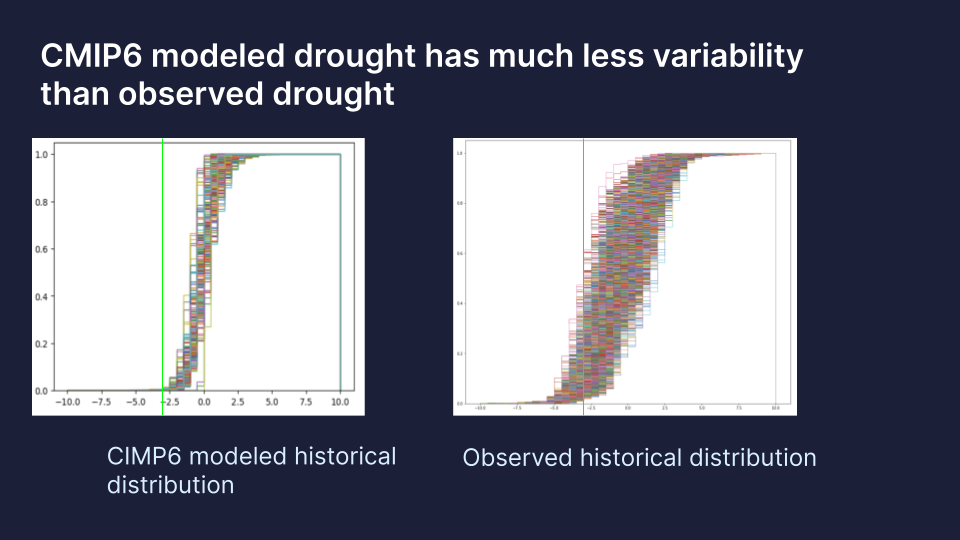 |
The cumulative distribution function of historical scPDSI at each grid cell in the CMIP6 multimodal mean (left) and CRU scPDSI dataset (right). The lack of extremes in the multimodal mean is apparent.
However, the CMIP6 multimodal mean does show meaningful change in severe drought risk. To preserve the higher spatial resolution (from CRU scPDSI) and reduce bias from the CMIP6 mean, we calculate the future change in months per decade of severe drought between the future scenarios and historical simulation in each grid cell and add that difference to our observation-based estimate of severe drought. This approach assumes that the models, specifically the multi-model mean, are better at predicting change than the absolute values. This assumption is widely supported in the literature, and bias correction is common practice (Thrasher et al., (2023), Larson et al. (2017), Forster et al., (2013), Navarro-Racines et al. (2020)).
We use 30-year windows to calculate the mean for a given future time period. For example, if over 30 years there were a total of 30 months of severe drought, then the reported value would be 10 months per decade. Months per decade here are units and do not correspond to the number in any given 10-year period. We calculate the drought frequency for the following scenarios and time periods.
Scenarios
SSP2-45 (roughly equivalent to CMP5 RCP4.5)
SSP5-85 (roughly equivalent to CMIP5 RCP8.5)
Timeframes
Current (1900-2020)
2030 (2016-2045)
2050 (2036-2065)
2085 (2070-2099)
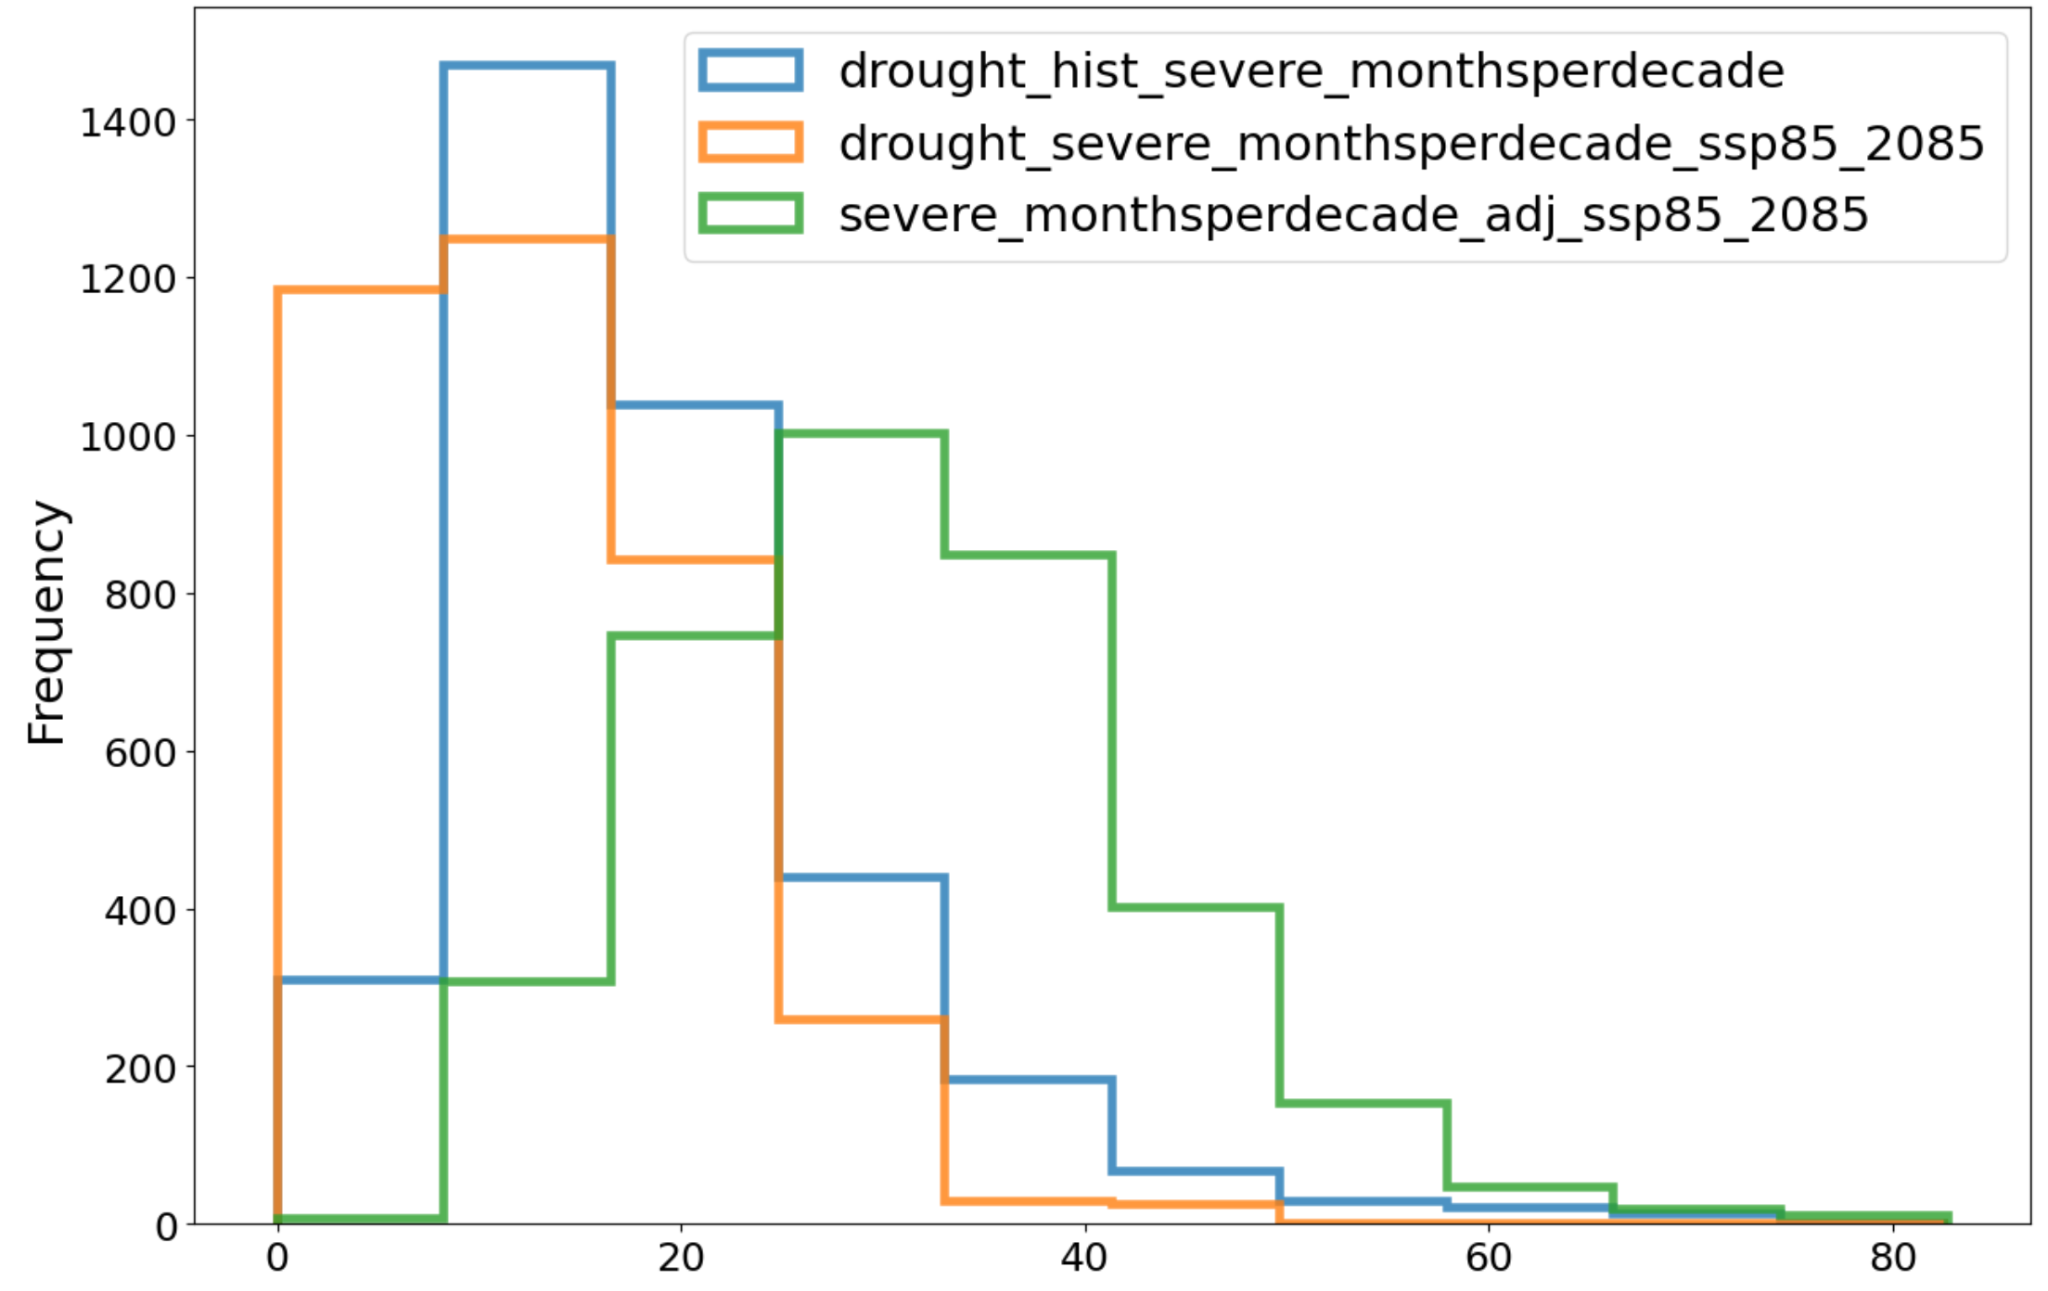 |
Spatial histograms of observation-based current (blue), CMIP6 mult-model future (orange), and bias-corrected future severe drought months per decade.
Parcel Intersections and Census Aggregations
As described in the Hazard Summaries we intersect our gridded drought metrics with the UrbanFootprint parcel canvas and assign the highest intersect risk to that parcel. So, if a parcel spans two grid cells with 11 and 14 months per decade of severe drought, the parcel will be assigned a value of 14. We also calculate the area-weighted mean hazard value at census geographies such as county, tract, block group, or others. For example, suppose a county intersects three hazard grids. In that case, the mean value for the county will be calculated by summing the hazard values multiplied by their intersection area and dividing by the total county area.
Furthermore, we aggregate our parcel estimates of severe drought to census geographies to estimate exposure above a threshold or aggregation bin. For example, we would sum the population of all parcels in a county with severe drought frequencies of 36+ months per decade to give us the total population exposed to that threshold. Thus, we provide data for:
Parcel – The number of months per decade exposed to severe drought under several climate scenarios.
Census geography exposures – Percent exposure to severe drought at 36 and 48 months per decade under several climate scenarios.
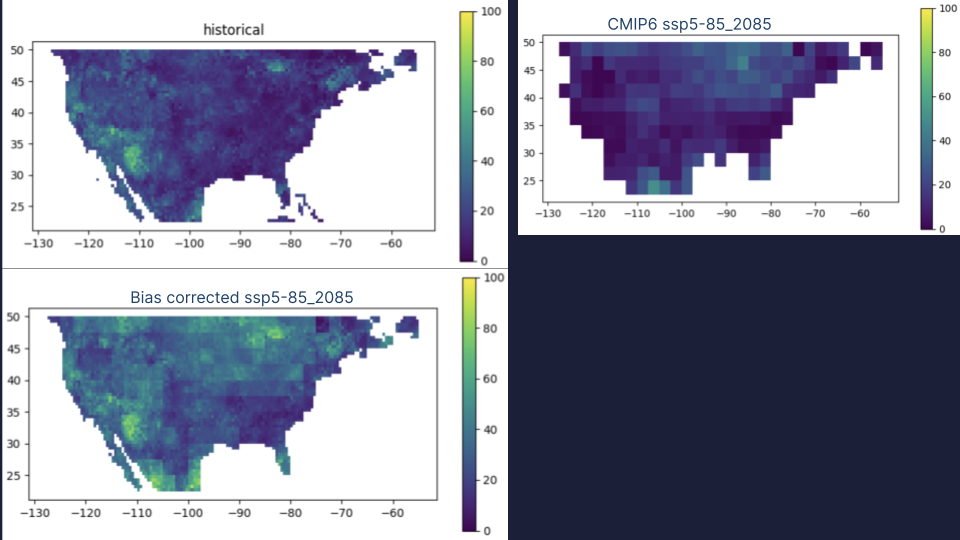
In our future drought dataset, we see that the whole of the contiguous United States (CONUS) is experiencing drying, with the upper midwest experiencing the most change in severe drought months per decade, increasing by about 20-40 months (see Comparisons of Historical, Modeled Future, and Bias-Corrected Future Drought across CONUS). This pattern is broadly consistent with other studies of future drought change (Vicente-Serrano et al. (2024) and Gamelin et al. (2022)). Even with the increases in the upper midwest, the southwest, including Las Vegas and Phoenix, remains the area with the most severe drought months per decade.
Summary statistics of the change in drought over the US (Summary Statistics for All Locations (0.5x0.5 Lat / Long Grid Cells)) highlight some of the changes. Across the US, the mean months of severe drought per decade increased by 70% between the historical period and 2085 in scenario SSP585. The increase doubled at the tenth percentile, while at the 90th percentile, it increased by 50%. The takeaway is that even wet locations are substantially more likely to experience severe drought in a warmer future world.
 |
Mean months of severe drought per decade | Percentile months of severe drought per decade | Standard deviation | Resolution (N grid cells) | |||||
|---|---|---|---|---|---|---|---|---|
10 | 25 | 50 | 75 | 90 | ||||
Historical | 18.35 | 8.4 | 11.4 | 16.3 | 22.8 | 30.7 | 9.9 | 0.5 x 0.5° (4509) |
CMIP6 (SSP5-85, 2085) | 12.7 | 2.1 | 6.2 | 11.7 | 18.3 | 23.8 | 8.4 | 2.5 x.2.5° (190) |
Bias-Corrected Future (SSP5-85, 2085) | 31.4 | 16.9 | 22.9 | 30.9 | 38.4 | 45.7 | 11.5 | 0.5 x 0.5° (4509) |