Financial Insights
To conduct an analysis in the financial services industry, connect Insights to financial services, such as:
Bank Branches – the location of a public-facing bank branch.
Residential Mortgages – the location (address) of the mortgage.
Small Business Loans– the location (address) of the business with the loan.
Use Case
You can use a Financial Insights location assessment to track progress towards compliance with government regulations, such as Fair Lending Acts (FLA) and the Community Reinvestment Act (CRA), and to prepare for climate disclosure (such as California climate disclosure laws and SEC regulations aligned with Taskforce on Climate-related Financial Disclosures (TCFD)).
Template
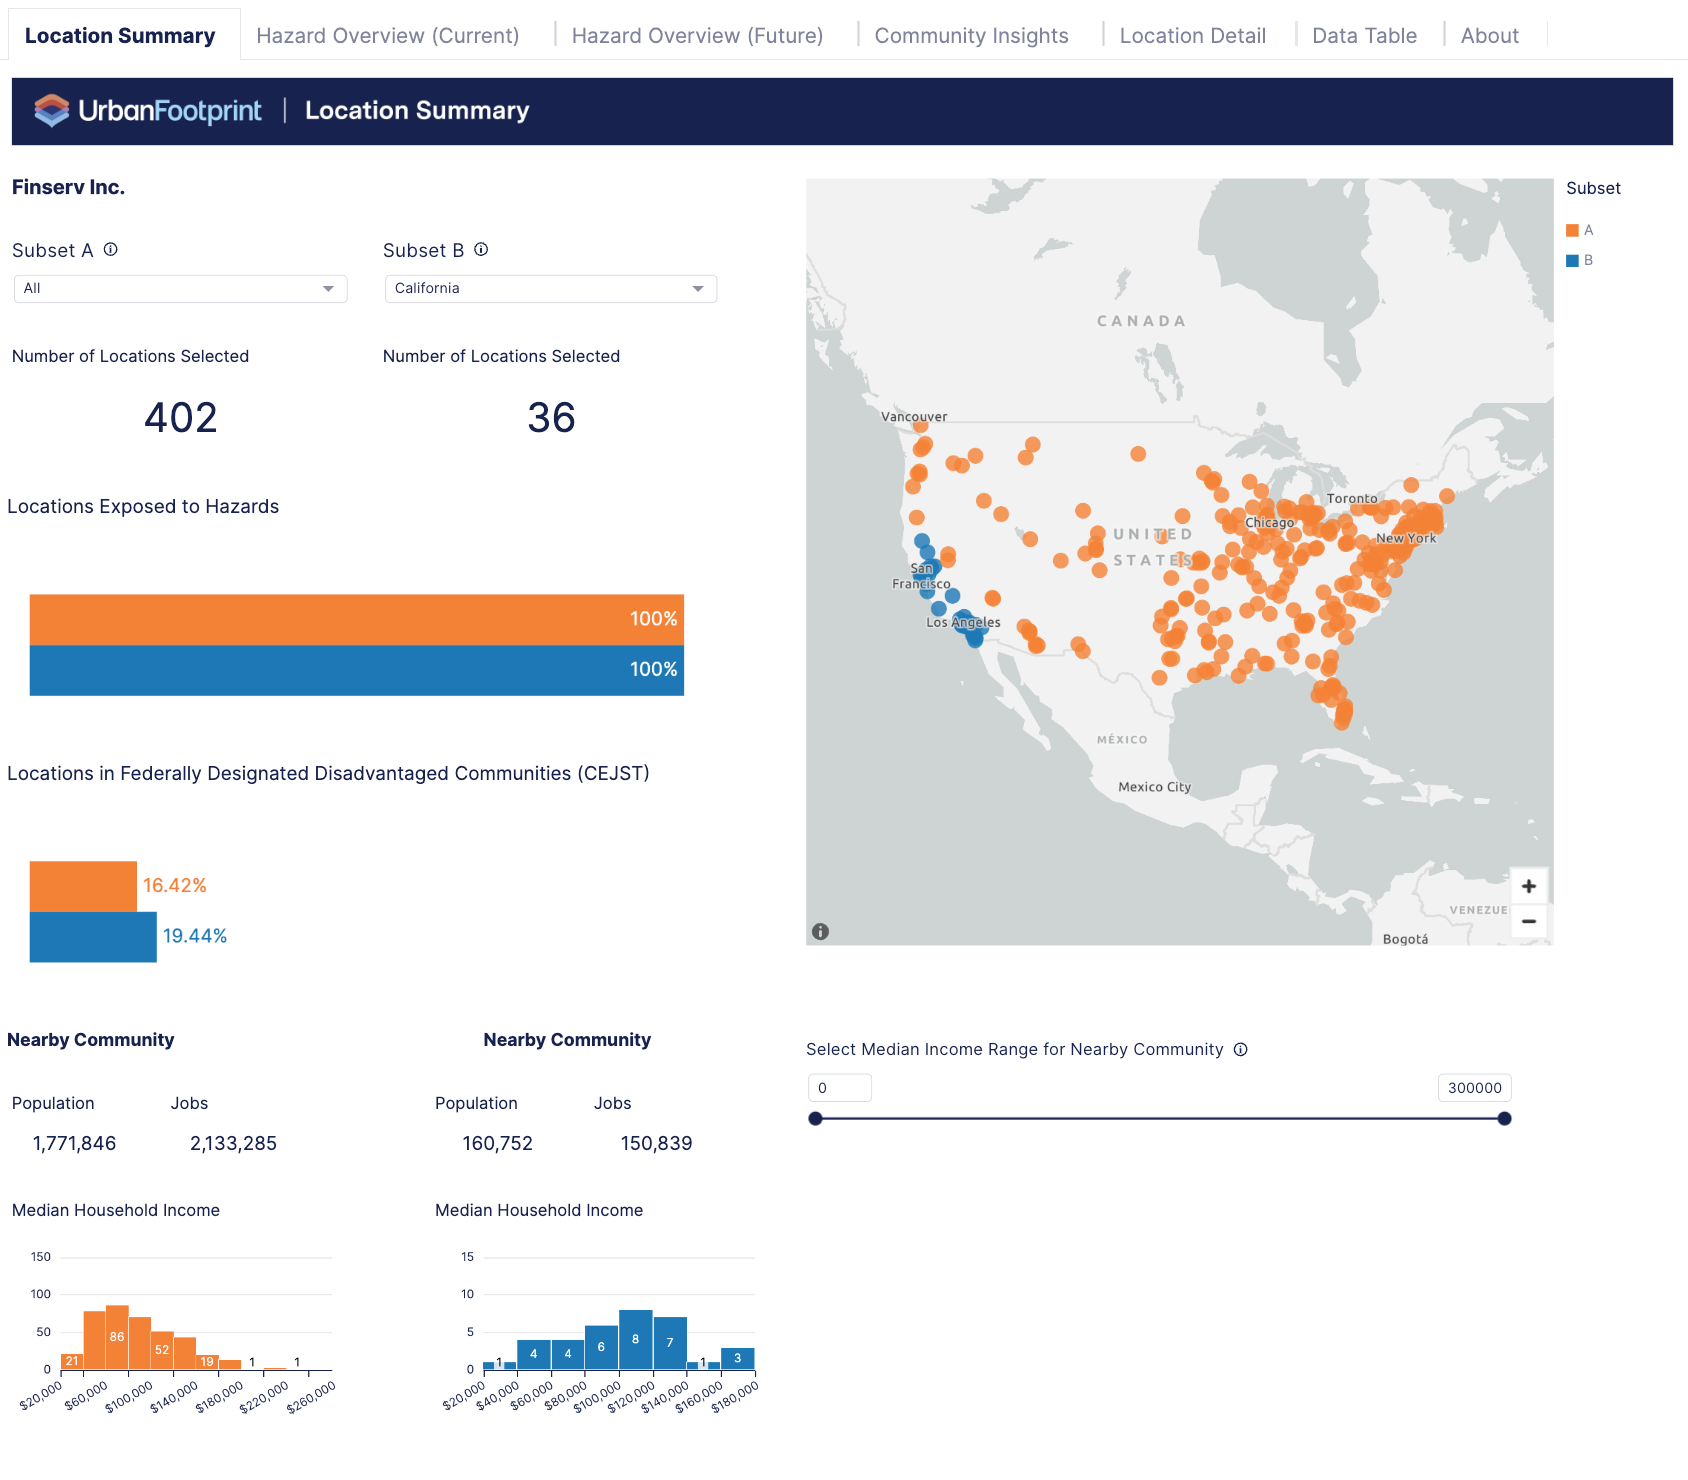 | Location Summary – provides a portfolio overview and summary of the most important high-level metrics across locations and nearby communities. Use this summary to quickly assess portfolio scale geographically and across communities and hazard risk exposure. Use the selections to view an overall summary, a subset summary, or compare subsets. |
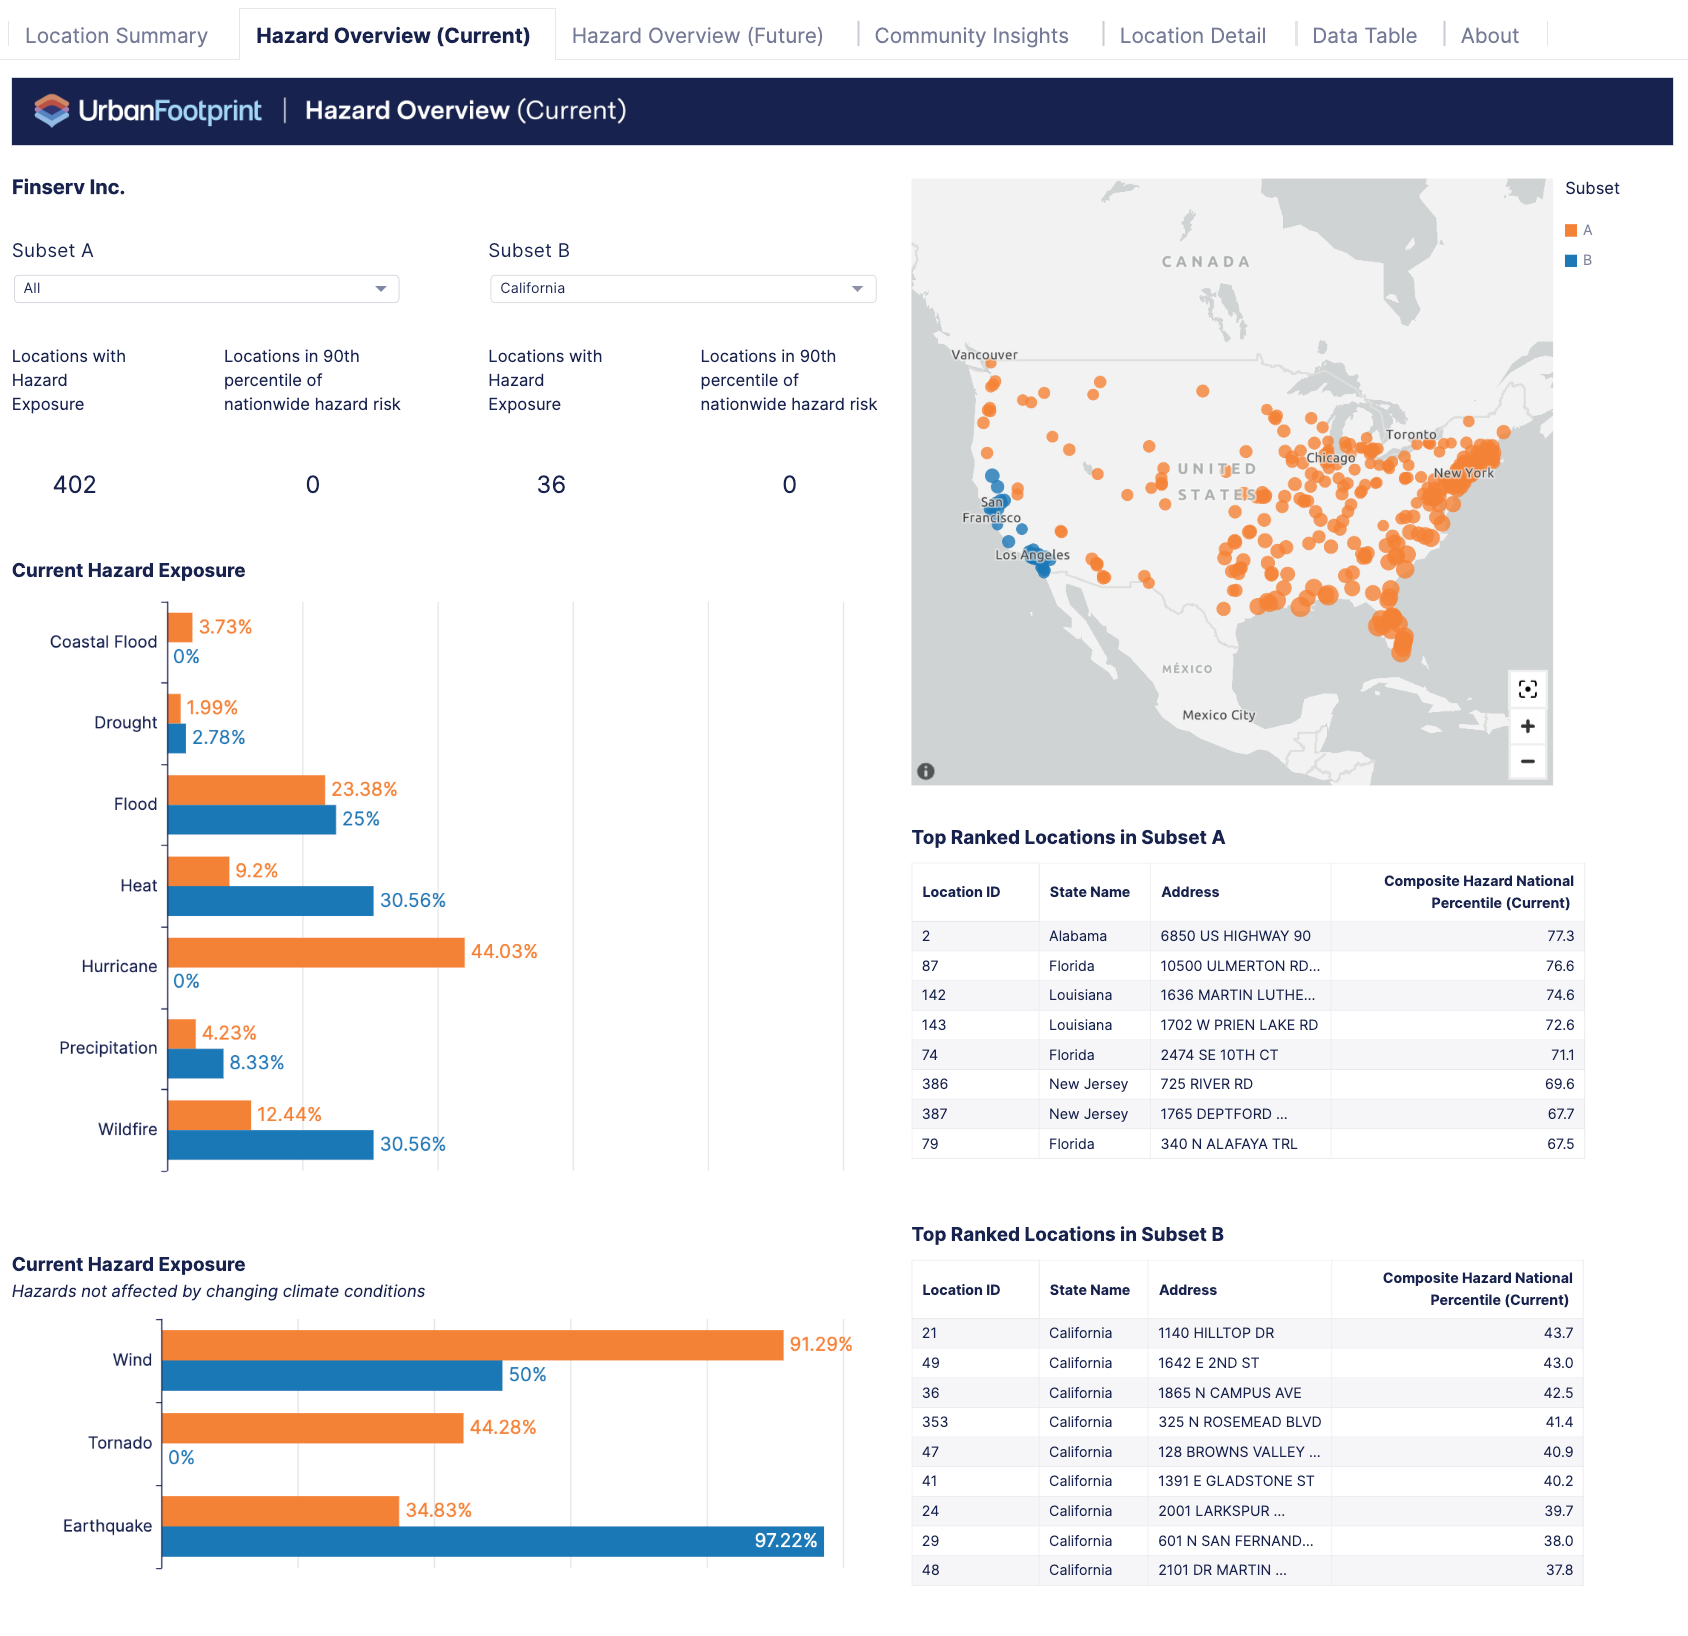 | Hazard Overview (Current) – summarizes the hazard risk to all locations in their current state. It shows which locations are at risk of climate hazards and helps you determine which hazards are the biggest concern for the business. |
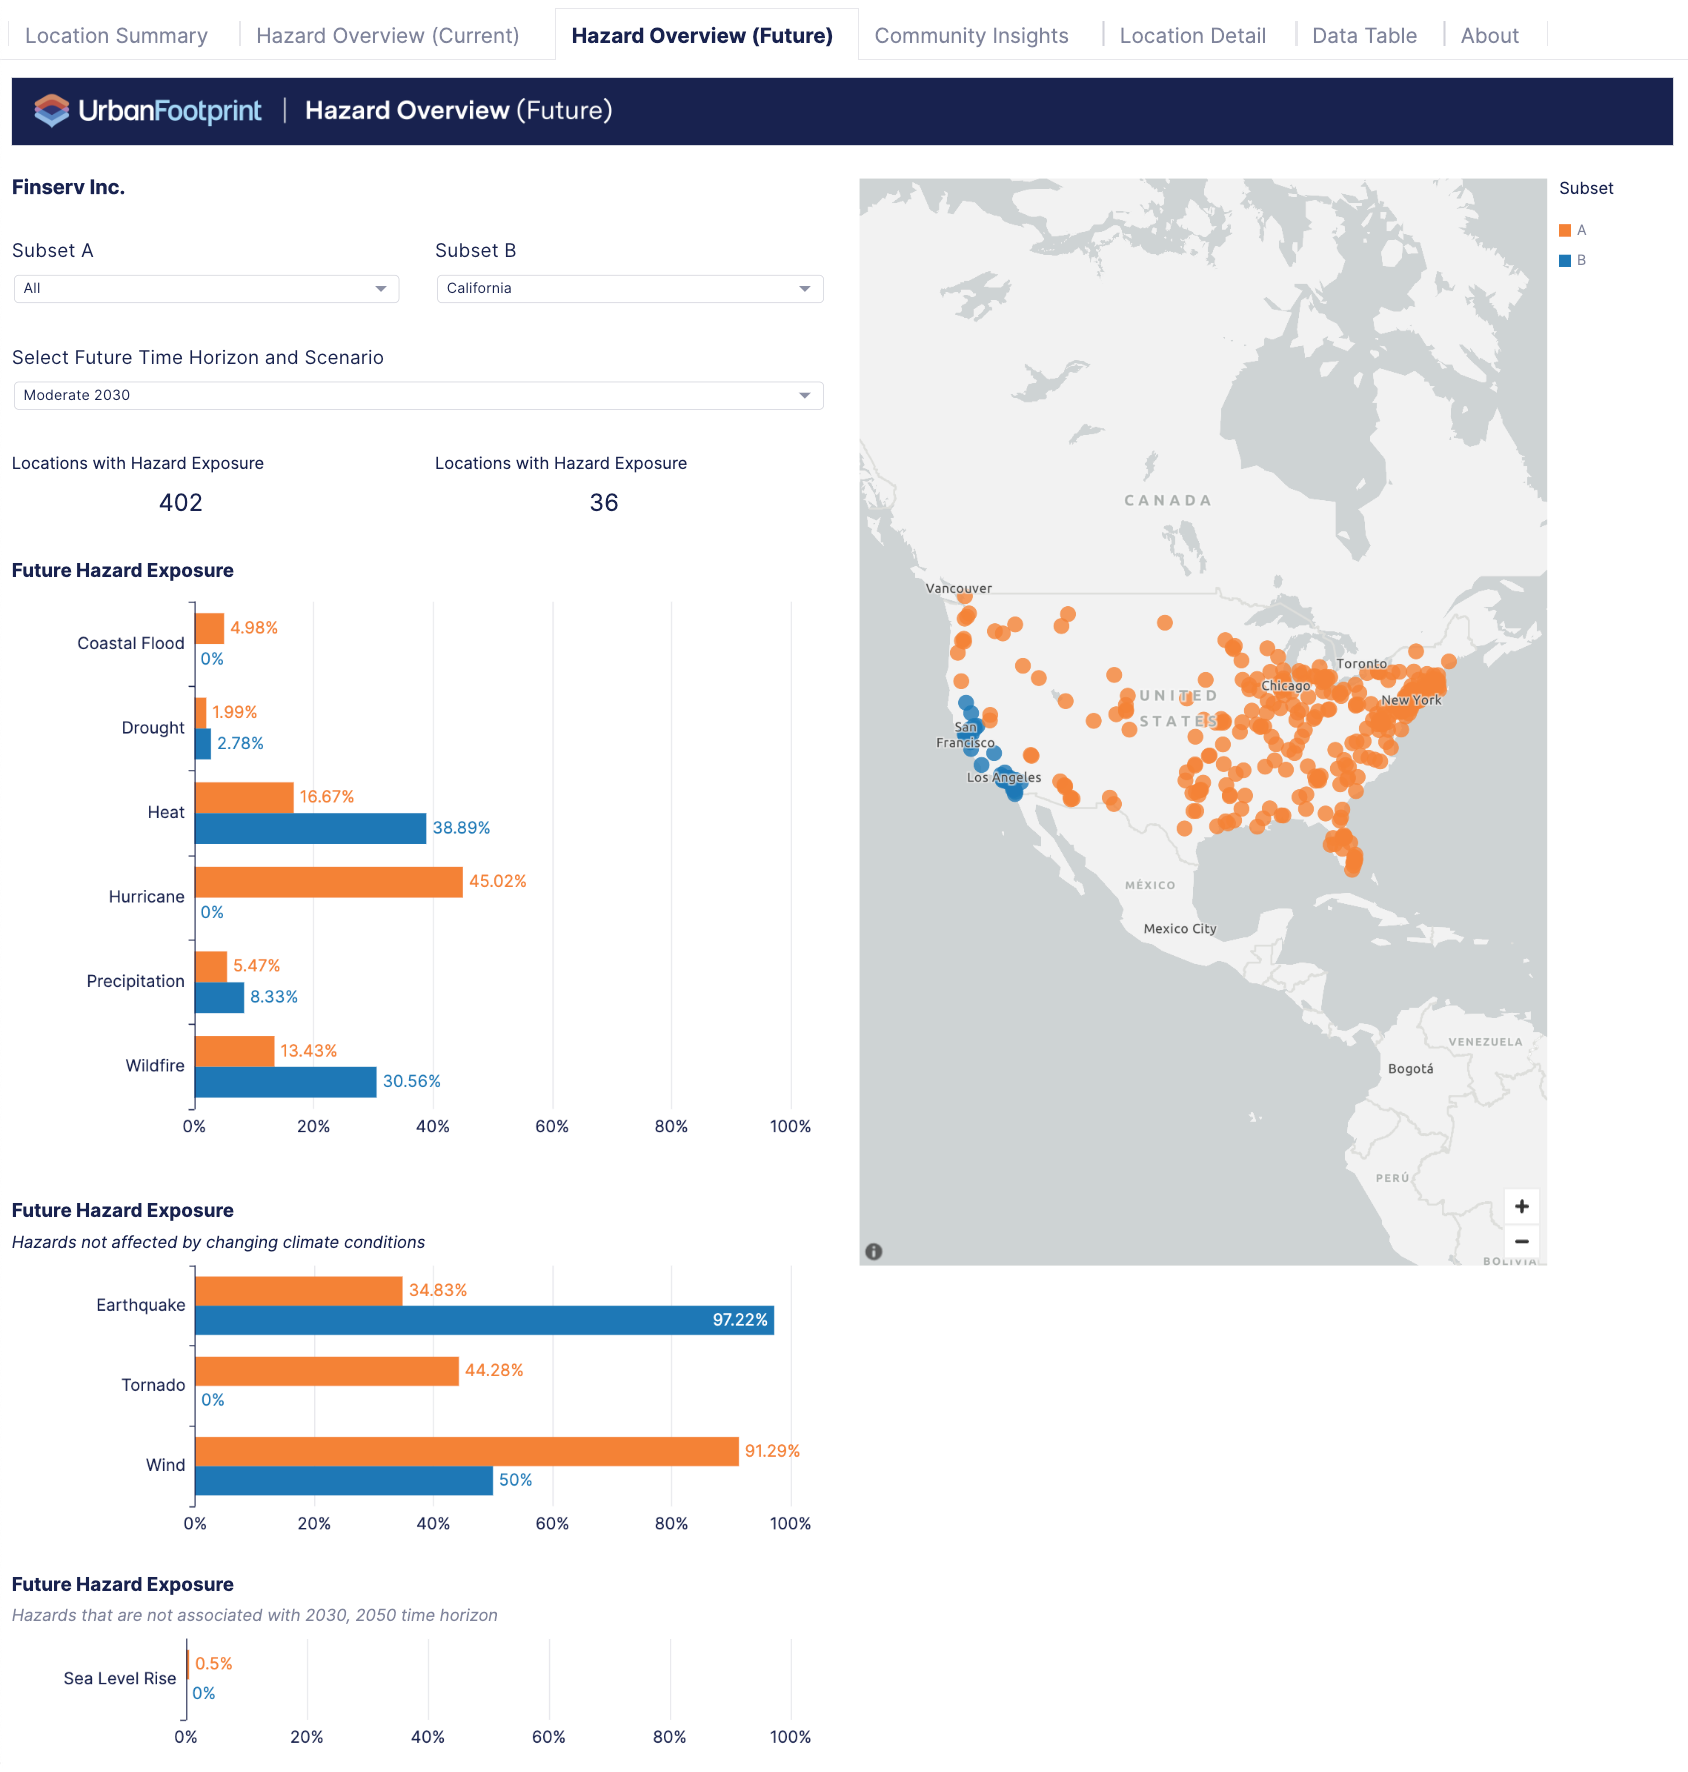 | Hazard Overview (Future) – summarizes the hazard risk to all locations under a choice of future time horizons and scenarios. It shows which locations are at risk of climate hazards and helps you determine which hazards are the biggest concern for the business. |
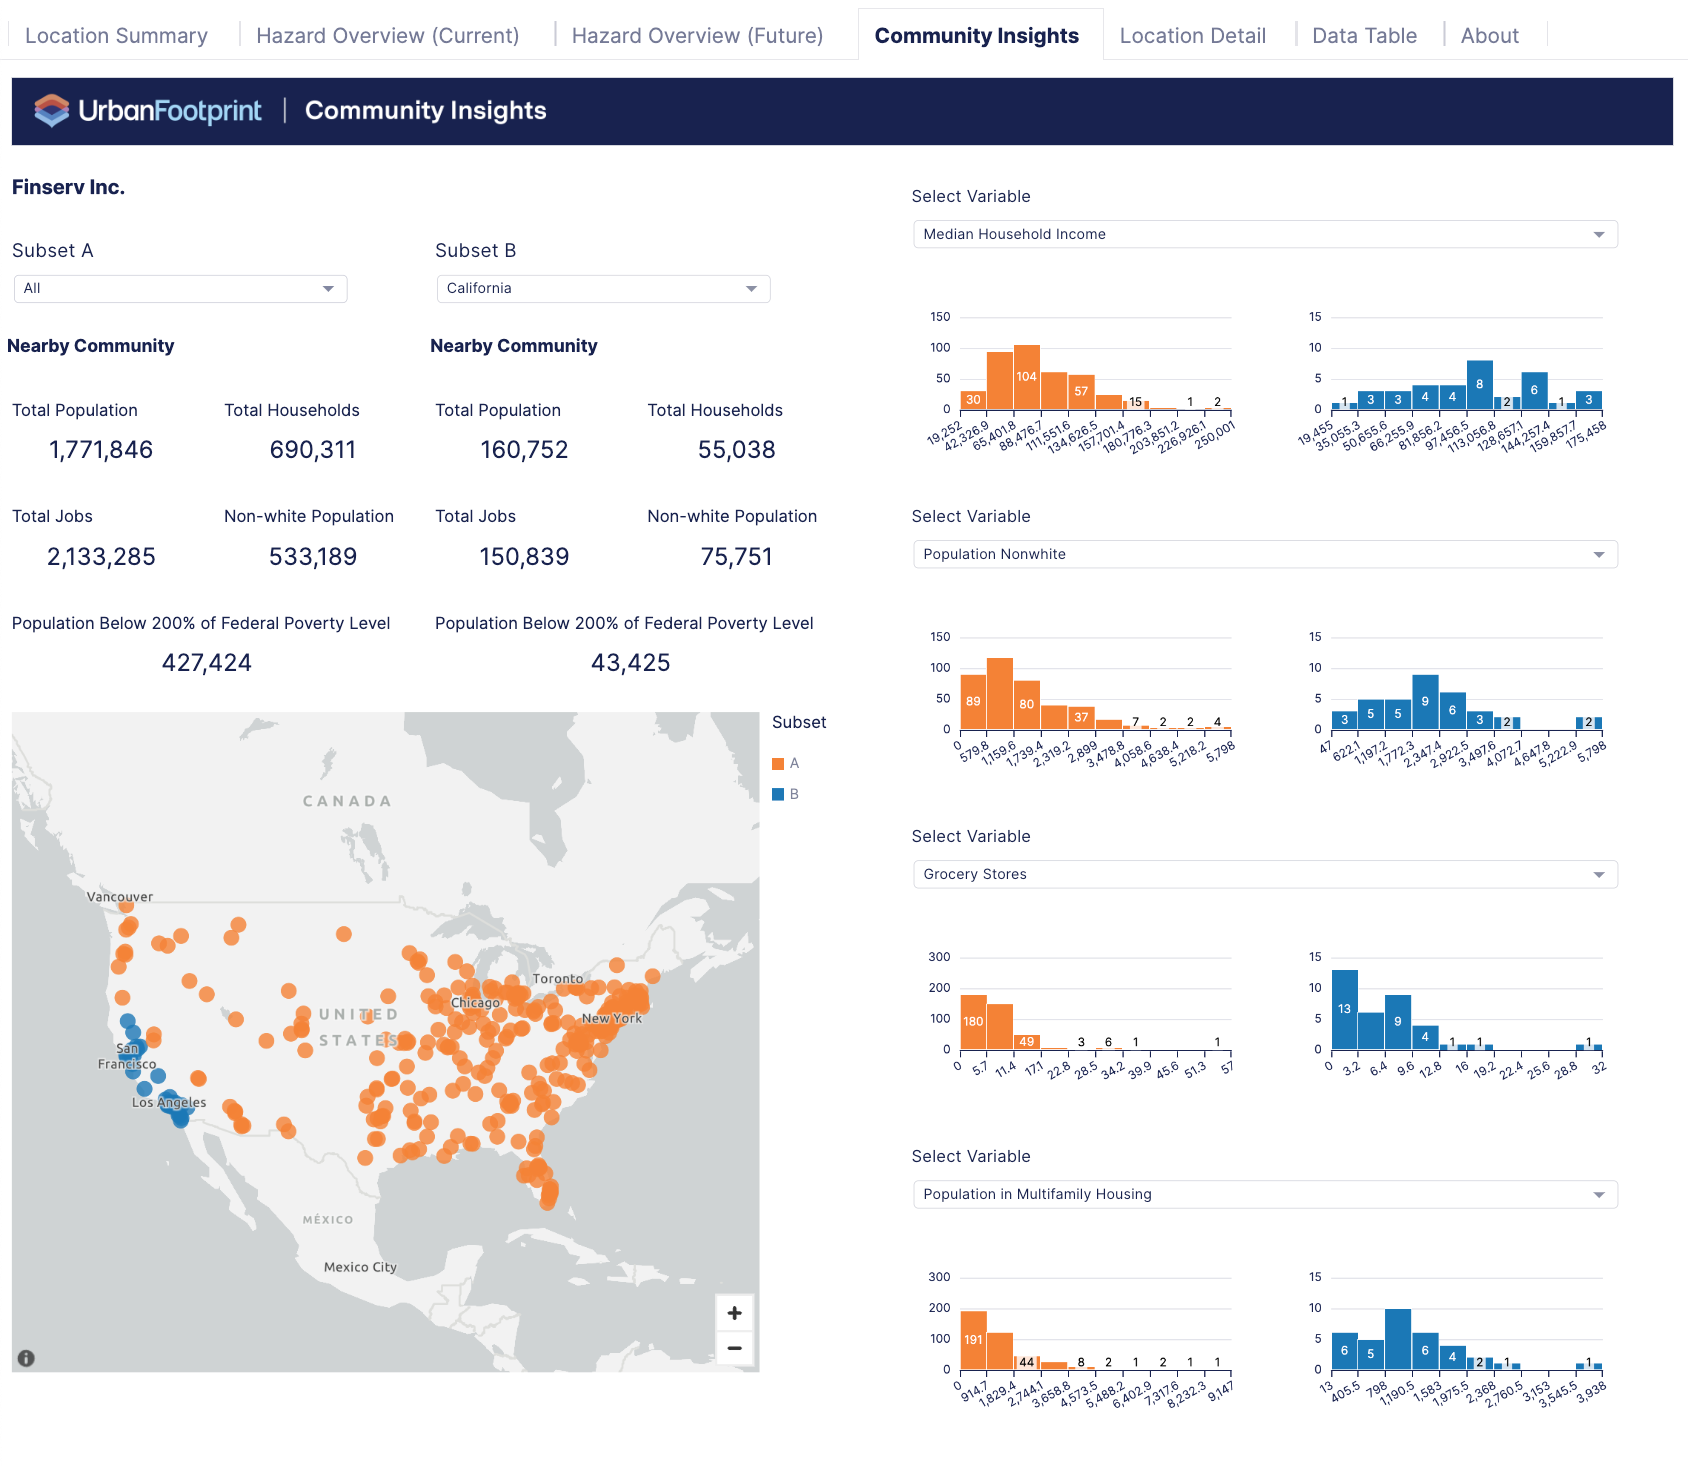 | Community Insights – builds awareness of community characteristics (Census Tract around locations) to support compliance with fair lending laws and other corporate social responsibility goals. Based on a selection of community metrics, you can view locations in communities that meet the criteria for an investment or need. |
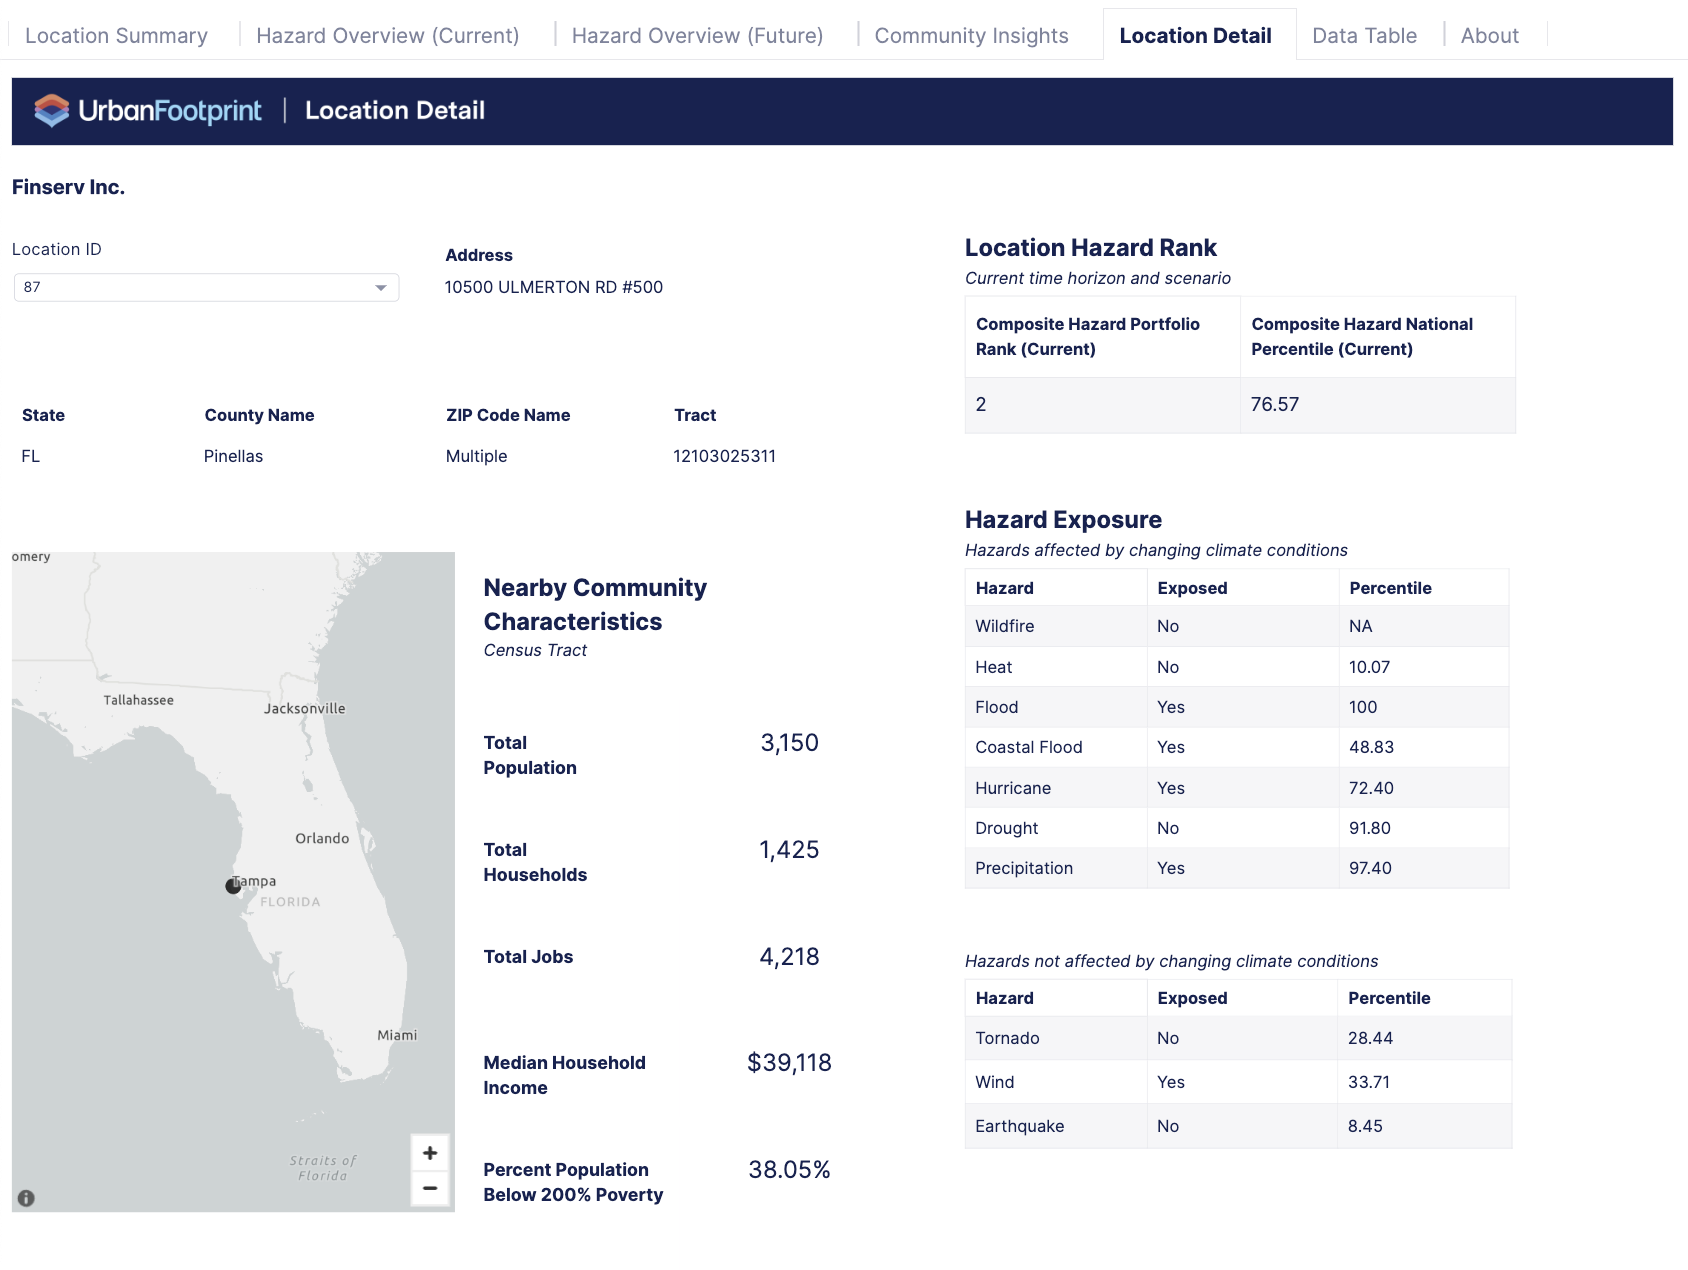 | Location Detail – provides details about a single location. You can navigate from tables in other sections directly to a specific location to view its details. You can also search for a specific location using its ID. |
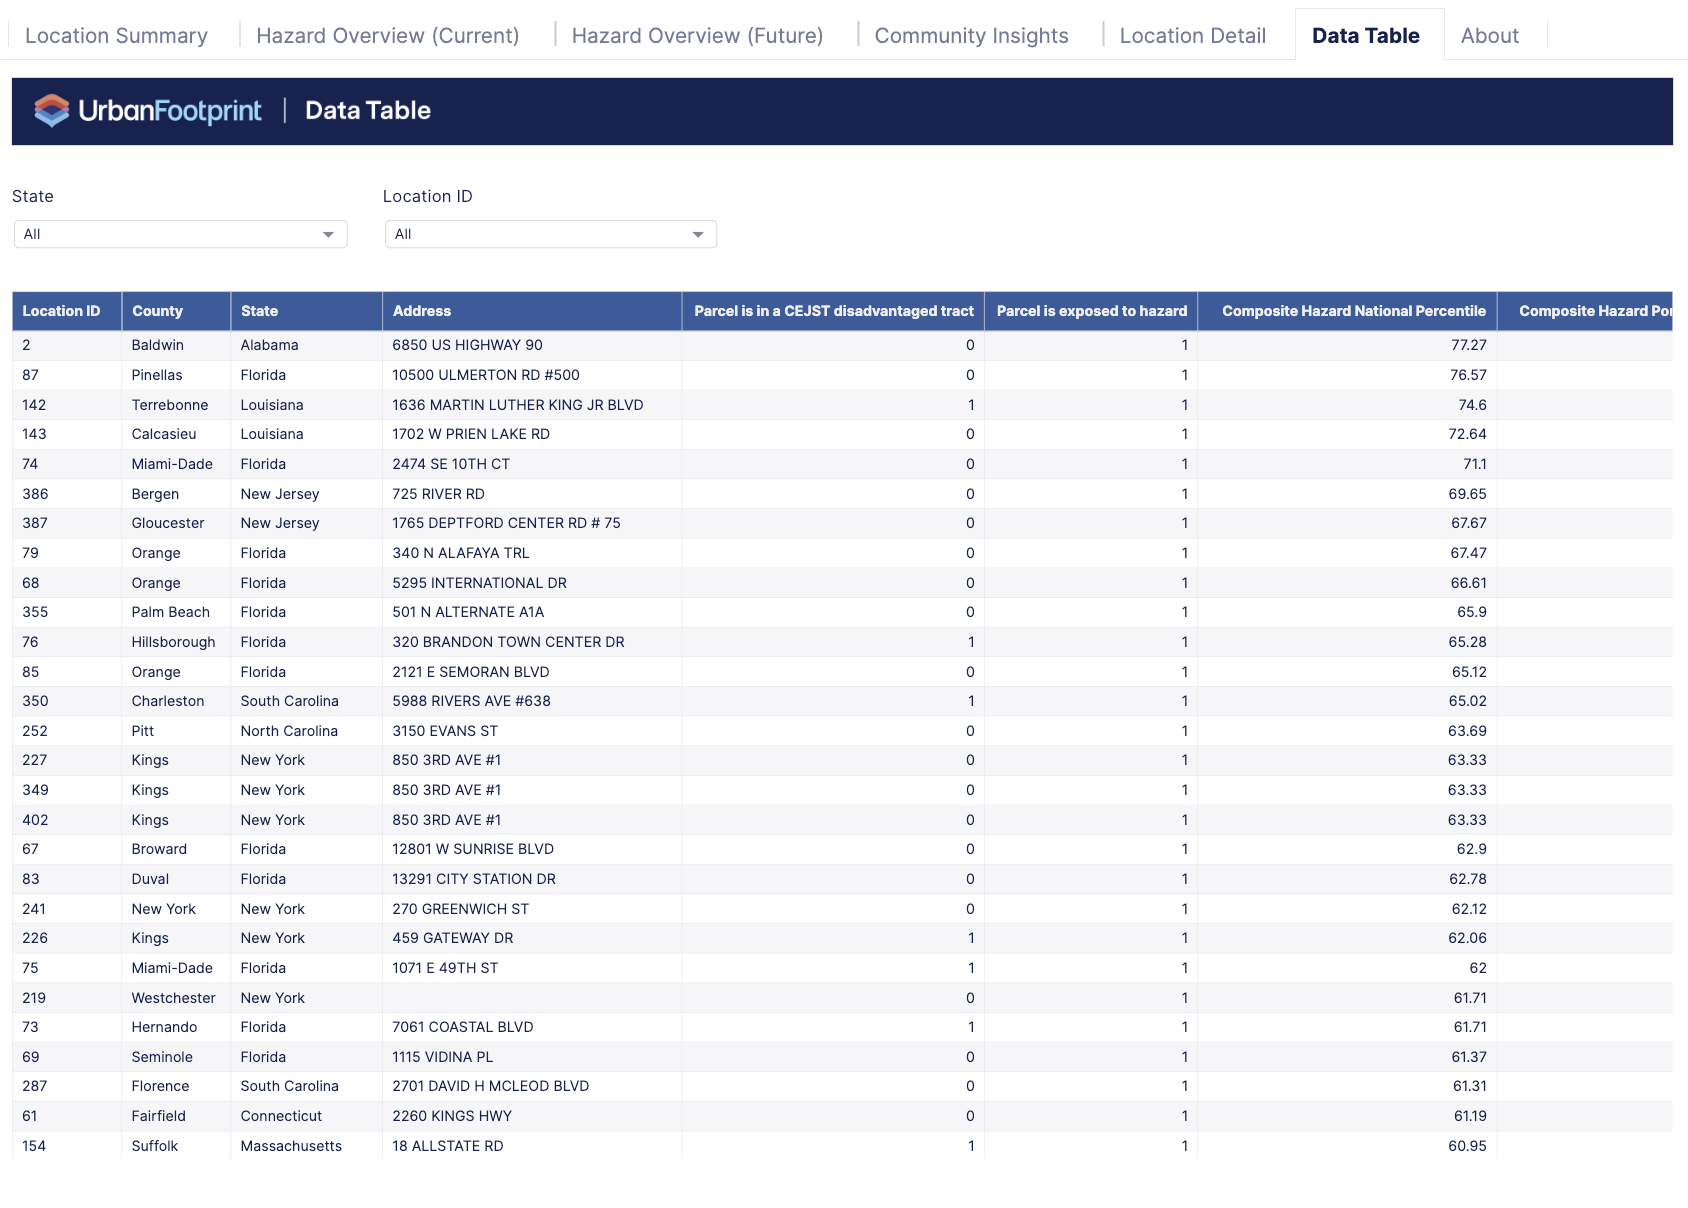 | Data Table – provides a high-level summary of key metrics and rankings. You can export this table, but the complete dataset (available in the project) includes more than what's shown in the dashboard. |
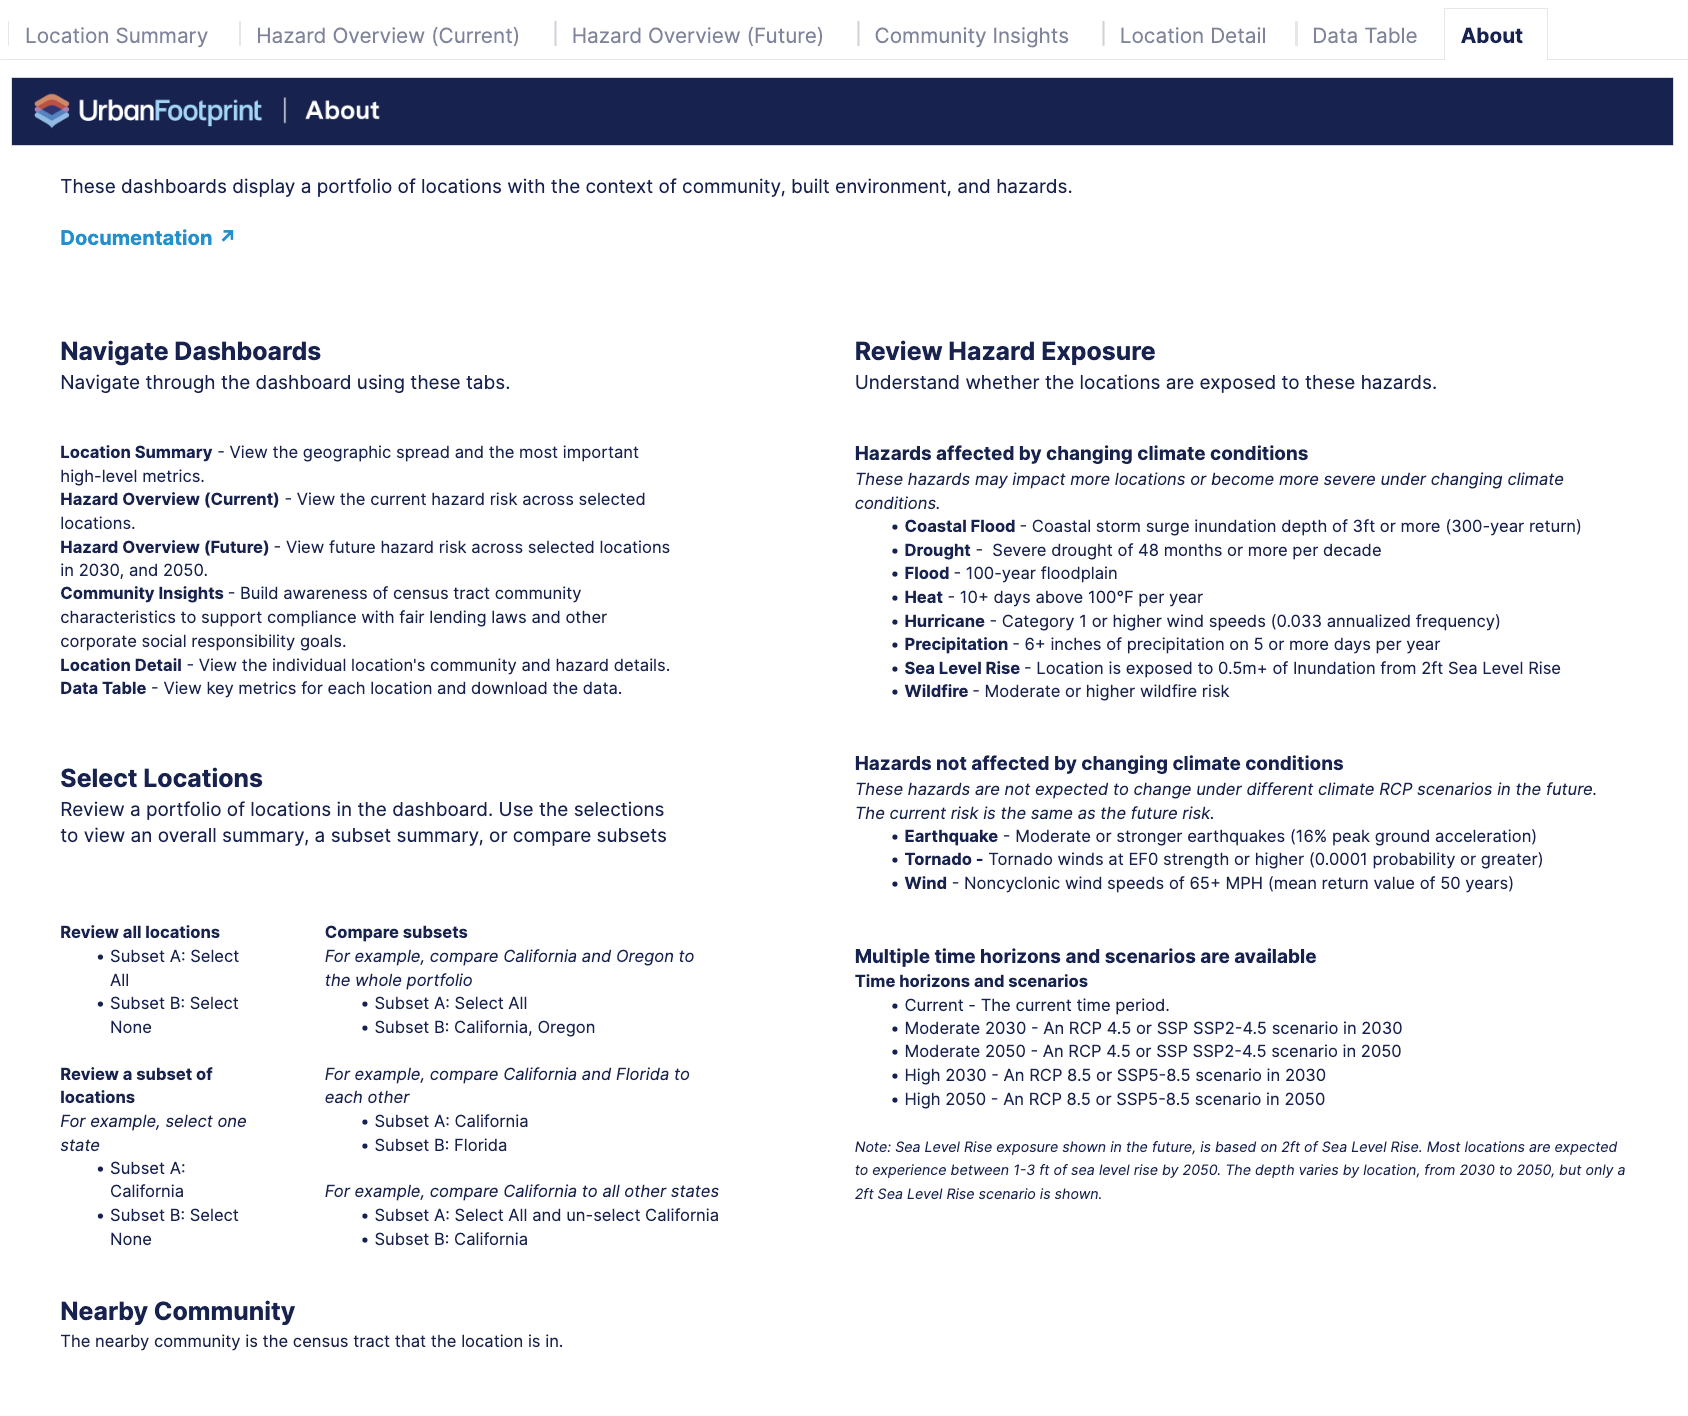 | About – provides tips about how to work with and understand the dashboards. |
Process
To run these analyses, work through the steps to collect your locations, start the analysis, and view the results. Depending on your set of locations, you may need to work closely with your UrbanFootprint contact on some of these steps. Follow this workflow to get started independently, but contact us if you have any questions. Once completed, you can easily review the portfolio analysis in the dashboard and details in Analyst.
Connect your locations to Insights with a dashboard.Process Locations
Explore your locations' Insights in dashboards and visually on maps in Analyst.Analyze Insights
Schema
We're providing a copy of the Financial Insights schema for reference. When working with data schemas, you can navigate information in them by:
Searching for terms on the page using Command ⌘+F (Mac) or Ctrl+F (Windows).
Clicking in the schema window and then copying and pasting the content into a spreadsheet application to look at the details more closely.