Walk and Transit Accessibility Analysis
The Walk and Transit Accessibility modules highlight opportunities and deficiencies in accessibility by measuring the proximity of each canvas feature (parcel or census block) to employment, population, housing, parks, schools, hospitals, retail, and transit stops within 50 kilometers of a project area. The modules are loaded with up-to-date network data for transit, walkable roads, and walk paths to support robust network-based analysis.
The modules report accessibility metrics in two forms:
Travel time, in minutes, from a parcel to the nearest point of interest (POI). This is the time necessary to reach a particular POI based on the shortest distance within the network that is provided to the module.
Number of destinations or opportunities one can reach within a specified amount of time.
Metrics include, for example, the average time needed to walk from a given parcel to the nearest hospital, or the number of jobs that can be reached on foot or by transit from that parcel within 30 minutes.
The Accessibility modules can be run on the Base Canvas and alternative scenarios. Currently, all results are based on existing roads, walk paths, and transit, and reflect changes in land use patterns as indicated by scenarios as painted.
The outputs generated by the modules allow users to assess how scenarios would change accessibility down to the resolution of individual canvas features, and how scenarios compare to each other with respect to accessibility across broader areas.
Transit Accessibility Methodology
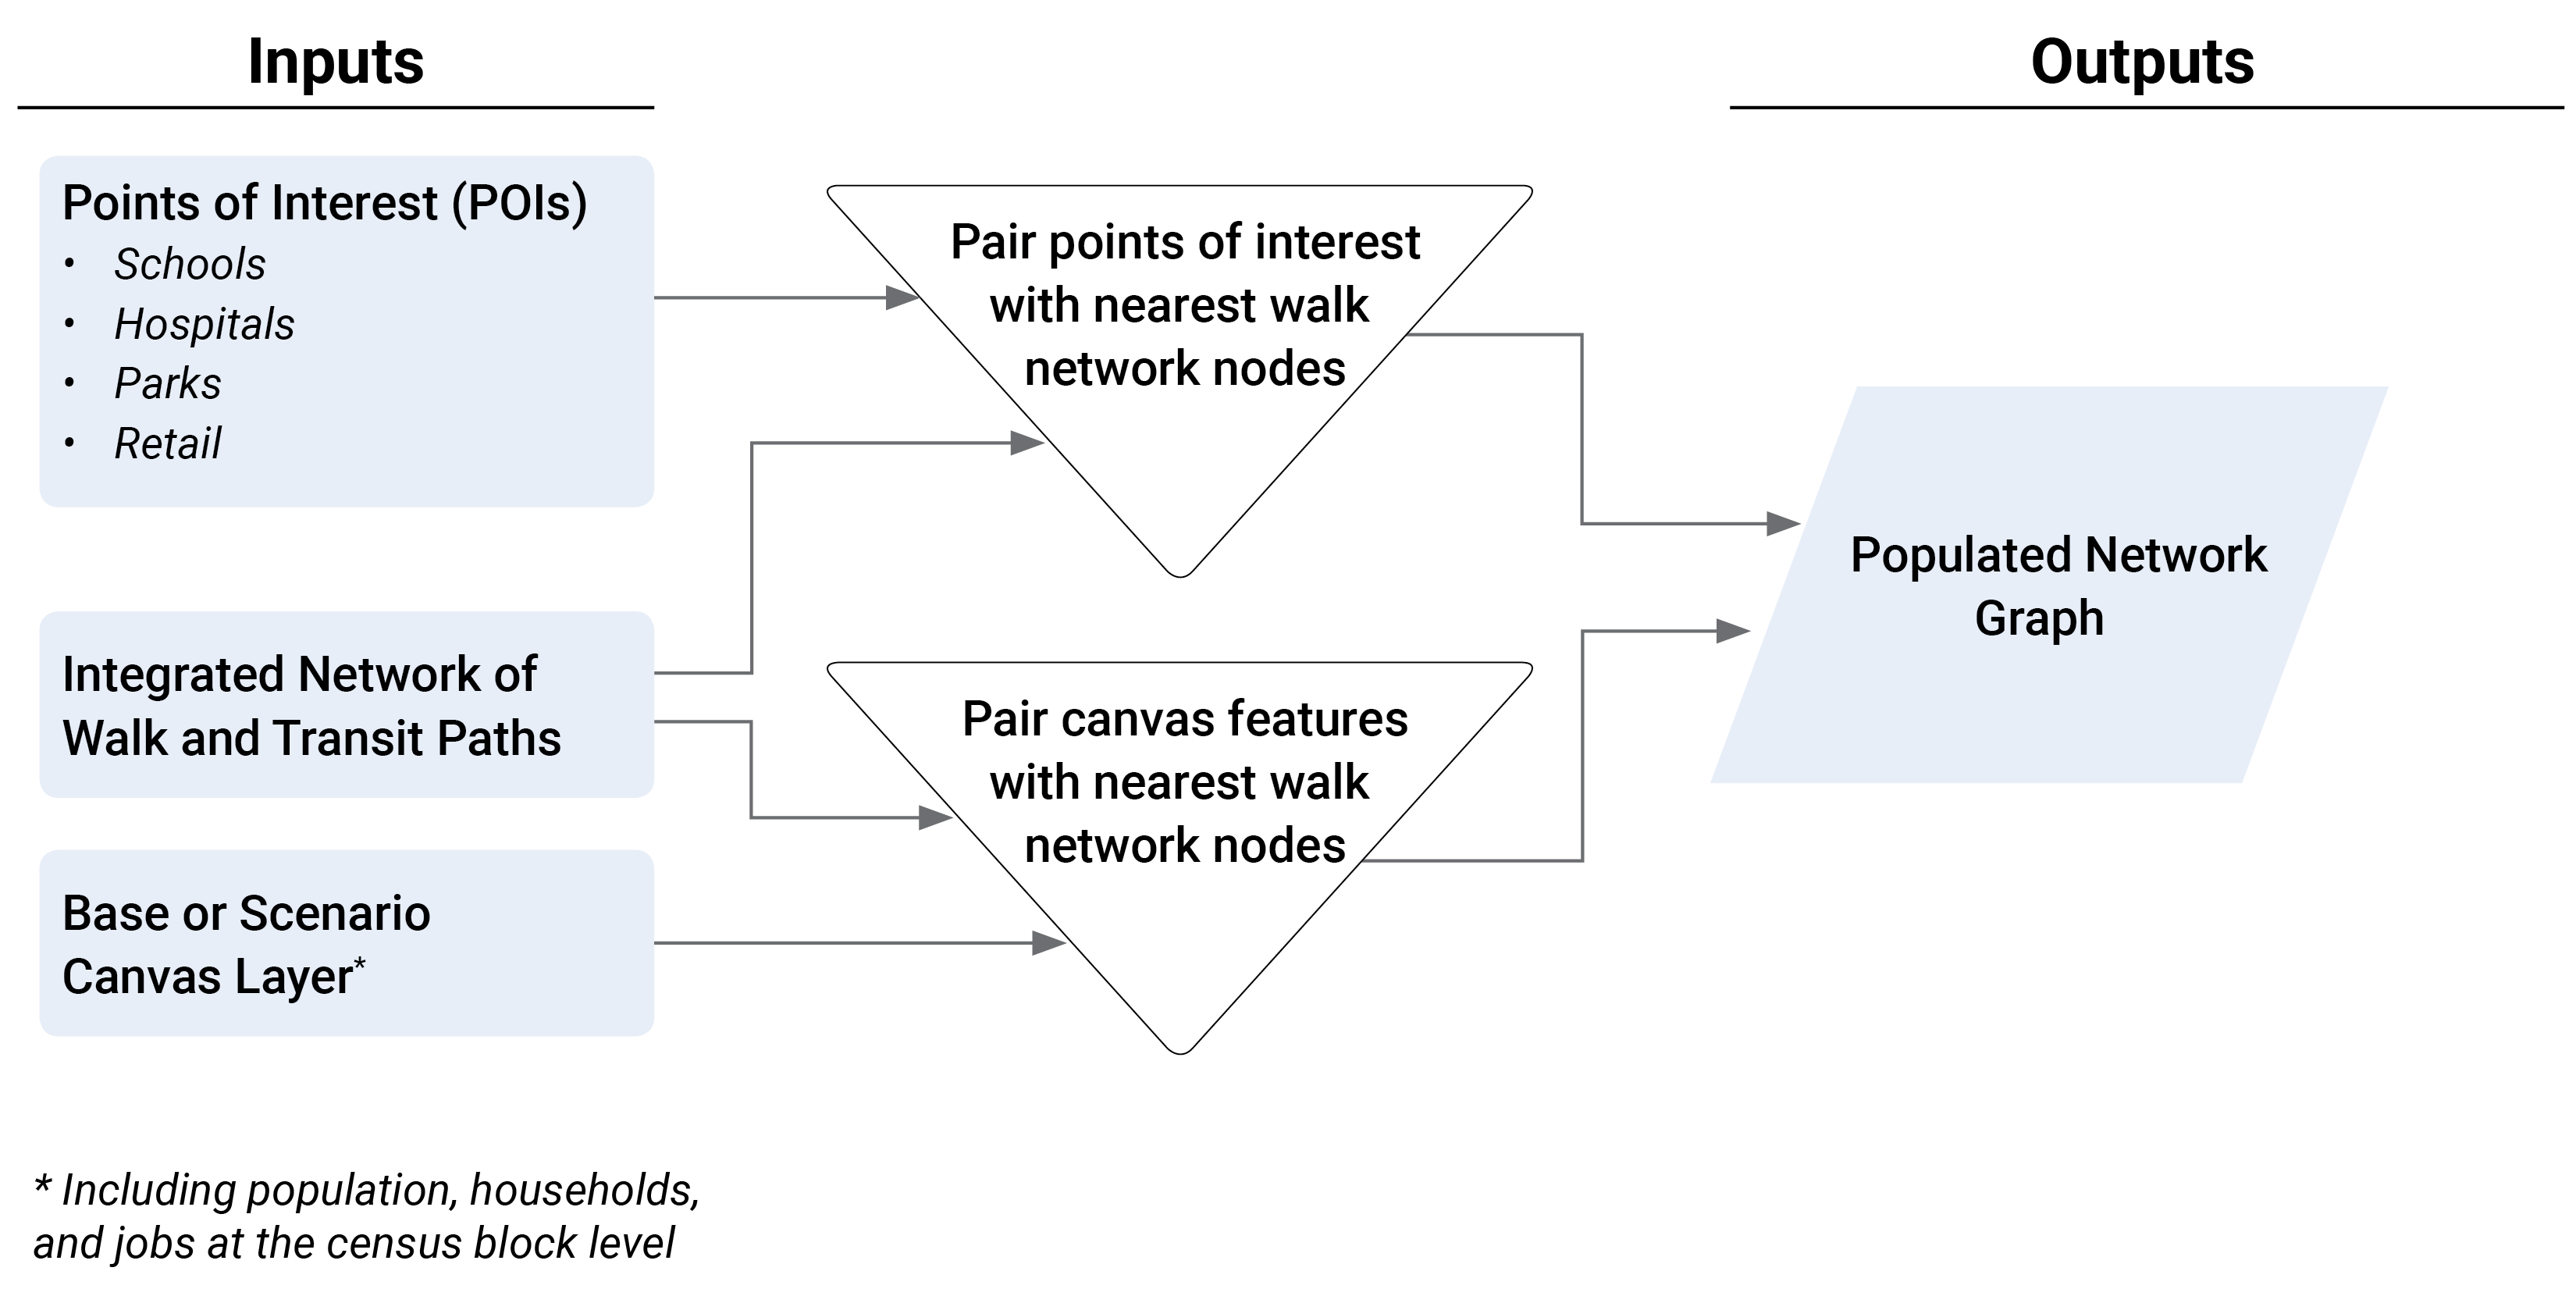
The Transit Accessibility module measures proximity to amenities and accessibility to specific features or opportunities by foot and transit. To do this, the module first compiles an integrated network, composed of both walk path and transit service data. Then, location data, such as the location of schools, parks, and hospitals, are extracted from national reference datasets and resolved against painted scenarios (as represented by the scenario canvas).
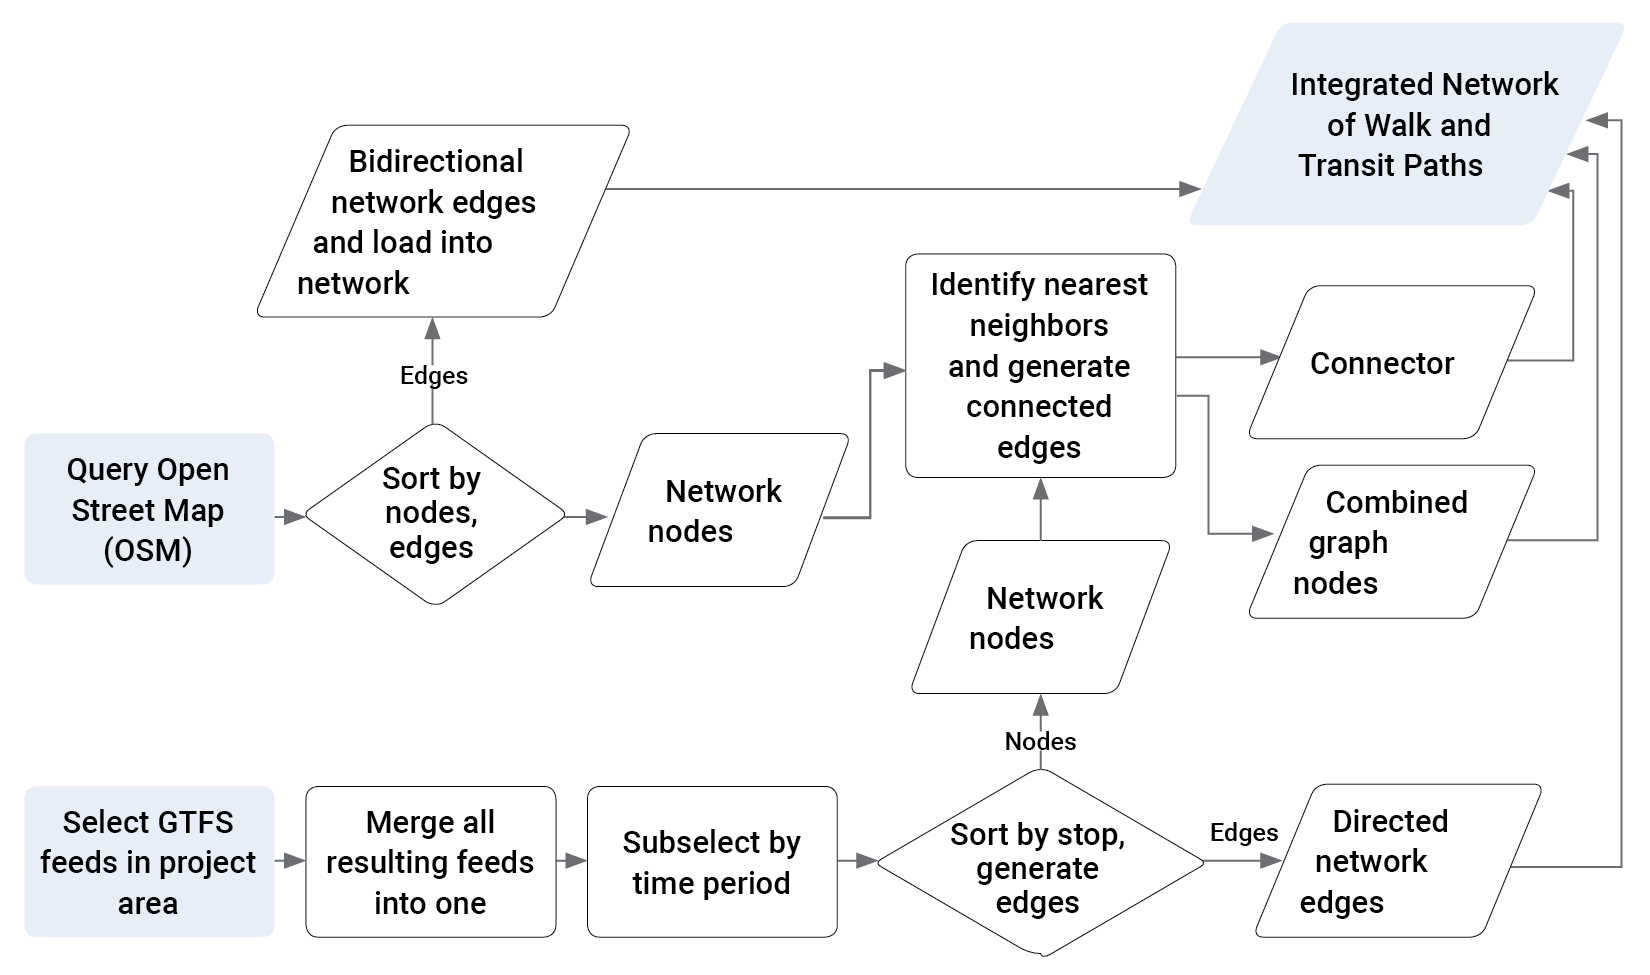
In addition to this information, the canvas is also used to generate data related to locations of jobs, households, population, and retail destinations as identified by the presence of retail employment. These datasets are all then layered on top of the network based on their locations in relation to nodes of the network. Lastly, a set of algorithms are performed to produce key proximity and accessibility metrics. The analysis flow is depicted in Accessibility Analysis Flow ; the generation of the integrated walk and transit network is depicted in Generation of the integrated walk and transit network.
 |
 |
Requirements
The Transit Accessibility module takes the following data and parameters:
The project canvas (automatically included with the project scope).
General Transit Feed Specification (GTFS) zip files of schedule and stop data for transit operators (automatically generated).
Calculations
First, an integrated network of walk and transit paths, one of the key inputs to the Transit Accessibility module, is built using two sources of data. The walk network is built based on data sourced from OpenStreetMap (OSM)51 and the transit network is assembled based on transit data that are retained in the General Transit Feed Specification (GTFS)52 format and sourced from Mobility Database.
To compile a transit network, the first step is to identify transit routes by different transit operators. Analyst assembles and regularly updates a dataset of all transit operators and their transit service coverages in the United States. This data is extracted from GTFS feeds that contain transit route information. Transit routes and schedules are gathered for all transit operators with service coverage that overlaps a project area and a "network area" that extends 10 miles beyond it.53
After specific transit operators are identified for a project area, service routes and stop times are then selected from each transit operator schedule given a parameterized target period. The default target time frame is 7:00 AM to 10:00 AM. The day with the busiest typical service schedule pattern is selected. This is determined by finding the day with the most frequent service scheduled, and typically corresponds with a Tuesday to Thursday weekday schedule.
Based on the identified transit service routes and schedules in that specified time period, a transit network is then built by calculating travel time cost between stops and wait time cost at stops. In a transit network, a node is a transit stop and an edge is a path between two transit stops if there is any transit service operating in between. This step of the analysis module estimates:
Edge cost, which is the time required to travel from one stop to the next via transit based on the published schedule data; and
Stop cost, which is the half of the average time between arrivals for a specific line at a specific stops.
With summarized stop and edge costs, a network graph that represents the transit system in the project area and its surrounding network area can then be constructed.5455 Two sets of information are stored in this network graph. Stop locations are stored as nodes, with attributes including location, in latitudes and longitudes, and waiting cost. An edge between a pair of nodes, if there is transit service between these two nodes, is stored in the network graph, with attributes including direction and cost, measured in terms of time.
The walk network is constructed similarly. Nodes along known walk paths and roads represented in the OpenStreetMap (OSM) data are converted to nodes in the walk network, along with locations. OSM “ways” (paths) between two given nodes are introduced to the network as two distinct directional edges with attributes of costs, which are derived based on distance between two nodes, and an assumed walk speed (which is a parameter that the user can adjust).
To generate the integrated network, walk and transit networks are connected. To connect the transit network to the walk network, each node in the transit network is paired with its nearest node in the walk network. Direct paths between these two nodes—one from the transit node to the walk node, and another from the walk node to the transit node—are then created, and such paths create connections from the transit network to the walk network. Traversing through these paths resembles boarding and alighting transit in reality. However, if a transit stop is too far (by default more than a five-minute walk56 from its nearest walk node57), then no connector path is built between two.
These connector edges are stored in the network graph with attributes of costs, just like other edges in transit and walk networks. Edges from a walk node to a transit node have the same cost as the boarding cost for the transit node (half that of the average headway). The intent of this is to model the cost of moving from the walk network onto the transit network (i.e., the cost to board the transit service in terms of the amount of time that one would on average need to wait).
The return edge, from a transit node to a walk node, is “free.” That is, no cost is assessed there as no wait time is modeled for deboarding a transit service. The creation of these connector edges allows the two networks to be merged into a single integrated network.
Once this integrated network has been developed, points of interest (POIs), including parks, schools, and hospitals, can be added to the network. These POIs are associated with one or more nodes on the network on the basis of either locations. If they are point locations, like hospitals and schools, a single point is used. If they are large polygons, like parks, then the shape is disaggregated into a representative “cloud” of points which are assigned to the network, each representing a subset of the total park (in terms of, for example, acreage).
Base Canvas geometries are similarly associated with nodes on the integrated network. Specifically, the closest walk node58 is identified for each parcel based on the distance between the centroid of the canvas geometry and any walk node. By associating POIs and canvas geometries to network nodes, one can then quickly summarize the number of amenities, such as hospitals, and opportunities, such as jobs, that are accessible from any given node in the network (within a given threshold of time).
With the fully specified network and the POIs information loaded onto the network, costs from any given parcel to any other parcel or any given amenity can be generated via the graph.
Pandana, an open source software library, is used to perform accessibility calculations. Pandana utilizes optimizations from Open Source Routing Engine (OSRM) to enable performant traversal of the computed graph for holistic, project-wide analyses. To learn more about the software, please review the journal article cited in the footnotes and in the citations section at the end of this document.59
Model Logic Assumptions
Because schedule headways are averaged, headways between trips on a given transit route are assumed equal during the GTFS subschedule time period.
Because elevation has not yet been included as a factor in network walk traversal, walk speed is considered static without regard for the slope of a given network edge.
The cost of transfers between two transit routes is always assumed to be half the headway of the later route. Timed transfers and awareness of schedule synchronization has not yet been accounted for.
Programmatically added links between transit network stop nodes and walk network nodes are assumed to be traversable, but OSM data for barriers (e.g., low walls) have not yet been considered.
The maximum travel time to be considered is 60 minutes. Network analysis does not consider paths between an origin and a destination that take longer than 60 minutes to traverse.
The decay method used in the network analysis is flat, i.e. amenities nearer to the reference census block or parcel are given the same weight as amenities further to it.
Walk Accessibility Methodology
The Walk Accessibility module uses the same structure as the Transit Accessibility module, but for the network used. The Walk Accessibility module does not import transit schedules to construct the transit network, or integrate the transit network and the walk network60. Instead, it begins network analysis with only the walk network that is built upon the OSM data. Refer back to the Transit Accessibility Methodology for more details.
Input Parameters
Inputs to the Walk and Transit Accessibility modules include General Transit Feed Specification (GTFS) transit and OpenStreetMap (OSM) street network data, along with user-modifiable parameters for transit service hours and walk speed.
Network Coverage
Transit and street networks for each project cover the project area, as well as buffered "network areas" around it in order to capture the population, households, jobs, and points of interest beyond the project area to which people will likely travel. All transit operators that have routes within a 10-mile buffer of the project area are captured in the transit network. The street network includes all streets that are within a 3- mile buffer of the bounding box of the project area. Since the street network beyond the project area covers a smaller area than the transit network, there are some areas covered only by the transit network. For these outer areas, the additional population, households, and jobs accessible from each transit stop are estimated rather than calculated via a walk network analysis.
Transit Network Data
The GTFS data used by UrbanFootprint contain relevant transit operator information (including stop locations and route schedules) from Mobility Database. Analyst extracts, cleans, and stores these feeds on a regular basis, and the Transit Accessibility module constructs the transit network based on these feeds. Analyst's loaded transit network thus represents the known transit network that is accessed from all available GTFS feeds published by operators.
Street Network Data
OpenStreetMap (OSM) data is downloaded from the OSM Overpass API61. As a result, the network is representative of the latest network available from OSM. OSM data includes two key elements that are used to construct the network graph: nodes62, which are key points along a given path, and “ways”63. Ways (also known as edges) are used to create directional links from one node to another; the links form the edges of the network graph.
Destination Data
The accessibility modules measure access to destinations within a project area and a broader "access area" defined as a 50-kilometer buffer area around a project. Population, household, and employment counts in the access area are derived from census data at the block level. Employment data is sourced from U.S. Census Longitudinal Employer-Household Dynamics (LEHD) Origin-Destination Employment Statistics (LODES) data. Population and household data are derived from U.S. Census Decennial Census data.
Points of Interest
Three layers of POIs are used in both Accessibility modules.
Hospitals: US Homeland Infrastructure Foundation, Federal Geographic Data Committee
Parks: Esri, TomTom North America, Inc.; parks, gardens, and forests within the US
Schools: US National Center for Education Statistics (NCES), School Attendance Boundary Information System (SABINS)
User-Modifiable Parameters
Users can adjust the timeframe considered for transit access, and the assumed average walk speed. By default, the hours during which transit accessibility is assessed is 7 AM to 10 AM. The default average walk speed is 3 miles per hour.
Users can also specify the nth (e.g., 1st, 2nd, 3rd, 4th, etc... where n is user-specified) nearest retail location considered for the Nearest Retail Access metrics. For example, if n is set to 5, then the module will measure the time it takes to access the fifth nearest retail location. By default, n is set to 1. Users can set the value up to 10. Retail locations are identified as features containing any retail employee.
The n value can be used to gauge not only the proximity but the number of amenities in an area. Analyzing for the 5th nearest amenity indicates that there are at least five options within a 10-minute reach. By comparison, it might only take five minutes to get to the 1st nearest amenity, but there may not be others nearby.
Output Metrics
The Walk and Transit Accessibility modules generate spatial output layers and corresponding data tables; all can be used within Analyst for mapping and data exploration, and exported. Separate sets of spatial layers are generated for walk and transit accessibility. Results for both include three categories of accessibility metrics: aggregate access, nearest point of interest access, and regional proportion of amenities accessible, as described in the following sections.
The module also reports individual and comparative scenario results via summary charts, and generates spreadsheet summaries in Excel format. The attributes of the spatial output/data tables are summarized in the Walk and Transit Accessibility Module Layer Outputs Table.
Aggregate Access
These results indicate the Population, Employment and characteristics that can be accessed from each canvas geometry in the allotted time frame.
Opportunities include jobs, households, and population.
Amenities currently includes acres of park space.
For example, from a given parcel in a project, you might see walk access to 120 jobs within five minutes and 280 jobs within ten minutes. If a land use scenario features job growth, aggregate access will increase to reflect access to an expanded number of jobs. Levels of accessibility to opportunities and amenities can be visualized effectively using choropleth maps.
Access to Nearest Destinations
These results indicate the amount of time, measured in minutes, required to reach the nearest of a given type of destination (or in the case of retail locations, the nearest nth location as set by the user) within the project area and the 50 km buffer area surrounding it.
For example, the “Nearest Hospital By Mode” results show how travel times to hospitals can vary across a project area. All outputs can be mapped with editable symbology to best convey variations in access.
Analyst's default symbology for accessibility outputs indicate better access with lighter colors; color ramps and class bounds can all be readily changed.
Residential Walk and Transit Access to Destinations
These outputs, reported as summary results in Analyze and Report modes, are aggregate measures that indicate percentages of the total population in the project area that can reach their nearest amenity within a given period of time. For example, the walk module determines the portion of the total population that can reach their nearest park on foot within 5, 10, 15, and 20 minutes.
Residential Transit Access to Employment
These outputs, reported as summary results in Analyze and Report modes, are aggregate measures that indicate the percentages of residents that can access given percentages of jobs within the region within given timeframes. Three summary charts are produced to reflect different amounts of regional jobs (10%, 25%, and 50%). The percentage of the project area’s population that can access each given amount of jobs is measured for four time buckets: 15, 30, 45, and 60 minutes or less.
Outputs can be phrased, for example, in the following manner:
"42% of the population of the project area can reach at least 25% of all jobs in the region within 30 minutes by transit."
The accessibility modules generate spatial output layers and corresponding data tables; both can be used within Analyst for mapping and data exploration, and exported. The module also reports individual and comparative scenario results via summary charts, and generates a spreadsheet summary in Excel format. The attributes of the spatial output/data table are summarized in the Walk and Transit Accessibility Module Layer Outputs Table. Summary metrics, which cannot be mapped, are listed in Walk and Transit Accessibility Module Summary Metrics Table.
Walk and Transit Accessibility Module Layer Outputs Table
Attributes | Description | Walk Times | Transit Times |
|---|---|---|---|
Aggregate Access Metrics | |||
Employment Access by Mode | Number of jobs that can be reached | 5, 10, 15, 20, 30, 45 & 60 minutes | 15, 30, 45, & 60 minutes |
Population Access by Mode | Number of individuals that can be reached | 5, 10, 15, 20, 30,45 & 60 minutes | 15, 30, 45, & 60 minutes |
Household Access by Mode | Number of households that can be reached | 5, 10, 15, 20, 30, 45 & 60 minutes | 15, 30, 45, & 60 minutes |
Park Acreage Access by Mode | Acres of park area that can be reached | 5, 10, 15, 20, 30, 45 & 60 minutes | 15, 30, 45, & 60 minutes |
Nearest Point of Interest Access Metrics | |||
Nearest School by Mode | Amount of time to nearest school | ||
Nearest Hospital by Mode | Amount of time to nearest hospital | ||
Nth nearest Retail by Mode | Amount of time to nthe nearest retail, where n is user-specified | ||
Nearest Park by Mode | Amount of time to nearest park | ||
Nearest Transit Stop by Mode (for walk accessibility only) | Amount of time to nearest transit stop | ||
Nearest High Quality Transit Stop by Mode (for walk accessibility only) | Amount of time to nearest high quality transit stop (including tram, streetcar, light rail, subway, metro, rail, ferry, and cable tram) |
Walk and Transit Accessibility Module Summary Metrics Table
Attributes | Description | Walk Times | Transit Times |
|---|---|---|---|
Regional Proportion of Jobs Accessible Metrics | |||
Access to 10+% of project area jobs | Portion of Base Canvas from which at least this percentage of area jobs within the set time frames | 15, 30, 45, & 60 minutes | |
Access to 25+% of project area jobs | Portion of Base Canvas from which at least this percentage of area jobs can be reached within the set time frames | 15, 30, 45, & 60 minutes | |
Access to 50+% of project area jobs | Portion of Base Canvas from which at least this percentage of area jobs can be reached within the set time frames | 15, 30, 45, & 60 minutes | |
Regional Proportions with Amenities Nearby Metrics | |||
Access rates to schools | Portion of residents that can access a school within the set time frames | 5, 10, 15, & 20 minutes | 10, 20, & 30 minutes |
Access rates to hospitals | Portion of residents that can access a hospital within the set time frames | 5, 10, 15, & 20 minutes | 10, 20, & 30 minutes |
Access rates to retail | Portion of residents that can access the nth nearest retail location within the set time frames | 5, 10, 15, & 20 minutes | 10, 20, & 30 minutes |
Access rates to parks | Portion of residents that can access a park within the set time frames | 5, 10, 15, & 20 minutes | 10, 20, & 30 minutes |
Access rates to all transit stops | Portion of residents that can access a transit stop within the set time frames | 5, 10, 15 & 20 minutes | 10, 20 & 30 minutes |
Access rates to high quality transit stops | Portion of residents that can access a high quality transit stop (including tram, streetcar, light rail, subway, metro, rail, ferry, and cable tram) within the set time frames | 5, 10, 15 & 20 minutes | 10, 20 & 30 minutes |
Final Citations
In an effort to highlight the utility of a core component of the accessibility model, the graph engine for computing accessibility in a performant manner, it’s important to highlight and acknowledge the use of Pandana, an open-source tool maintained within the Urban Data Science Toolkit organization on Github (https://github.com/UDST). The repository for the Pandana source code (https://github.com/UDST/pandana) requests the following paper, describing the underlying methodology, be included when referring to the library’s methodology. A link is included in the endnotes; here is the full citation:
Foti, F., Waddell, P., & Luxen, D. (2012, April). "A generalized computational framework for accessibility: from the pedestrian to the metropolitan scale." In Proceedings of the 4th TRB Conference on Innovations in Travel Modeling. Transportation Research Board. https://onlinepubs.trb.org/onlinepubs/conferences/2012/4thITM/Papers-A/0117-000062.pdf
In addition to using Pandana to hold the initialized network graph, it is also necessary to acknowledge Dennis Luxen and the Open Source Routing Machine project (OSRM). This open source project’s contraction hierarchies logic is employed to process the initial network graph and compress it to enable higher performance network queries when Pandana aggregates accessibility metrics tethered to graph. https://github.com/Project-OSRM/osrm-backend
51OpenStreetMap is a free, editable map of the whole world that is being built by volunteers largely from scratch and released with an open-content license. Learn more here: https://wiki.openstreetmap.org/wiki/About_OpenStreetMap.
52The General Transit Feed Specification (GTFS) defines a common format for public transportation schedules and associated geographic information. Learn more here: https://developers.google.com/transit/gtfs/
53Note that, in the future, users will be able to submit their own transit data and customize the included list of transit routes that are included in each scenario. This will be useful if users replace or update an existing service provider’s transit network with, for example, new routes or increased headways. Simulating the removal of a specific transit network will also be possible.
54The constructed transit network covers the project area and at least 10 miles beyond the project area boundaries.
55The method for summarizing edge and stop costs parallels those used in the open source tool Peartree (https://github.com/kuanb/peartree/). With this tool, schedule information is aggregated from the target time period and converted to a direct multigraph representation of that time frame’s scheduled service patterns. Impedance along each segment of each route is a function of the service level (headways, route segment speed) for that segment.
56Consider crow-fly distance.
57This may occur, for example, when the transit network happens to be bigger than the walk network.
58This implies one always has to be on a walk network first in order to get to a transit network.
60The analysis does currently rely on importing GTFS to extract transit stop locations so that minutes to nearest transit stop can be generated for the Walk Accessibility module.