Household Costs Analysis
The Analyst Household Costs module estimates annual household costs associated with passenger vehicle transportation, residential energy use, and residential water use. Together, these represent dimensions of housing affordability as it relates to location efficiency, which impacts travel behavior and vehicle miles traveled (VMT); and housing type, which impacts energy and water use.
Comparative results among scenarios demonstrate the effects of land use and housing mix on affordability for individual households, and project-wide. Household costs are also subject to technical assumptions for vehicle and building performance, as well as cost assumptions for utilities, auto fuel, and auto ownership and maintenance. The VMT, building energy, and water use calculations upon which household cost estimates are based are described in the documentation for the Transportation, Energy Use, and Water Use modules.
The module comes loaded with default inputs for vehicle fuel economy; costs for auto fuel, ownership, and maintenance; residential electricity and natural gas costs; and residential water cost. These defaults represent current baselines, with national averages used for vehicle performance and ownership and maintenance costs, and state averages used for auto fuel, electricity, and natural gas. Users can change the baseline inputs if more local data are available, and use inputs for future-year scenarios to estimate the effects of better vehicle performance or changing costs.
Analysis is run at the scale of the project canvas (generally parcels or census blocks), yielding a spatial output layer and corresponding data table; both can be used within Analyst for mapping and data exploration, and exported. The module also reports individual and comparative scenario results via summary charts, and generates a spreadsheet summary in Excel format.
Methodology
The module estimates household costs based on the VMT, energy use, and water use outputs generated by the Transportation, Energy Use, and Water Use modules. Please refer to the documentation of these modules for details about how these outputs are derived.
Estimated household costs are also determined by input assumptions for vehicle performance, per-mile transportation cost, and utility prices. The following sections describe the default assumptions and calculations used. Household Cost Analysis summarizes the analysis flow from inputs to outputs.
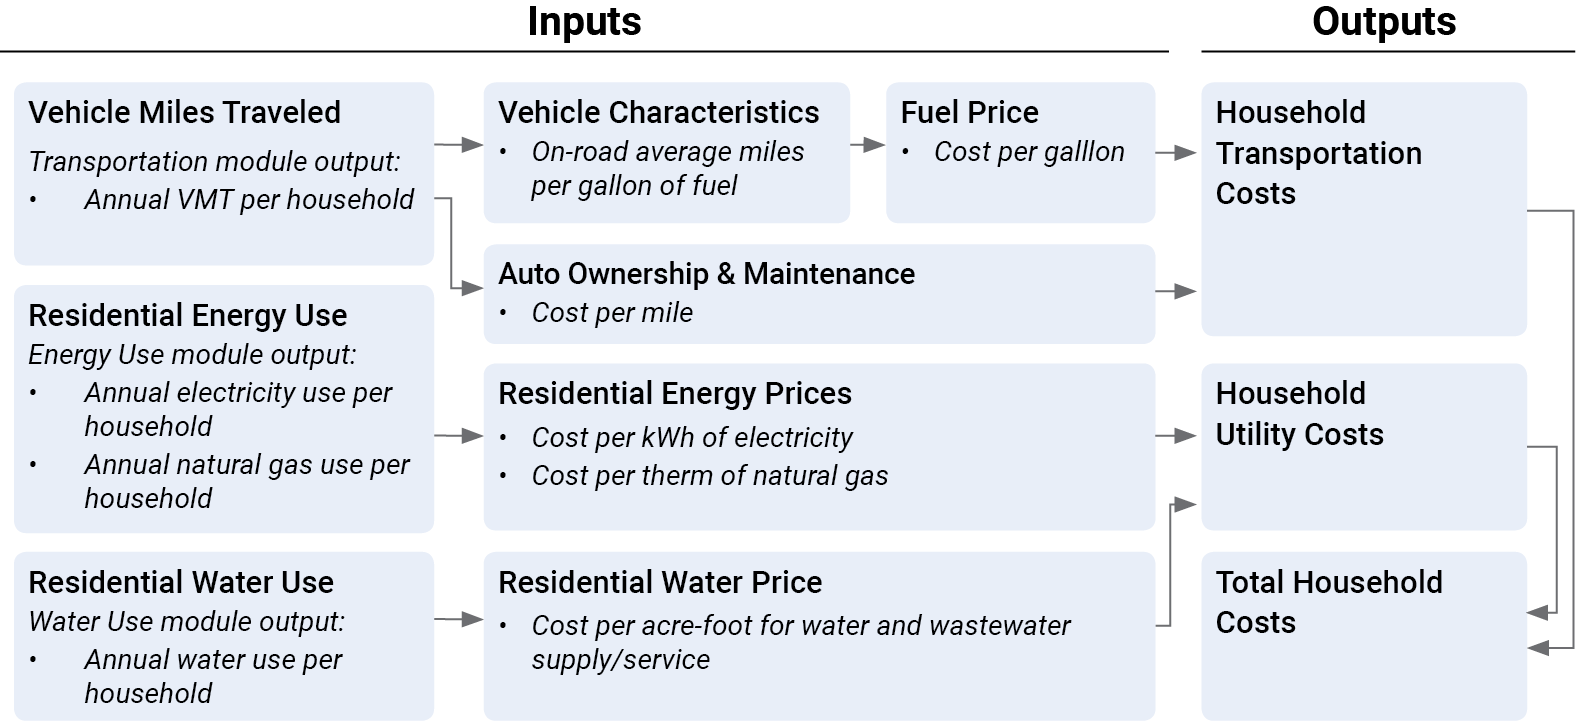 |
Transportation Cost Calculations
On the basis of typical vehicle use, the Household Costs module applies an on-road average fuel economy for all cars, an average cost per gallon for gasoline, and an average cost per mile for ownership and maintenance.
The Transportation module estimates annual VMT per household. Household costs related to passenger vehicle transportation are then calculated with fleet-wide average assumptions for on-road vehicle fuel economy, fuel price, and per-mile ownership and maintenance cost, which can be set for the baseline and future years. Fuel economy in miles per gallon is applied to VMT for the fuel consumption calculation (in gallons). The fuel price (in constant dollars, that is, value in terms of today’s dollars) is applied to fuel consumption for the fuel cost calculation. In addition, transportation costs related to vehicle ownership and maintenance are estimated by applying an average per-mile cost to VMT. The following equation summarizes the calculation:
Energy Cost Calculations
The Energy Use module estimates electricity and natural gas use for residential and commercial buildings. Utility costs associated with electricity and natural gas use are calculated, in turn, on the basis of cost assumptions that can be set for the baseline and future years. The equation for household electricity and natural gas use costs is summarized below:
Water Cost Calculations
The Water Use module estimates household water use. Water costs are calculated by applying water prices (in dollars per gallon) that can be set for the baseline and future years. The equation for estimating water costs is as follows:
Input Parameters
Analyst comes loaded with a set of default costs for transportation fuel, auto ownership and maintenance, and residential electricity, natural gas, and water. This section describes the development of the default inputs using national data sources.
The default inputs can be replaced with localized baseline inputs, if available, via the Analysis Assumptions editor. Different cost inputs can be set for each scenario, and can be used to test the impact of changing prices into the future.
Default Transportation Costs
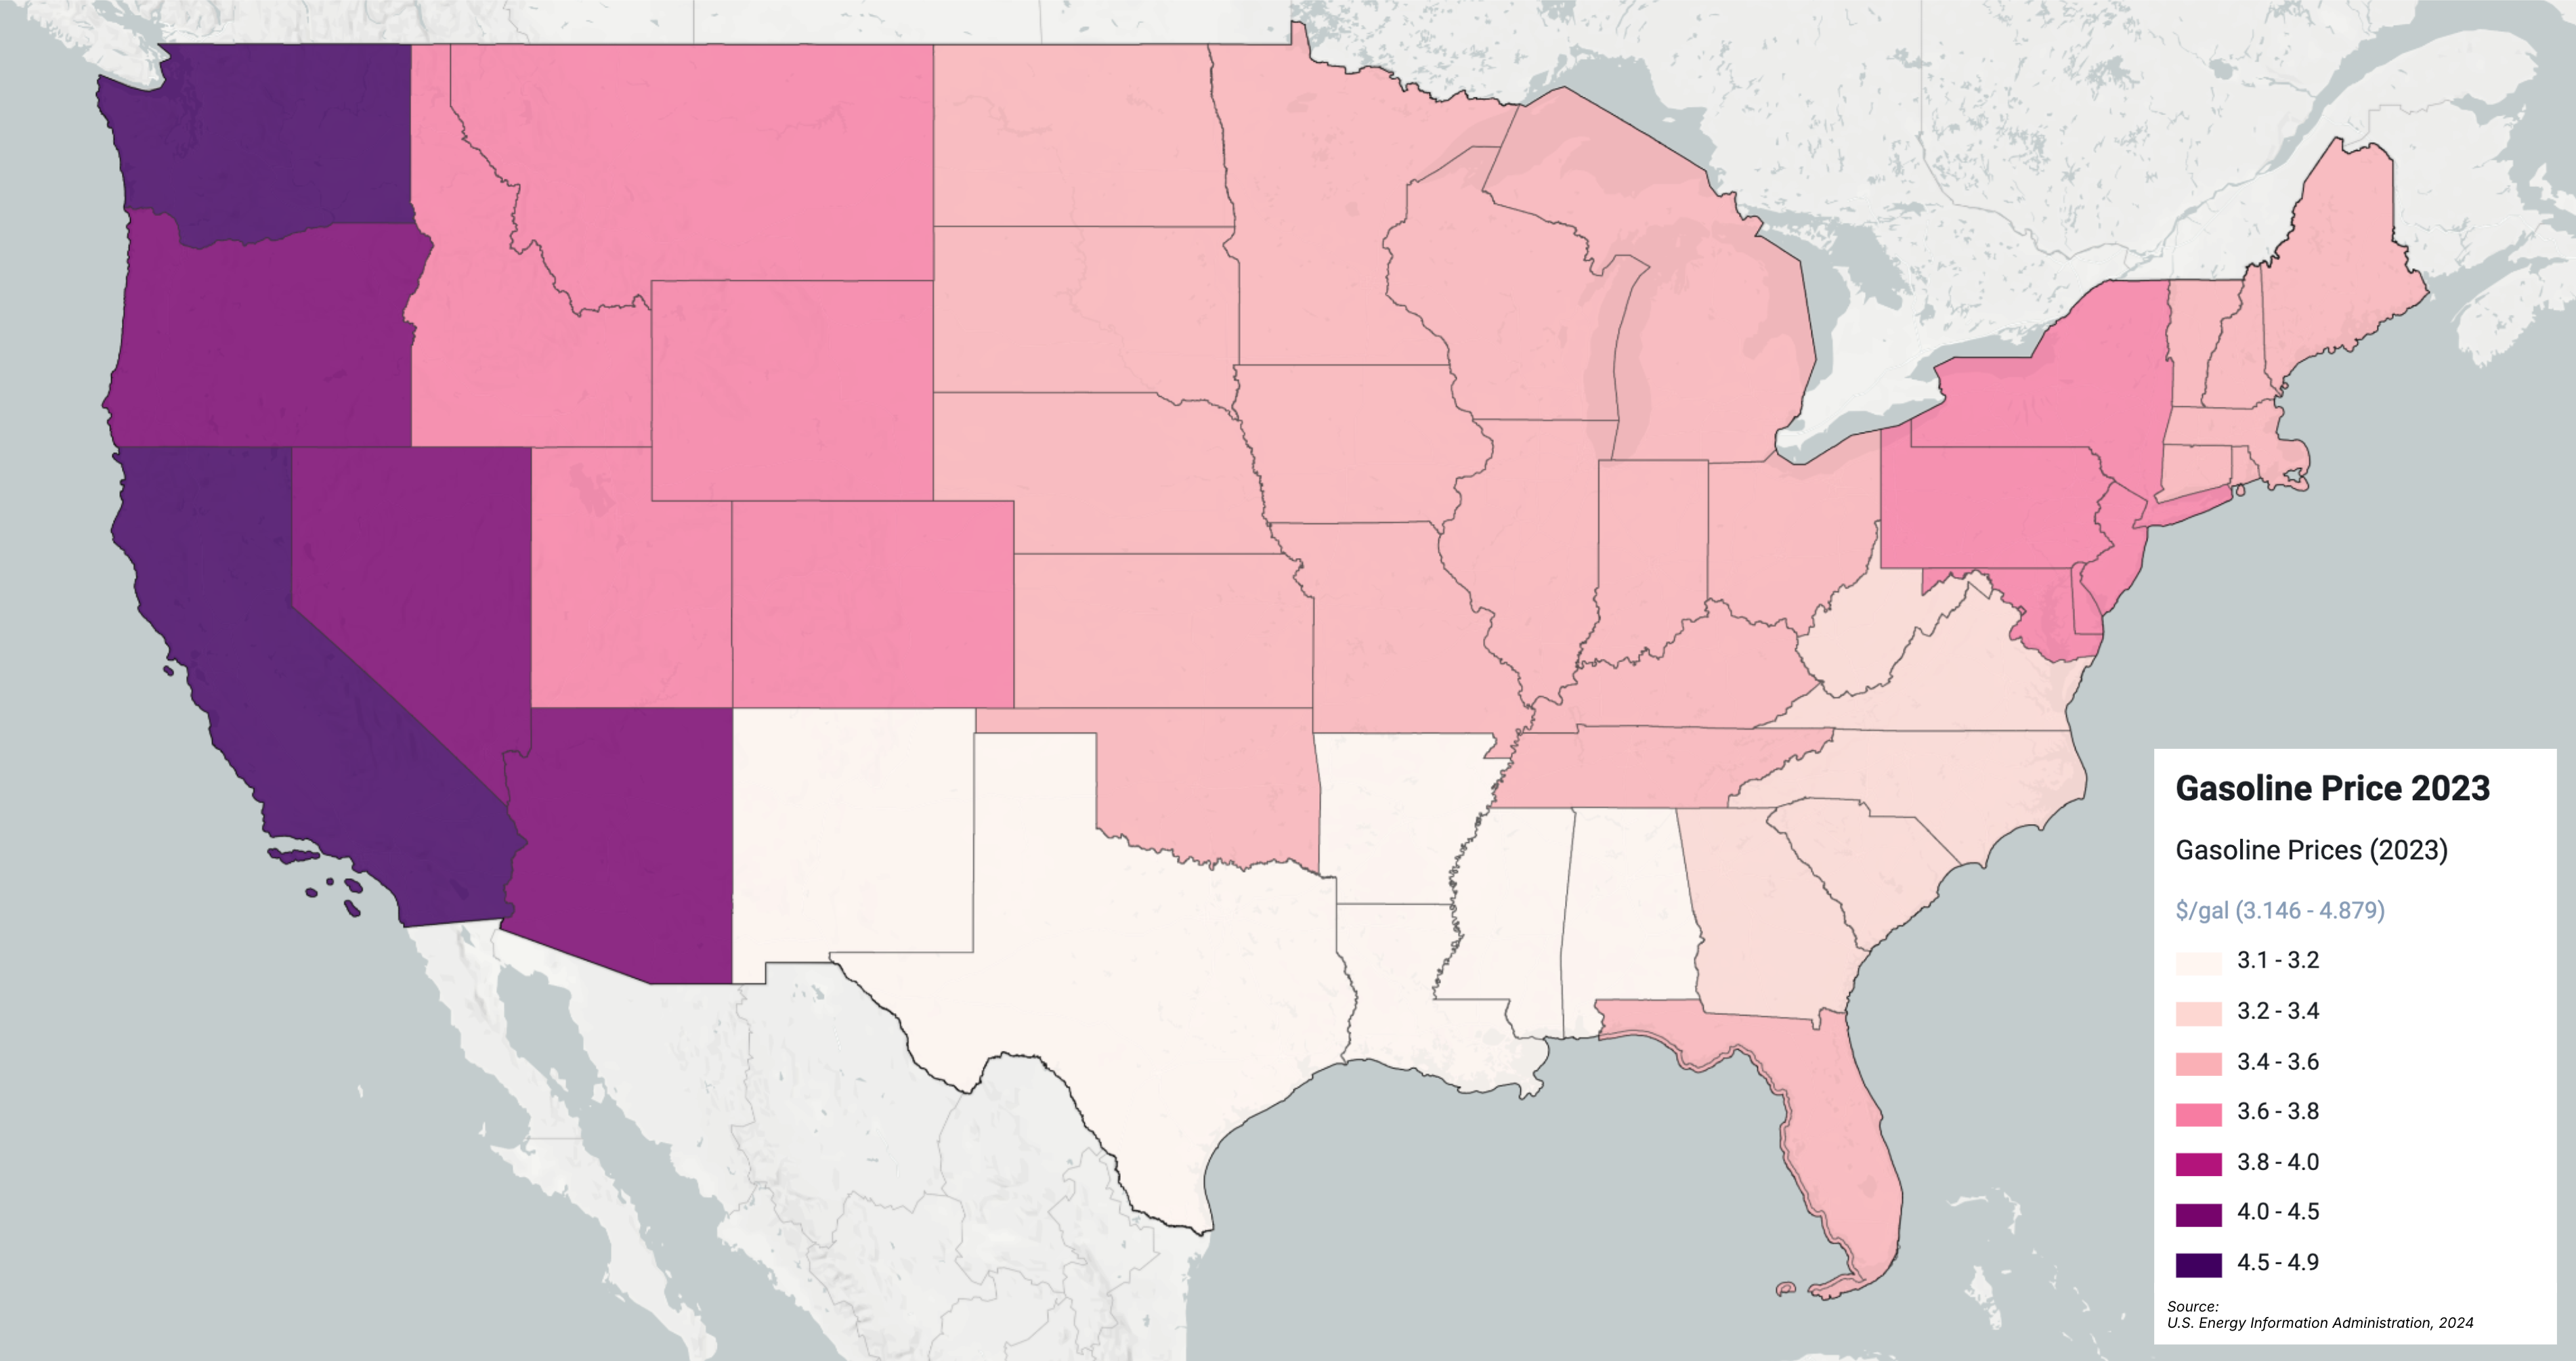
Analyst comes loaded with a set of default parameters related to transportation costs. Annual average automobile fuel prices are sourced from the Energy Information Administration (EIA) Weekly Retail Gasoline and Diesel Prices dataset17. The dataset includes average prices for all finished motor gasoline grades (regular, midgrade, premium) and formulations (conventional, reformulated). In general, prices are averaged over each Petroleum Administration for Defense District (PADD) (see EIA Petroleum Administration for Defense Districts (PADDs)). PADDs are geographic divisions of the 50 states and the District of Columbia into five districts. The EIA also provides gasoline prices for several specific states, including California, Colorado, Florida, Massachusetts, Minnesota, New York, Ohio, Texas, and Washington. For these states, Analyst uses the state-specific gasoline price in place of the PADD average. Default values for each project are set using the annual average gasoline price for the PADD or state that the project falls within.
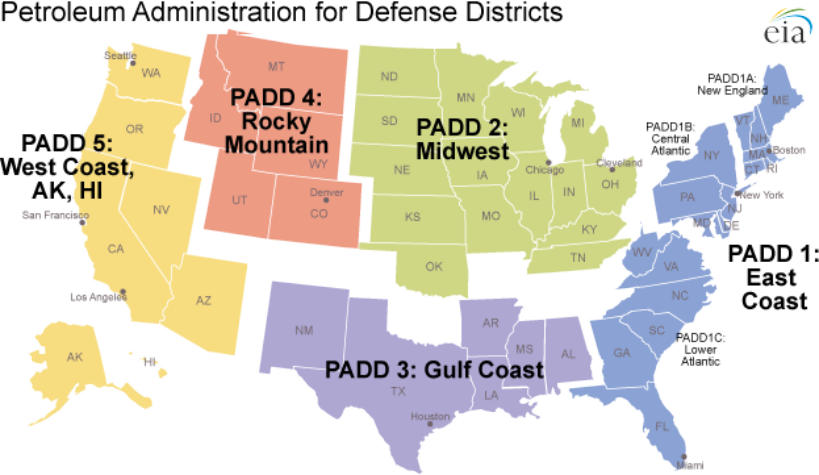 |
The other transportation cost parameters include passenger vehicle fuel economy, and auto ownership and maintenance costs per mile. The module comes loaded with national averages for both.
The default input for fuel economy is an on-road average for light-duty vehicles with short and long wheel bases (including passenger cars, light trucks, vans, pickup trucks, and sport/utility vehicles) as published by the Bureau of Transportation Statistics (BTS)18 for the year 2022.
The default input for auto ownership and maintenance is based on AAA Your Driving Costs19 estimates for the average cost of a new passenger vehicle manufactured and purchased in 2024 and driven 10,000 miles per year, excluding fuel costs. Default Input Parameters for Transportation Costs summarizes the input parameters used to calculate transportation cost and the default baseline values used by Analyst.
If available, users can input localized baselines and projected future-year values for more accurate and/or policy-oriented analysis.
Parameter | Default Baseline Values |
|---|---|
Average on-road passenger vehicle fuel economy | 22.8 miles/gallon |
Auto fuel price | Values vary by PADD or state |
Auto ownership and maintenance | 0.77 dollars/mile |
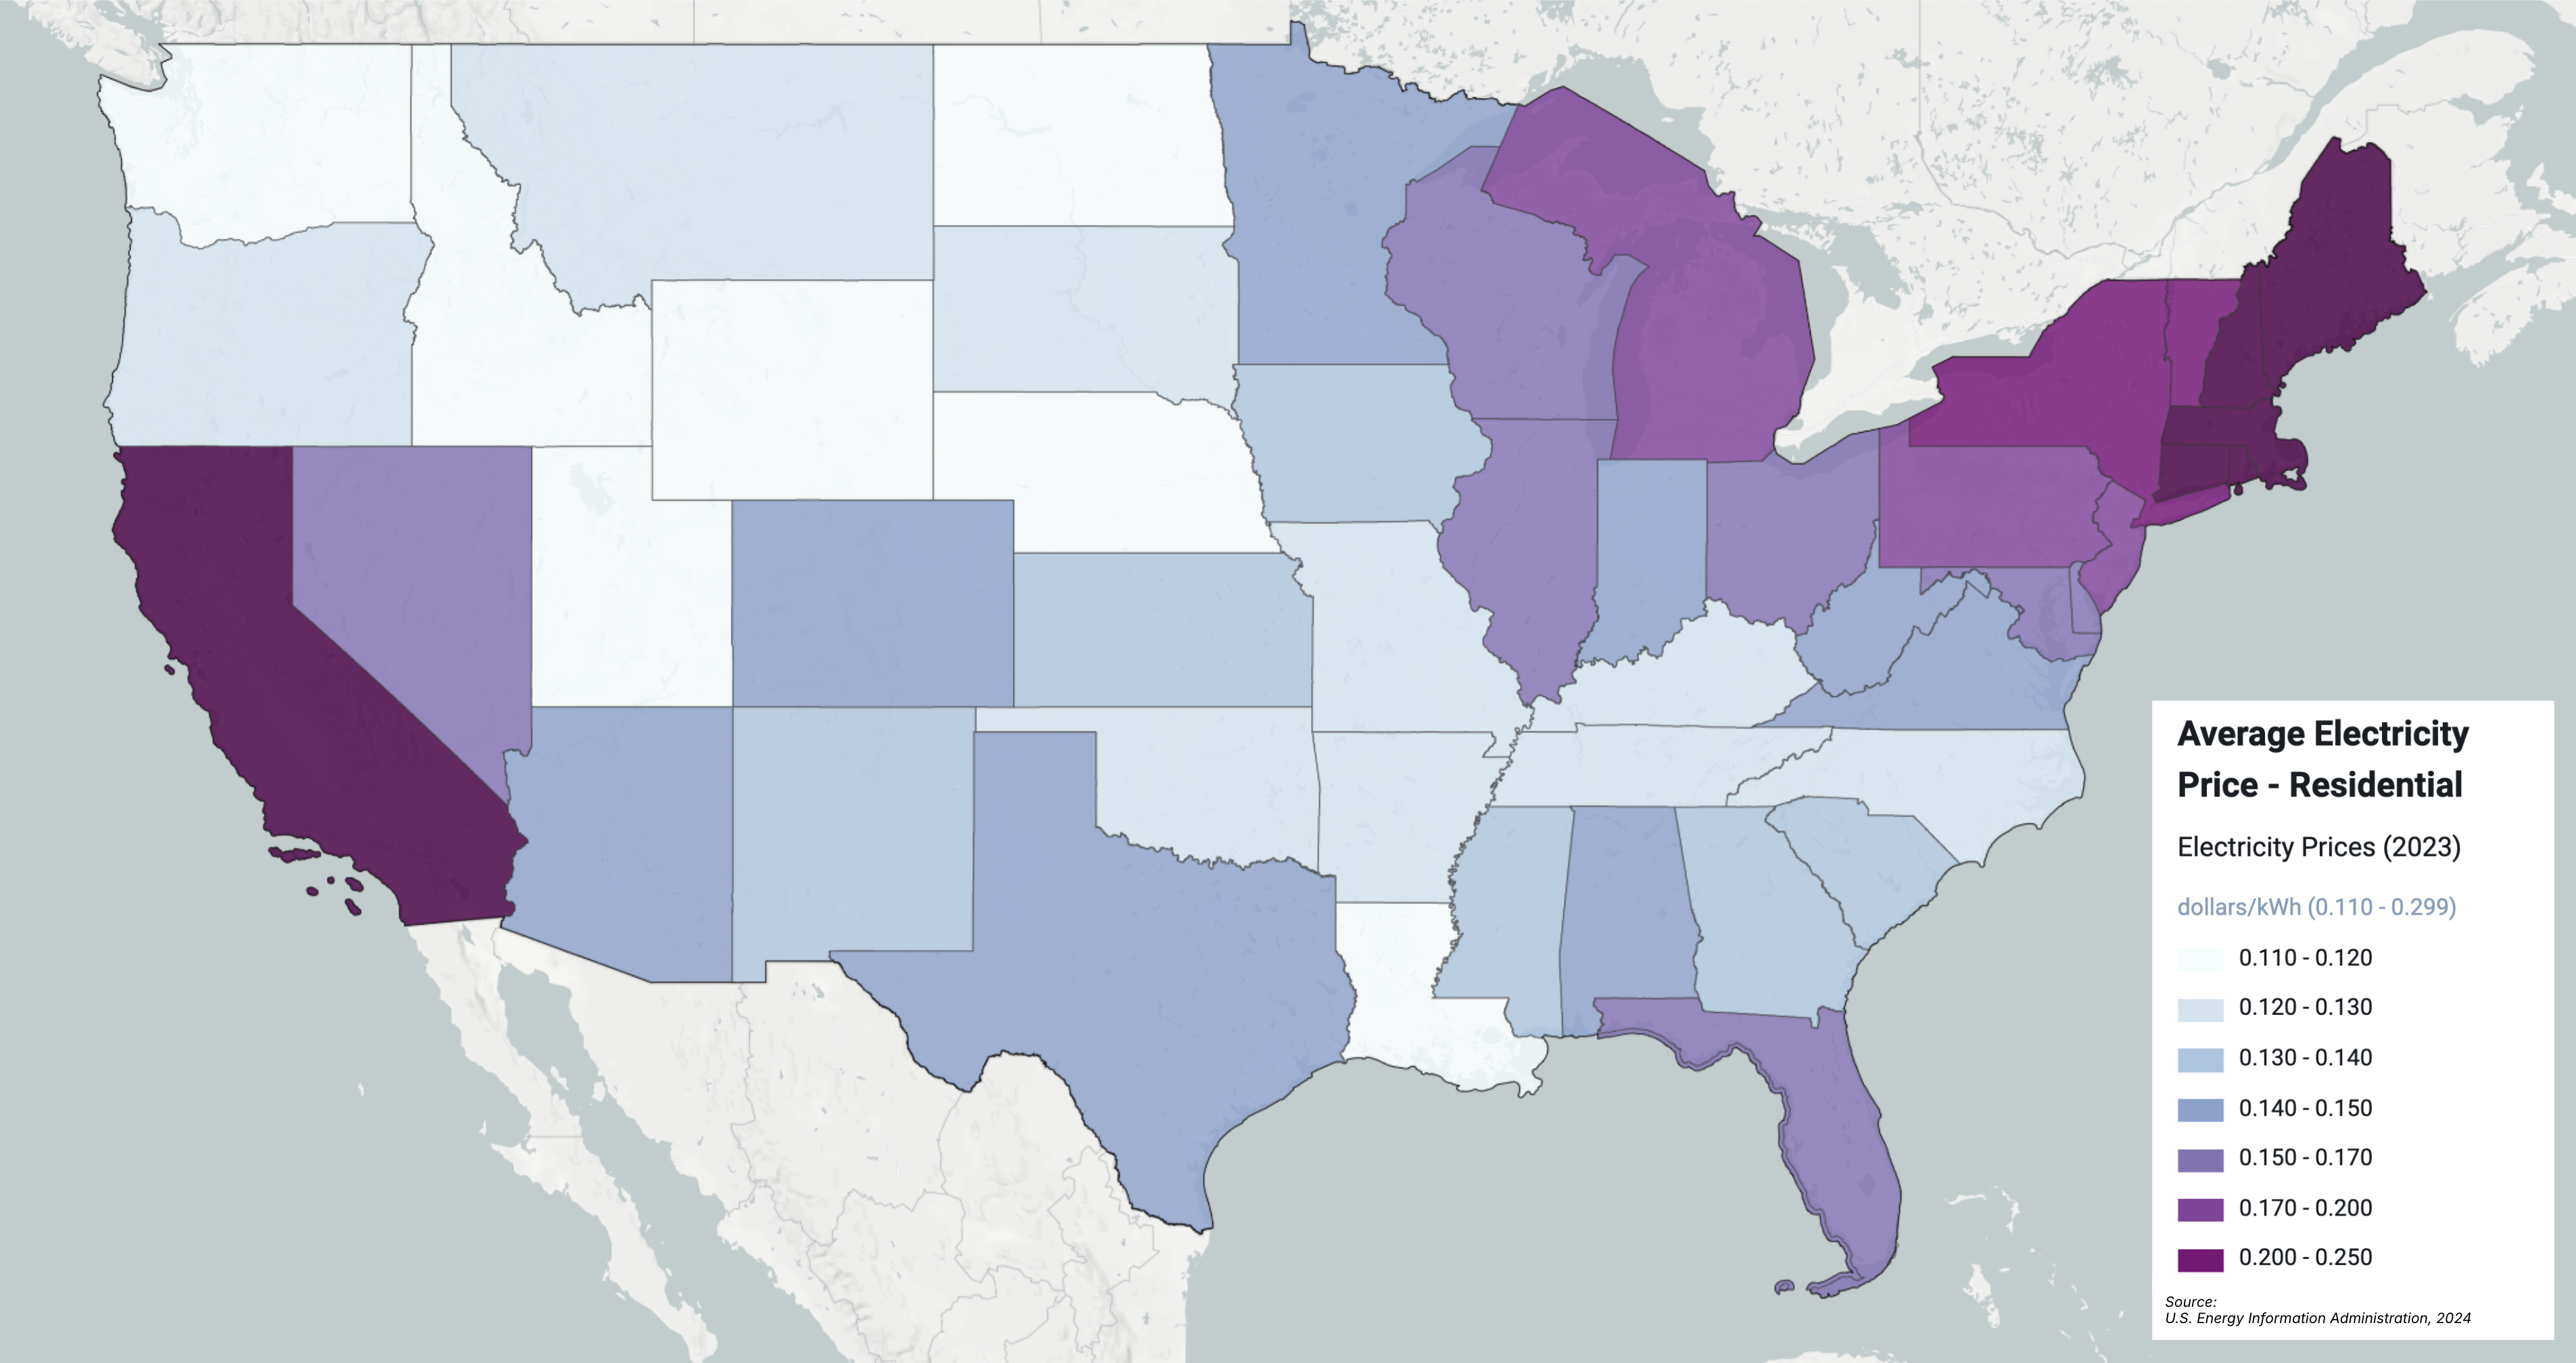
Default Residential Energy Costs
Analyst comes loaded with a set of default electricity and natural gas prices that vary by state. Annual average electricity prices by state are generated from the U.S. Energy Information Administration (EIA) electricity sales and price data20, which includes revenue from electric power sold to ultimate consumers and the corresponding sale of electricity. Average prices are then calculated (in dollars per kilowatt-hour) by dividing the revenue by the amount of electricity sold. Note that because the derived average prices represent weighted averages for all consumers, they are not directly equal to the per kilowatt-hour rate the electric power industry participant charges individual consumers, though often the values are similar.
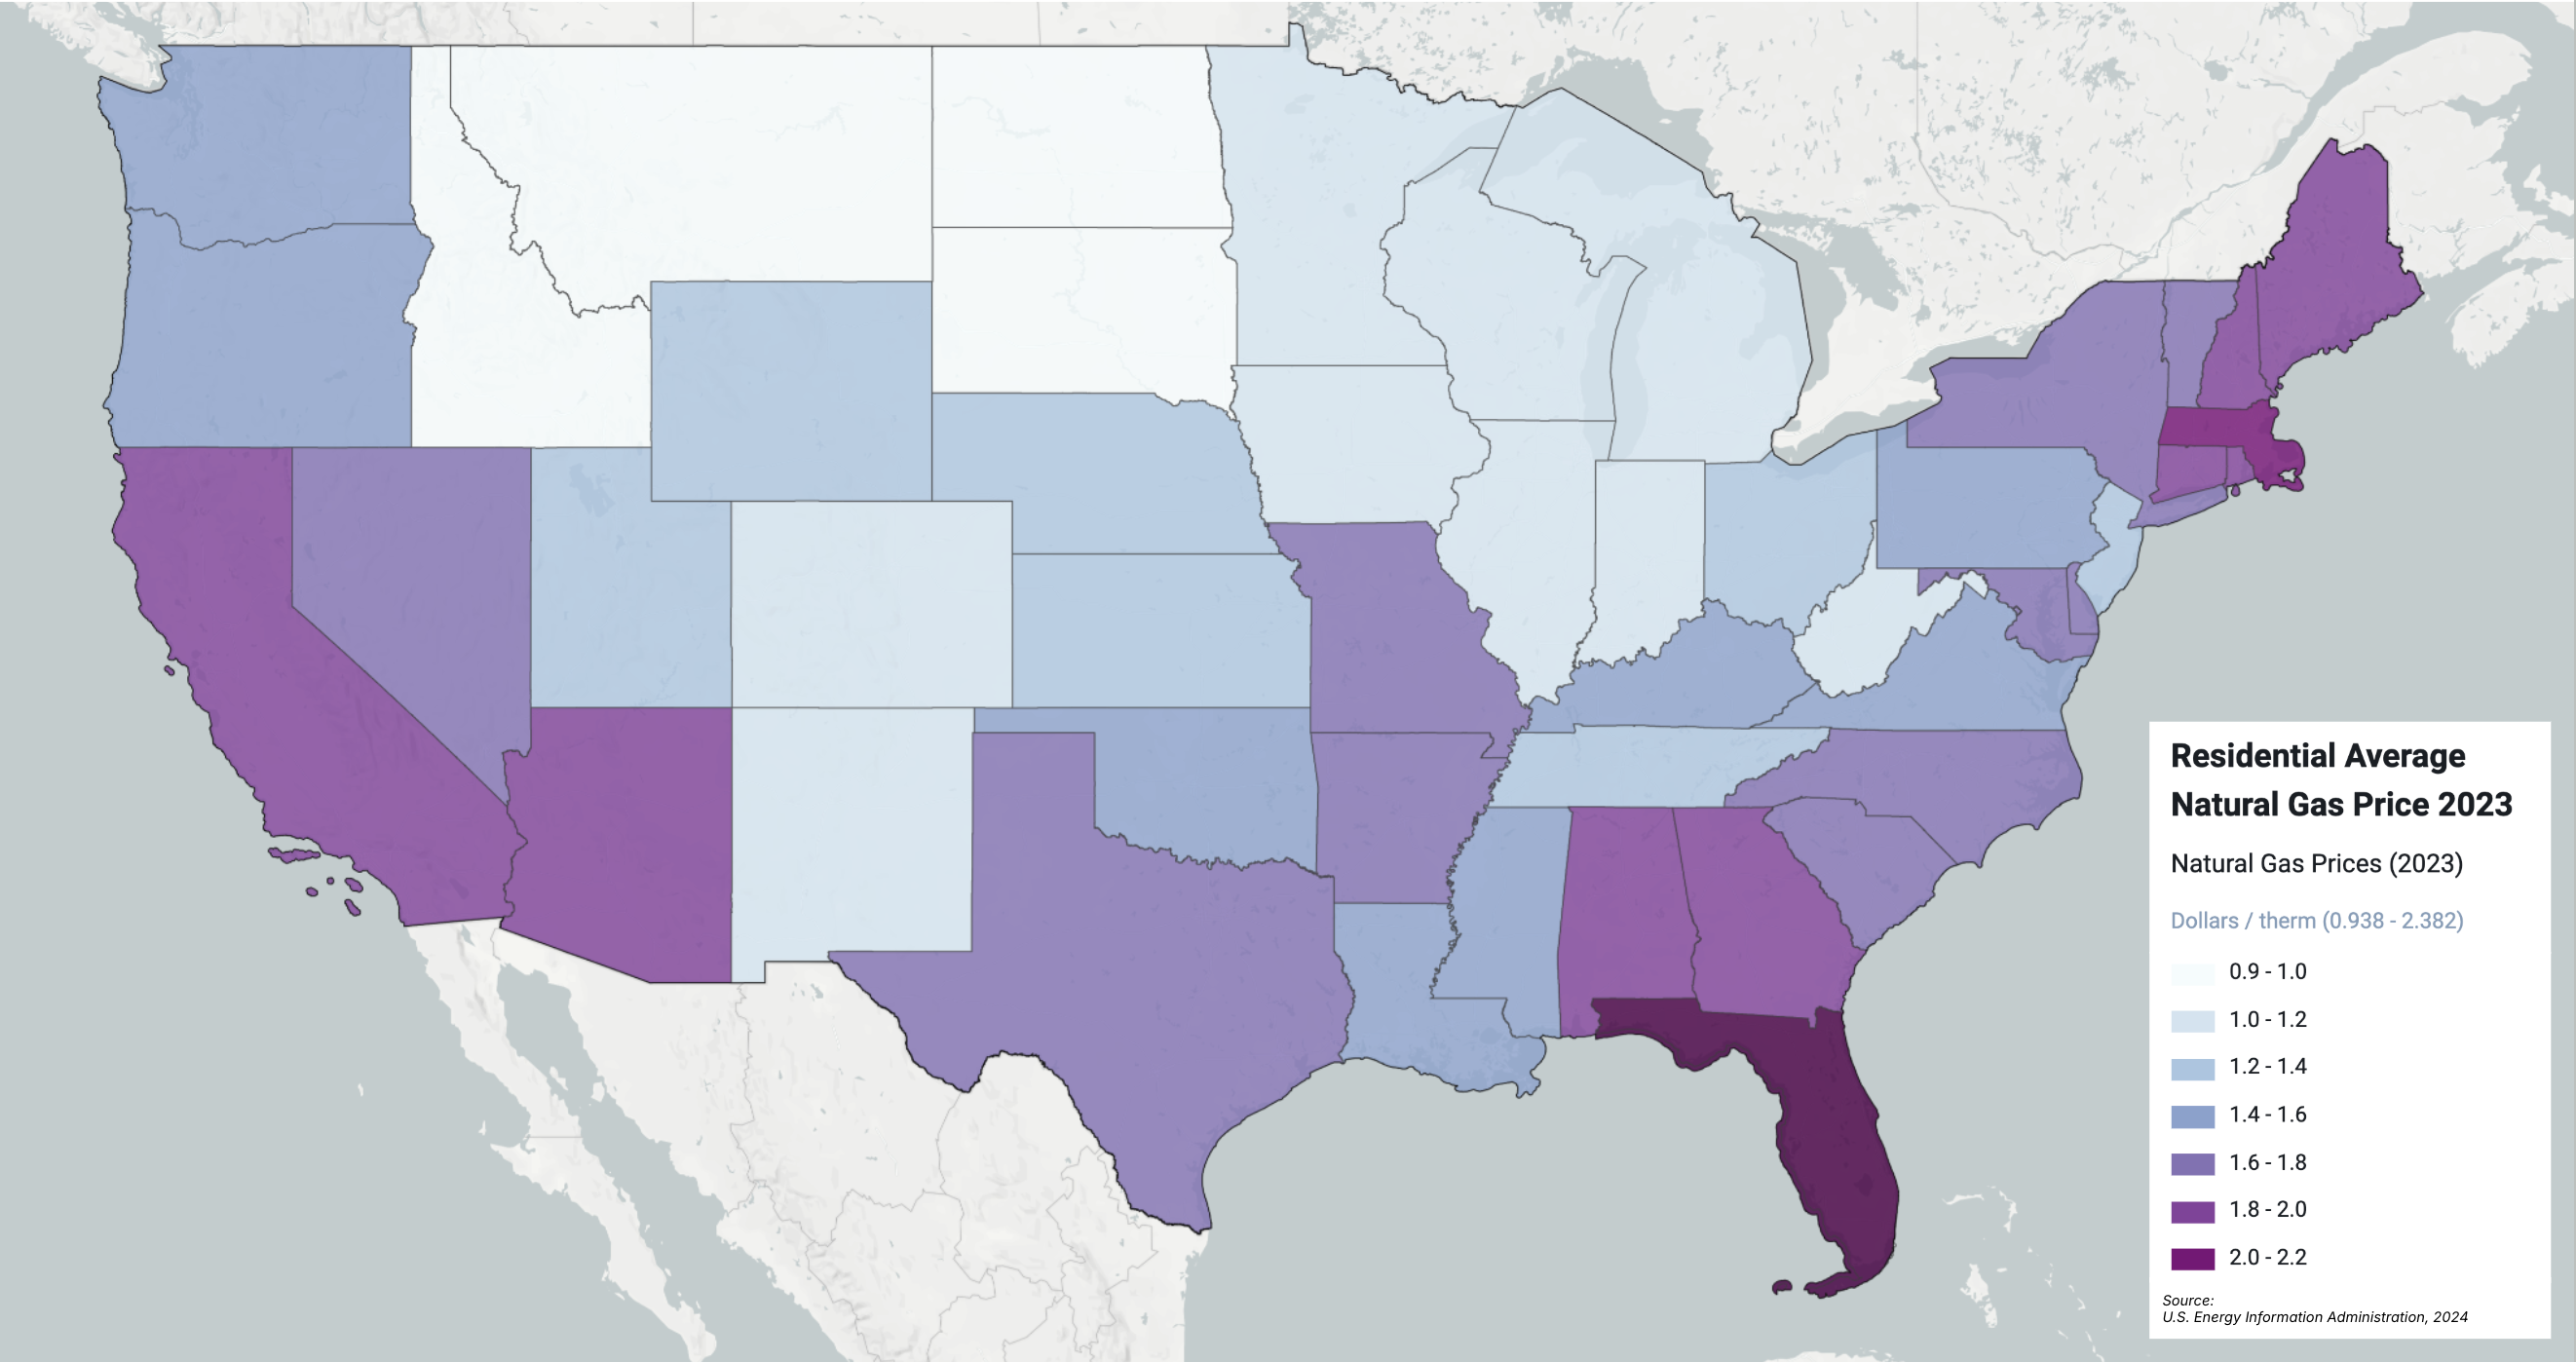
Natural gas prices by state are sourced from the 2023 EIA Natural Gas Annual Report21. The dataset contains average annual natural gas prices for the residential, commercial, and industrial sectors. At the time of update, year-2023 averages were not available for all states, including California, Indiana, Kansas, Maine, Minnesota, New Hampshire, Tennessee, Virginia, and West Virginia. For these states, the module is loaded with year-2022 averages.
Default Residential Water Costs
Default Input Parameters for Residential Water Costs shows the input parameter used to calculate household water cost and the default baseline Analyst uses. Users can input localized baselines and projected future-year values for more accurate and/or policy-oriented analysis. Water prices may include charges for both water supply and wastewater treatment.
Parameter | Default Baseline Value |
|---|---|
Residential water price | $7.74 per thousand gallons |
Output Metrics
The Household Costs module generates a mapped spatial output layer and corresponding data table; both can be used within Analyst for mapping and data exploration, and exported. The module also reports individual and comparative scenario results via summary charts, and generates a spreadsheet summary in Excel format. The attributes of the spatial output/data table are summarized in Household Costs Module Outputs.
Attribute(s) | Description |
|---|---|
Total Household Cost | Annual costs for fuel, auto ownership and maintenance, residential energy, and residential water, total for all households. |
Total Household Cost per Household | Annual costs for fuel, auto ownership and maintenance, residential energy, and residential water, per household. |
Transportation Cost | Annual fuel and auto ownership and maintenance costs, total for all households. |
Fuel Cost | Annual fuel costs, total for all households. |
Auto Ownership and Maintenance Cost | Annual auto ownership and maintenance costs, total for all households. |
Transportation Cost per Household | Annual transportation costs including fuel and auto ownership and maintenance, per household. |
Residential Utility Cost | Annual utility costs, including residential energy and water, total for all households. |
Residential Energy Cost | Annual residential electricity and natural gas costs, total for all households. |
Residential Water Cost | Annual residential water costs, total for all households. |
Total Residential Utility Cost per Household | Annual utility costs, including residential energy and water, per household. |
Residential Energy Cost per Household | Annual residential electricity and natural gas costs, per household. |
Residential Water Cost per Household | Annual residential water cost, per household. |