Existing Conditions Dashboard Functionality
The Existing Conditions Dashboard is interactive. You can:
Select the areas to include in the summary metrics, charts, and tables
Select a baseline year against which to measure population changes
Sort data tables to explore data
Export individual tabs as PDF files for use in reports
Export chart and table data for further analysis, visualization, or reporting
The Summary tab is your starting point – from there, you can select the areas to include in the charts, tables, and summary metrics across all the tabs. The guide below offers a quick visual reference to using the dashboard.
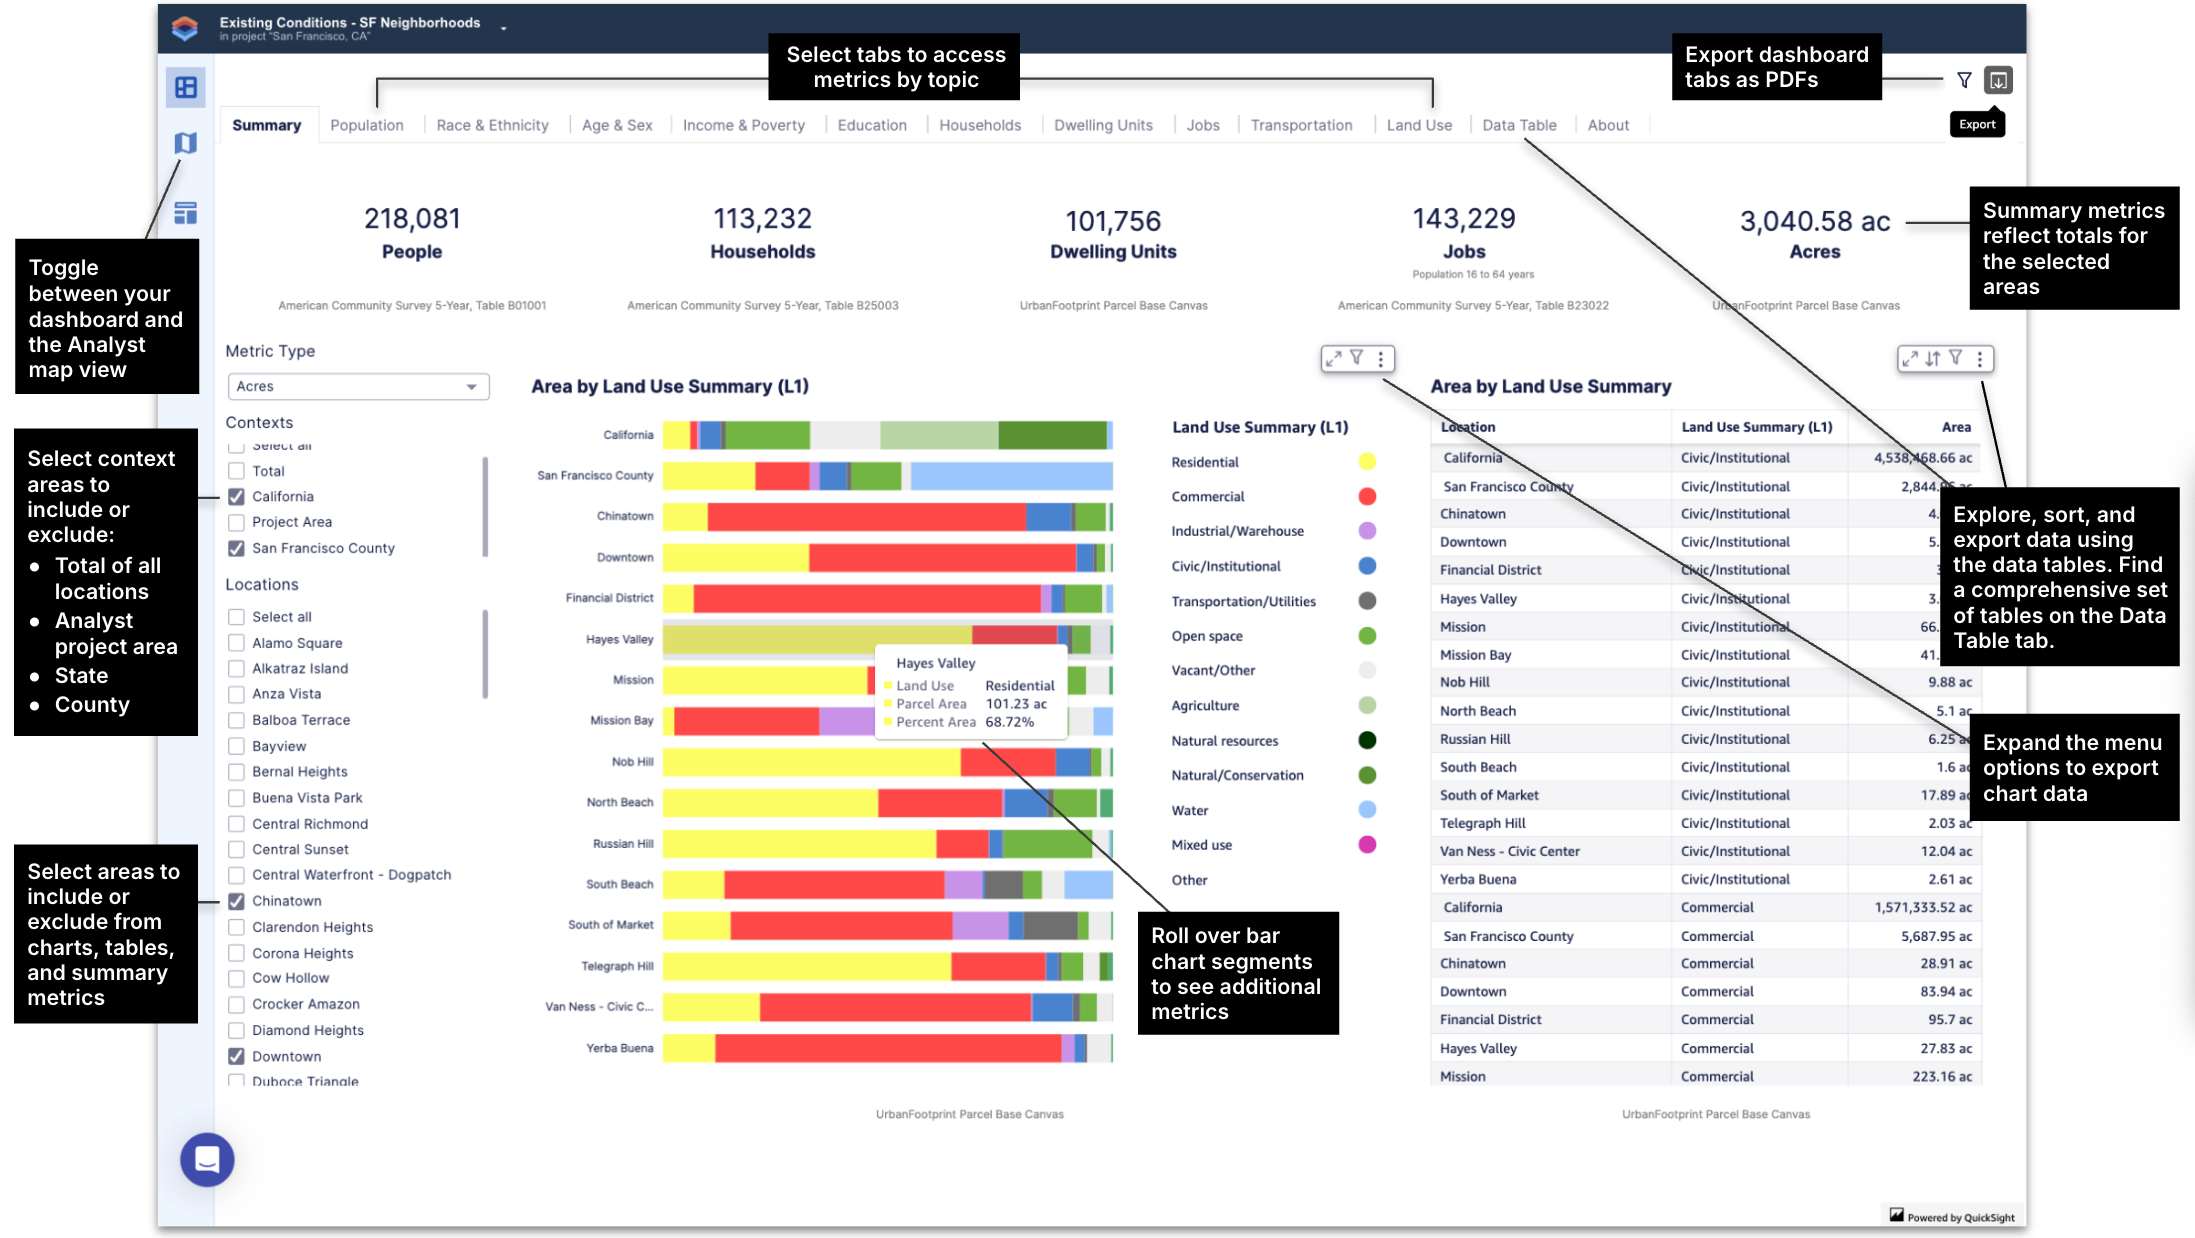
Use the many features of the Existing Conditions Dashboard to explore data via the charts and data tables. When ready, export the contents for communication and reporting.