Analysis Modules
 |
Analyst's suite of analysis modules readily produce comprehensive assessments of existing conditions and projected scenario impacts. Clear mapping and reporting allow you to compare results and better understand the impacts of planning and policy options.
Available Modules
Land Consumption
The Land Consumption Module measures how much land is used by growth scenarios, whether as infill or redevelopment in already urbanized areas, or as greenfield development. Results are provided in total and by category, including urban vacant, urban redevelopment, agriculture, woodland, and other greenfield land.
Energy Use
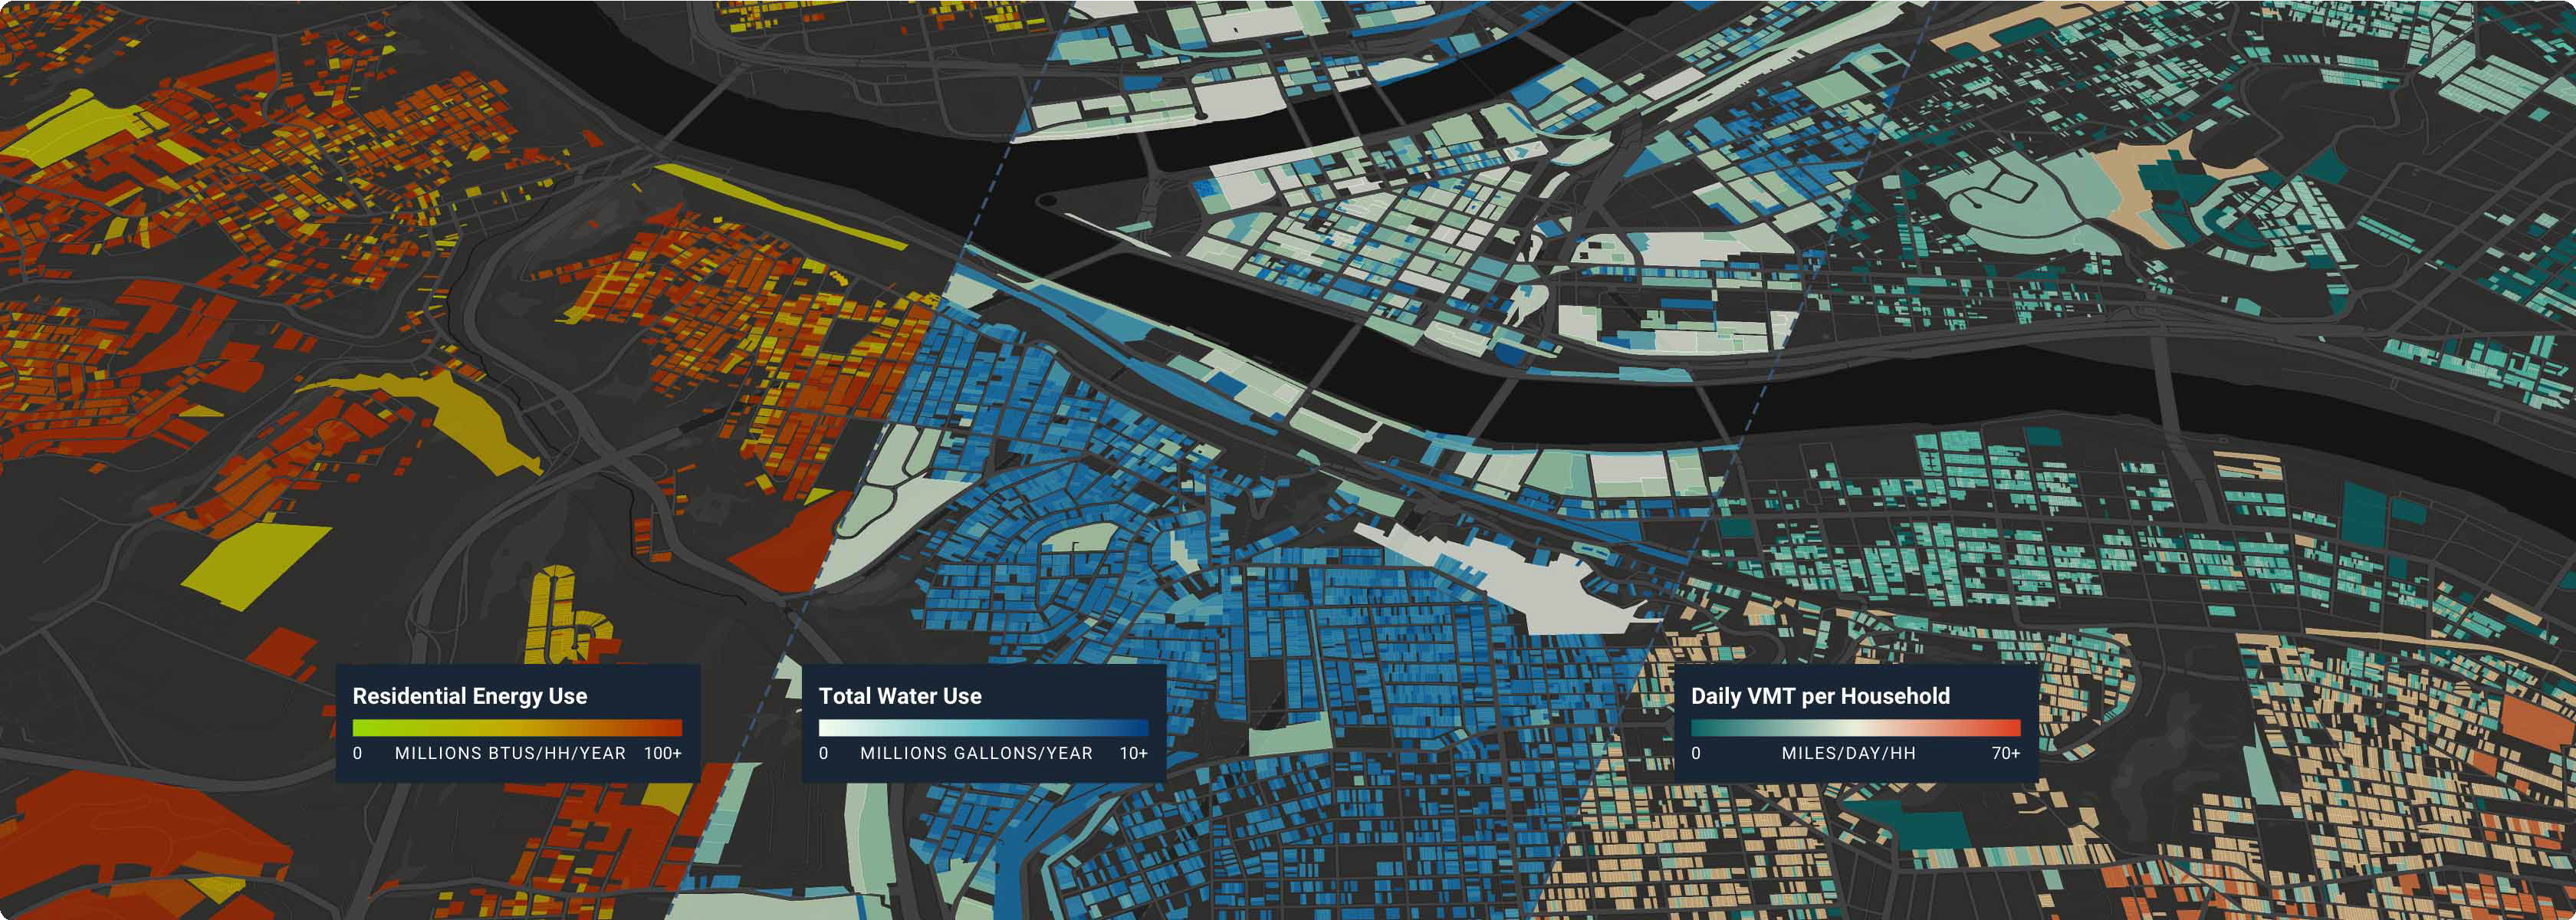
The Energy Use Module estimates electricity and natural gas consumption for residential and commercial buildings based on factors that vary by building type and state or climate zone. The results provide high-level estimates of energy use at the district, city, or other scales. Map the outputs to highlight how land use patterns and their inclusion of more compact or spacious building types affect energy use. You can use the default energy use factors, enter custom factors based on local data, or apply adjustment factors based on projected energy efficiency improvements to test policy scenarios.
Water Use
The Water Use Module estimates indoor and outdoor water consumption for residential and commercial buildings. Indoor water use is modeled on a per-capita or per-employee basis by building type or employment category. Outdoor water use is based on irrigated area at the parcel scale using location-specific evapotranspiration values. The results provide high-level estimates of water use at the district, city, or other scales. Map the outputs to highlight the impact of land use patterns on water demand. You can use the default rates, enter custom rates based on local data, or apply adjustment factors based on assumed water conservation or efficiency measures to test policy scenarios.
Walk Accessibility
The Walk Accessibility module measures and maps walk times to schools, parks, transit stops, or other selected point locations using network-based analysis that incorporates OpenStreetMap walk, bike, and drive path data. Map the outputs to visualize 5-, 10-, and 15-minute walk sheds, evaluate relative walkability, and identify areas with low access to important destinations. You can customize the analysis using your own destinations, or adjust travel speed to reflect walking, biking or other modes. Take a Walk in the Park on our blog.
Transit Accessibility
The Transit Accessibility module measures and maps transit accessibility and travel times to employment and other key destinations such as schools, hospitals, and parks. The module uses General Transit Feed Specification (GTFS) data for transit lines, stops, and headways, and incorporates network-based analysis using OpenStreetMap data for the walk portion of transit trips. You can run analysis on any selection of point locations, from grocery stores or community facilities to planned development sites. Pinpoint Transit-Poor Zones on our blog.
Transportation
The Transportation module estimates vehicle miles traveled (VMT) and transportation mode share, producing results that vary according to density, diversity of land uses, and other factors associated with land use and proximity to transit and other destinations. Map the outputs to visualize and compare VMT, transit share, or walk/bike mode share across areas or scenarios, or summarize results to compare high-level outcomes. You can also run the Emissions and Household Costs modules to gauge the impacts of VMT on greenhouse gas and pollutant emissions and household driving costs.
Emissions
The Emissions module estimates annual emissions associated with energy use (including electricity and natural gas), water use, and transportation. The module is loaded with an average passenger vehicle fuel economy, baseline emission rates for greenhouse gases, and air pollutant emission rates for passenger vehicles including NOx, PM10, PM2.5, SOx, CO, and VOCs. You can use the default fuel economy and emission rates, or adjust them to gauge the effects of vehicle and energy portfolio improvements. Watch a webinar about Building Resilient & Equitable Communities.
Household Costs
The Household Cost module estimates annual household expenses for transportation and utilities based on price assumptions and estimated VMT, building energy use, and water use. Map the outputs to highlight the relative savings that can come with location-efficient development and more compact land use patterns. You can use the baseline price assumptions for electricity, natural gas, and auto fuel (along with fuel economy), or enter custom values based on local data or projections.
Risk and Resilience
The Risk and Resilience module quantifies housing units, jobs, and land area in flood, wildfire risk, and sea level rise zones. Map the hazard risk and output layers to visualize community risk and inform planning. See examples of mapping Fire, Flood, and Sea Level Rise risk on our blog.
Conservation (California only)
The Conservation module measures the impacts of land use change on a range of existing natural and agricultural resources. Report on water quality, habitat preservation, agricultural factors, and carbon sequestration and storage impacts. This module was developed in collaboration with The Nature Conservancy, and is available for analysis in California only. Learn more about Climate Action Planning using the module on our blog. The module methodology is available on request.