Earthquakes
An earthquake is the sudden shaking of the Earth’s surface caused by the release of energy from the Earth’s crust. This energy release typically happens due to the movement of tectonic plates, generating seismic waves that travel through the Earth. Earthquakes can vary in strength and length, potentially causing significant damage to buildings, infrastructure, and the environment and posing serious risks to human safety.
Understanding earthquake probability across the United States helps anticipate and mitigate potential threats to the built environment and communities. Proactive risk management based on accurate hazard predictions protects physical assets and supports sustainable development. Earthquakes are measured using various scales and methods to assess their magnitude, intensity, and other characteristics. Some examples include magnitude scales, intensity scales, seismograph measurements, peak ground velocity (PGV), and peak ground acceleration (PGA).
For our earthquake metrics, we report the annual probability of experiencing PGA thresholds of 18%g, 34%g, and 65%g, representing moderate, high, and very high categories.
Example Maps in Analyst
This pair of images showcases how you can visualize earthquakes in Analyst. In these examples, exposure to an earthquake with 34 %g stronger peak ground acceleration (PGA) is shown for the contiguous United States (CONUS) and Los Angeles County in California.
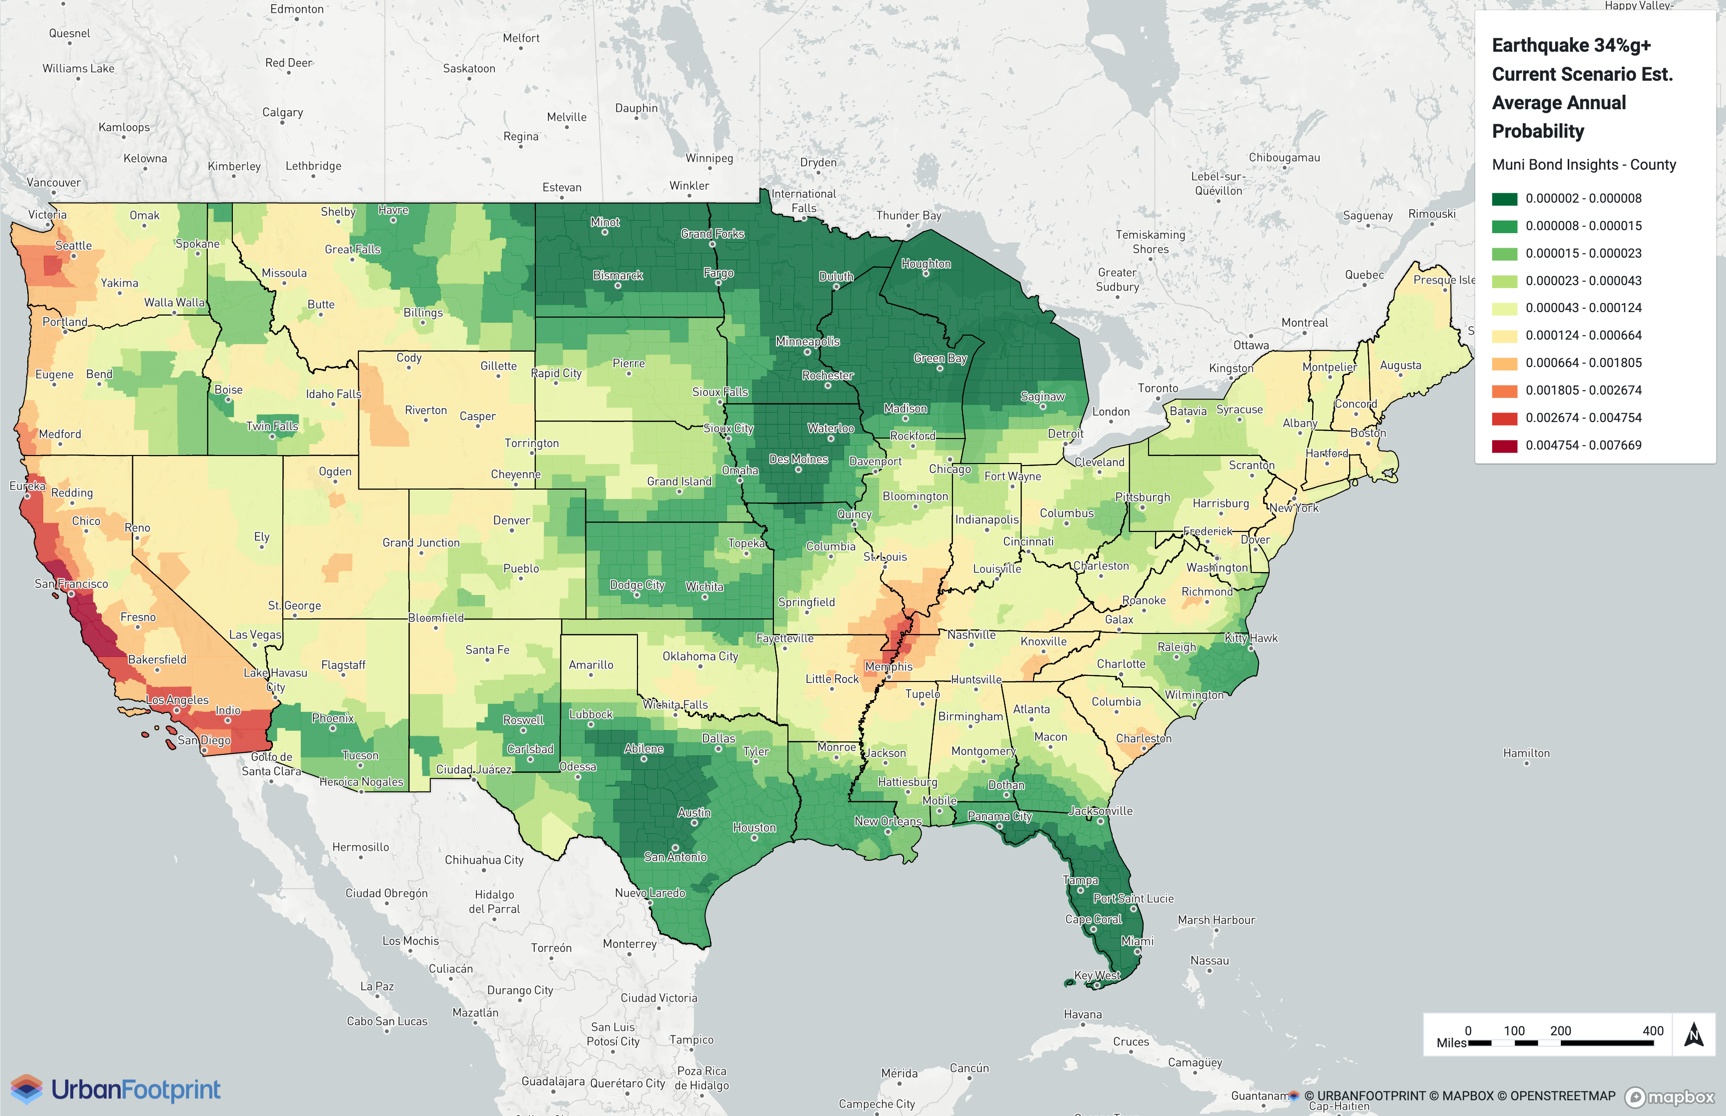
Current scenario (CONUS)
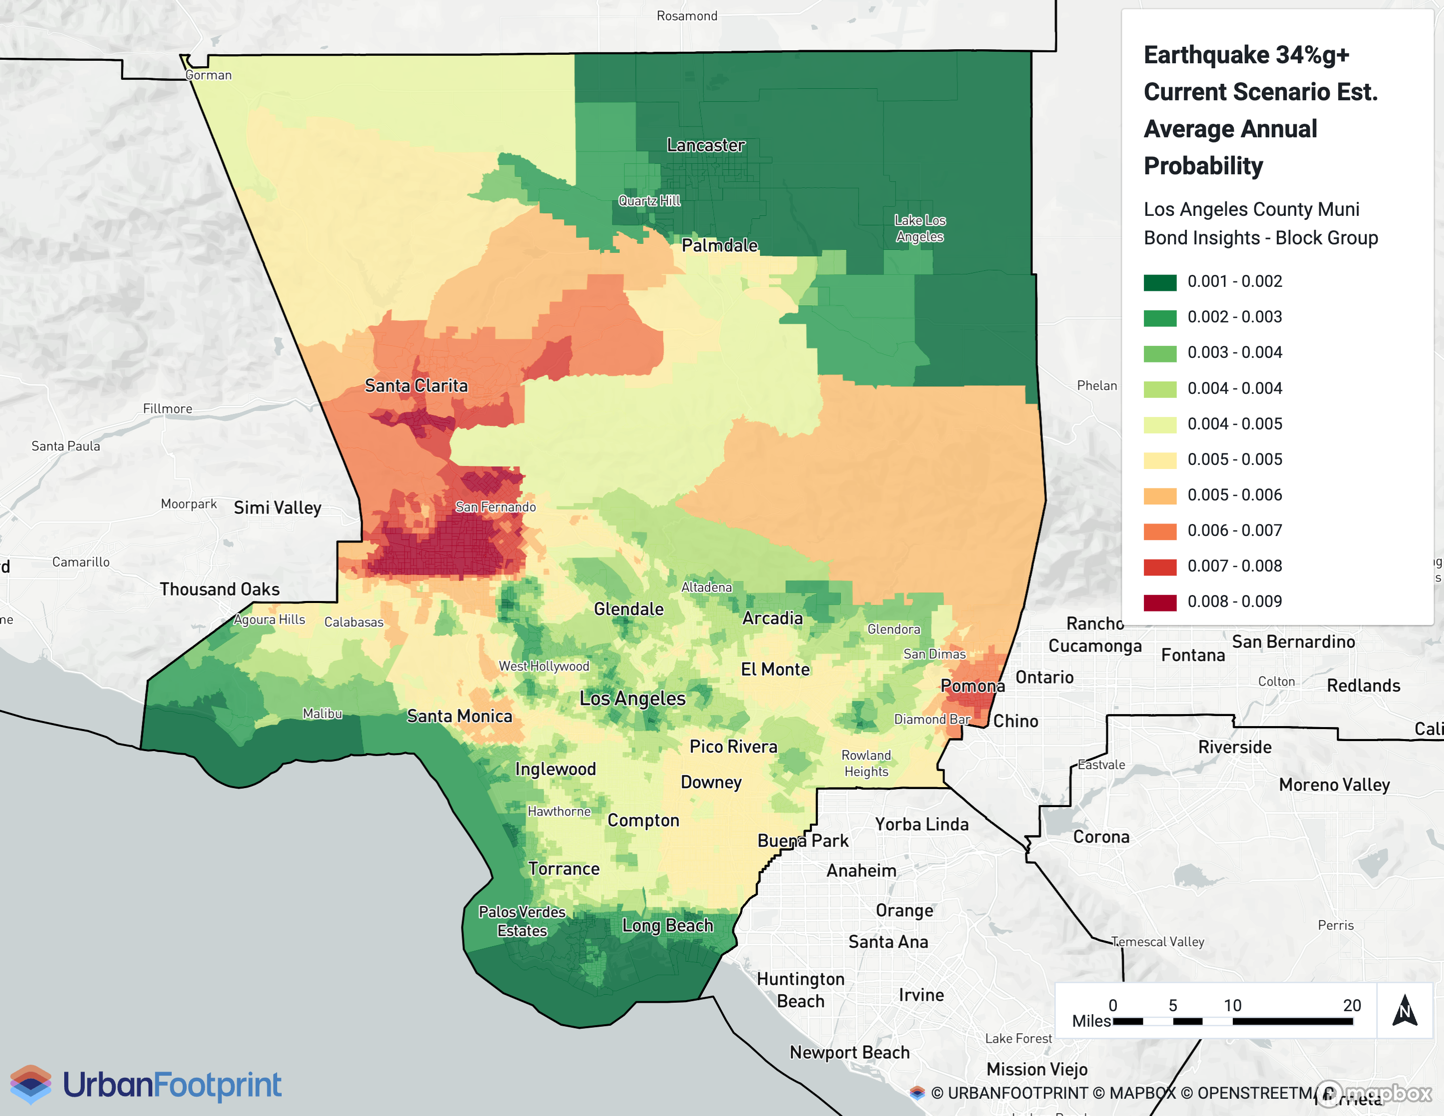
Current scenario (Los Angeles County)
Details
Peak ground acceleration (PGA) is a measure of the intensity of ground shaking at a specific location. It represents the highest acceleration recorded during an earthquake and is typically expressed in terms of gravity (g), where 1 g is equivalent to the acceleration due to Earth's gravity (approximately 9.8 m/s2). It provides a quantitative measure of how strongly the ground shakes during an earthquake; higher values indicate more intense shaking.
The U.S. Geological Survey's (USGS) National Seismic Hazard Model (NSHM) predicts the likelihood and severity of earthquake ground shaking in the United States. The USGS provides probabilistic seismic hazard curves and uniform-hazard ground motion values, including PGA, calculated for a grid with 0.2-degree spacing in the contiguous United States (CONUS) and Alaska and 0.02-degree spacing in Hawaii using the 2021 NSHM.
USGS provides hazard curve data representing National Earthquake Hazards Reduction Program (NEHRP) site classes AB to E. A NEHRP site class represents the time-averaged shear-wave velocity of the top 30 meters of soil (Vs30), a primary resource used by the earthquake engineering community to account for seismic site conditions. For their national map, USGS uses a single soil type (Site Class BC or firm rock) to represent seismic hazard. However, soil type varies significantly across the country, and assuming one site class nationwide can lead to significant over- or under-estimation of the seismic hazard at specific locations.
Instead of using a single site class for the entire United States, we use a machine learning-derived Vs30 map of CONUS (Geyin et al. (2022) resampled onto H3 grids at zoom level 9. Using the Vs30 data, we assign an NEHRP Site Class to each H3 cell based on the Vs30 value. Because the Vs30 data is only available for CONUS, we default to Site Class BC for Alaska and Hawaii, consistent with the USGS National Seismic Hazard Map. Also, if an H3 cell’s Vs30 value corresponds to Site Class A, we reassign it to AB since USGS does not provide hazard curves for Site Class A.
Using the resulting hazard curves, we linearly interpolate the annual probability of experiencing specific peak ground acceleration (PGA) thresholds of 18%, 34%, and 65%g, representing moderate, high, and very high categories (for a comparison to other earthquake measures, see USGS: Earthquake Magnitude, Energy Release, and Shaking Intensity).
Our methodology produces a single, enhanced seismic hazard map for the United States that accounts for variability in Vs30.