Drought
Drought causes billions of dollars of economic loss to the U.S. each year, with hundreds of millions of acres of agriculture exposed to some level of drought conditions. Severe drought is typically associated with substantial impacts. For example, crop or pasture loss is likely, water shortages are common, and water restrictions are imposed. However, there is regional variability in the impacts of drought. Over the United States, drought is widely expected to increase, and process-based climate model output is needed to quantify this changing risk effectively.
UrbanFootprint Drought provides the monthly probability of moderate or worse drought for current and future climate scenarios.
Example Maps in Analyst
This pair of images showcases how you can visualize drought in Analyst. In these examples, there is an increased monthly probability of moderate or worse drought, with more areas exposed to drought in the future scenario.
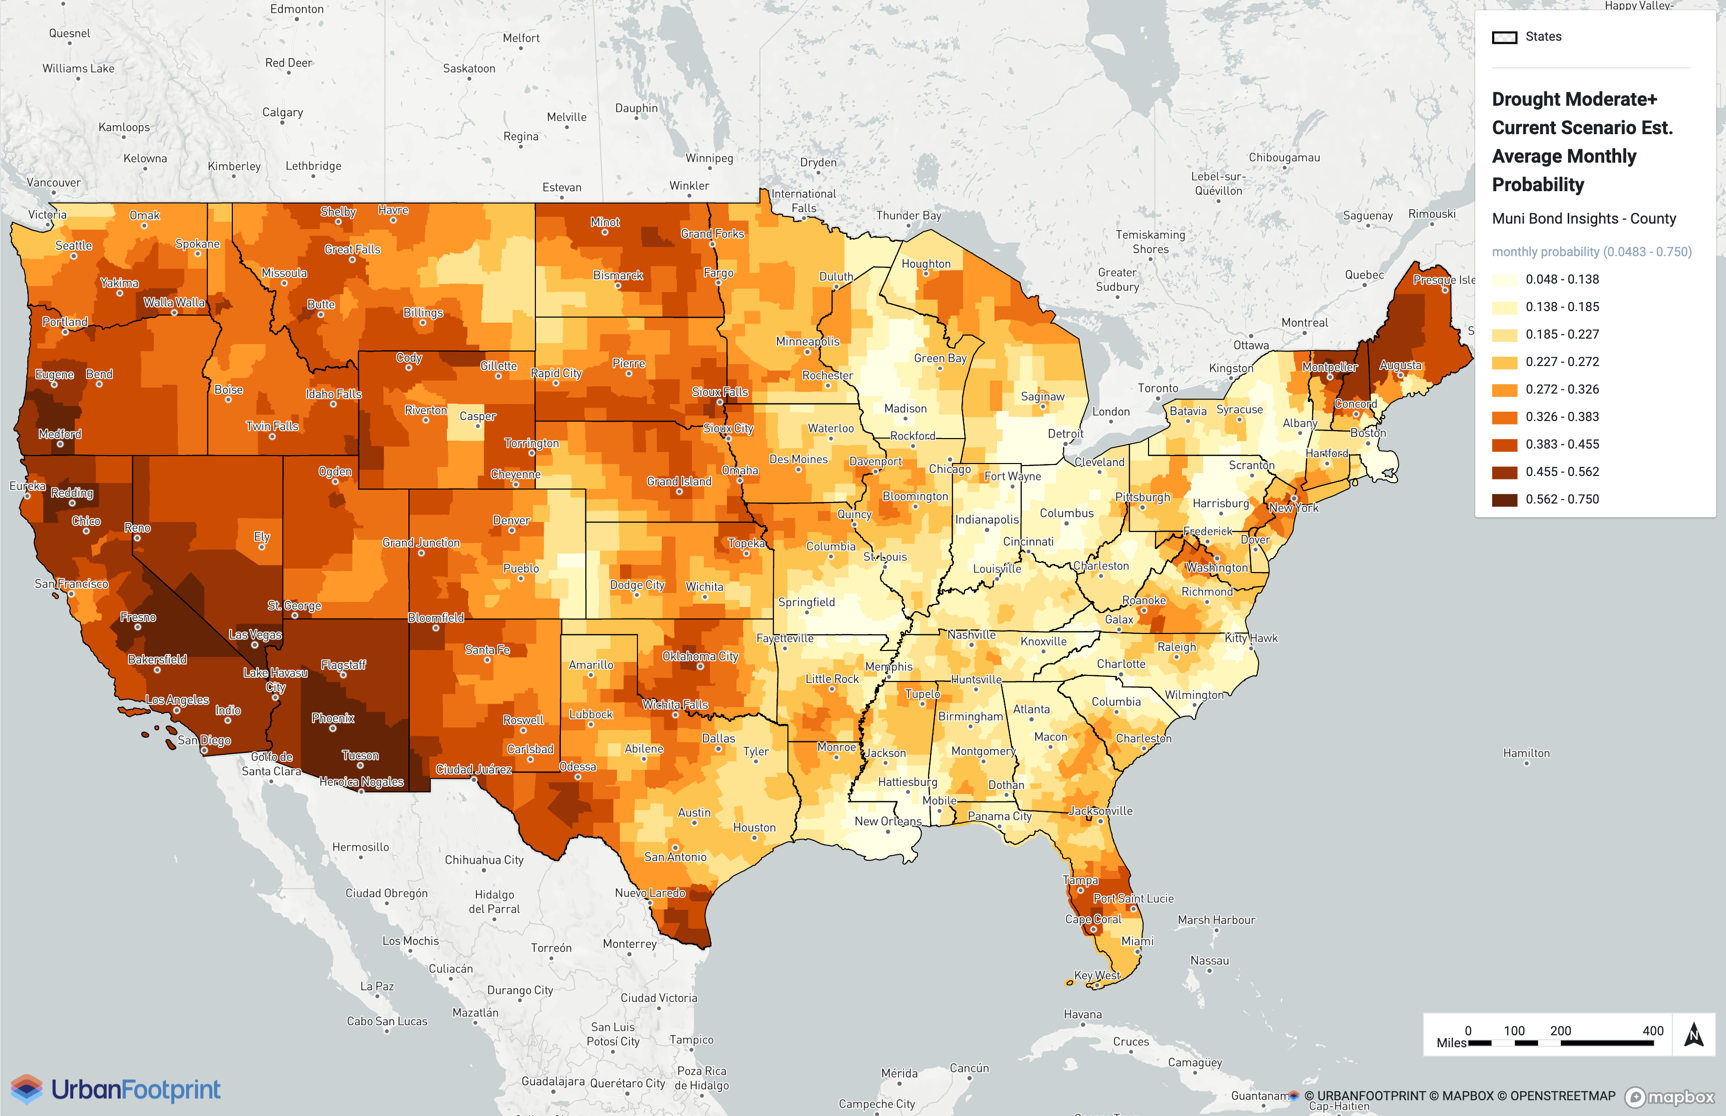
Current scenario
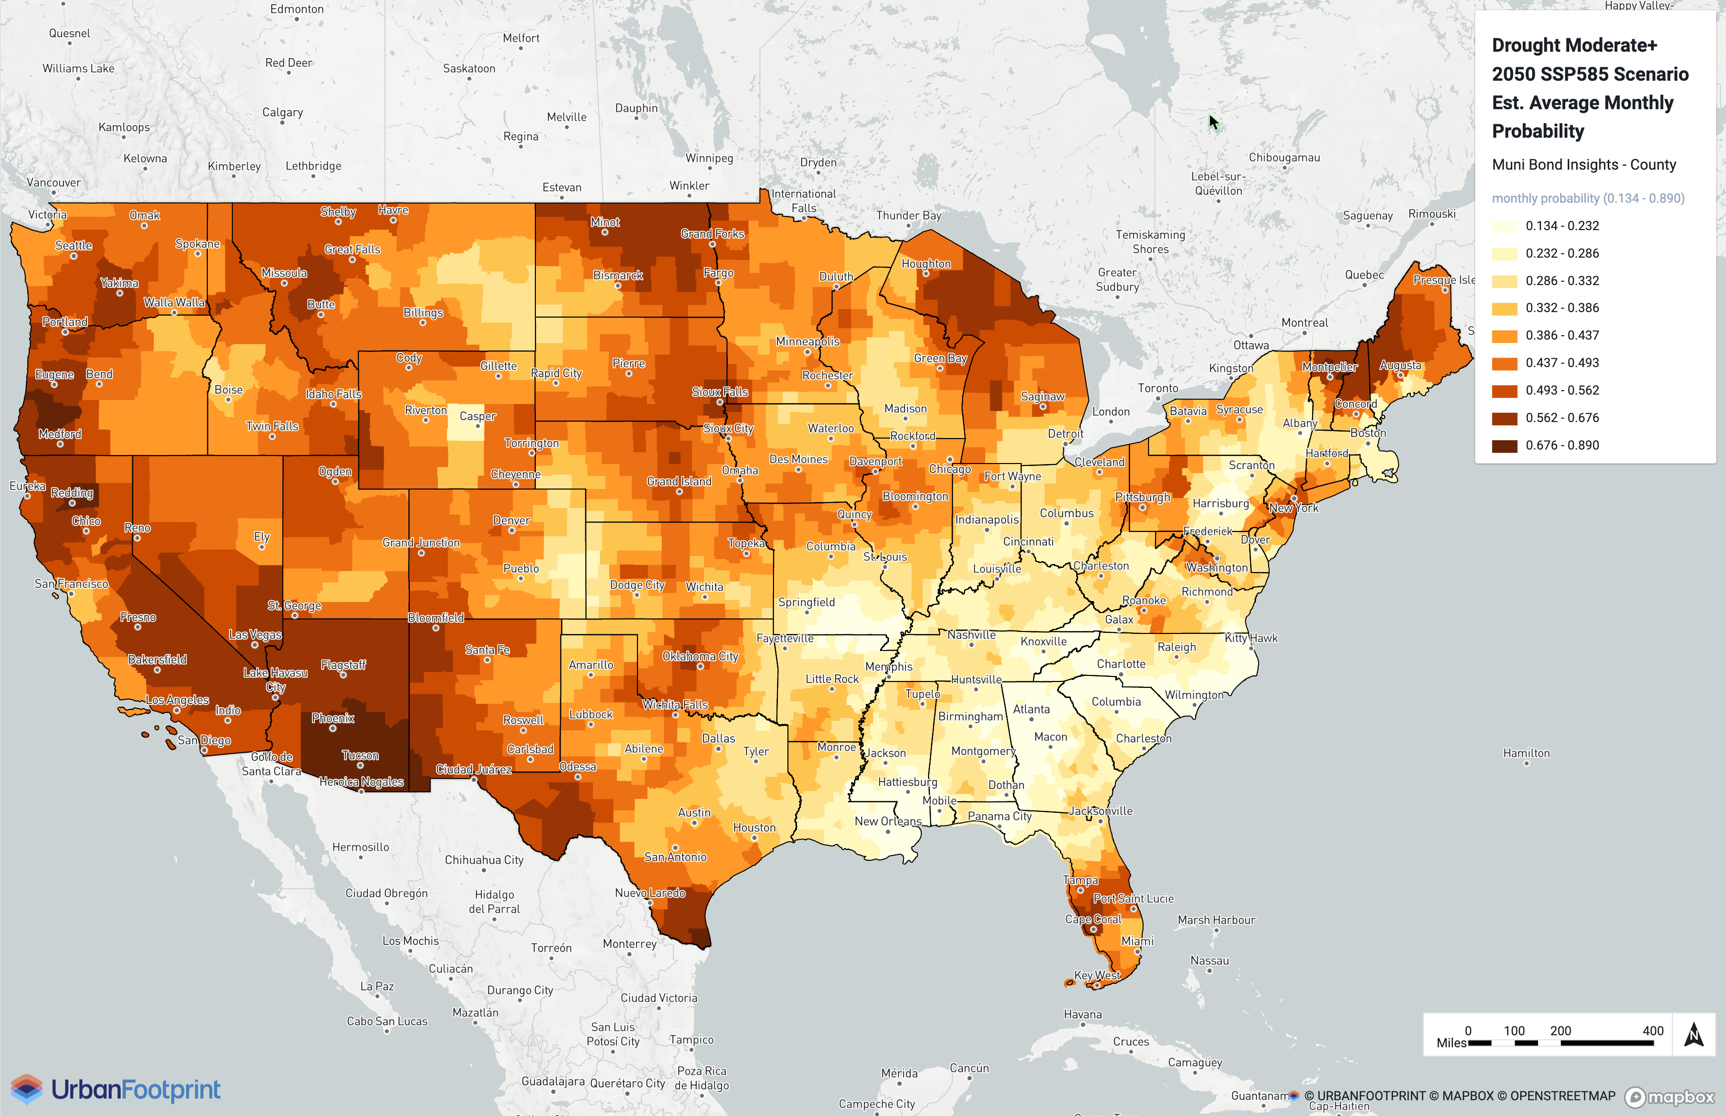
SSP5-8.5 2050 scenario
Details
We use the self-calibrating variant of the Palmer Drought Severity Index (scPDSI) to estimate drought in the United States. The scPDSI, the longest-used drought index, accounts for the supply and demand of soil moisture, making it well-suited for future projections.
Negative values indicate drought in the scPDSI. We report the monthly probability of moderate ( scPDSI), severe drought (scPDSI), and extreme (4 scPDSI) or worse drought in the current and future scenarios. Severe drought tends to indicate the point at which impacts become substantial.
To represent current risk, we use the CRU scPDSI historical data (1900-2020), which offers global coverage at a spatial resolution of 0.5° x 0.5°. To calculate future drought, we use multimodel scPDSI from the "state-of-the-art" 25 CMIP6 models from Zhao and Dai (2022), provided at 2.5° x 2.5° spatial resolution. However, global climate models have intrinsic biases that add uncertainty to projections, especially multimodel mean, which exhibits less variability and a lower range than observed historical data.
To preserve the higher spatial resolution (from CRU scPDSI) and reduce the bias from the multimodel mean, we calculate the change in severe drought between future scenarios and historical simulation for each grid cell and add the difference to the observed estimate of severe drought. Bias correction is common practice, and reasonably assumes that the multimodel mean model is better at predicting change than the absolute values (Thrasher et al., (2023), Larson et al. (2017), Forster et al., (2013), Navarro-Racines et al. (2020)).