Run an Analysis for Insights with Dashboards
You can run an Insights analysis for a set of locations for specific use cases. These analyses create summary dashboards and detailed layers in Analyst specific to your selected locations.
You can run an Insights with Dashboards analysis on any point layer in Analyst, including those you've uploaded to the project, those we've processed or uploaded for you, or data layers available from our reference library. We recommend using a project with fewer than 500k locations. Contact us if you need to process a larger set of locations.
If you don't already have your locations available as layers in a project in Analyst, you should first collect your locations.
Choose an Insight with Dashboards
Choose one of these dashboards:
General Location Analysis – Conduct site evaluation or selection for a portfolio of sites. Perform rapid assessments for real estate owners, assess site growth and expansion, or make buy-and-sell decisions.
Use this dashboard to assess one type of location (such as retail, grocery, restaurants, or commercial real estate). Use this dashboard to do cross-state comparisons.
Financial Insights – For the financial services industry, track progress towards compliance with government regulations, such as Fair Lending Acts (FLA) and the Community Reinvestment Act (CRA), and to prepare for climate disclosure (such as California climate disclosure laws and SEC regulations aligned with Taskforce on Climate-related Financial Disclosures (TCFD)).
Use this dashboard to assess one type of location (such as bank branches, mortgages, or small business loans). Use this dashboard to make cross-state comparisons.
Climate Physical Risk Insights – Conduct a physical risk assessment for a business or portfolio of locations. This assessment provides an overview of physical risk for reporting, identifies locations with hazard risk, and compares hazard risk and severity between current and future scenarios.
Use this dashboard if you have multiple (up to five) location types in your portfolio (such as offices, retail stores, warehouses, manufacturing, and so on.)
Prepare Data for Dashboard Insights
Some dashboards have required or optional fields that must be present in the data to run. These fields are displayed directly in the dashboards.
Field Name | Purpose | Recommended | Required | Values |
|---|---|---|---|---|
| This field is displayed in the dashboard and can be used to find corresponding places in external data. It could be a name or ID. If you added your locations as a lat/lon file, you've already included this information and don't need to do it again. |
| None | String or integer values. Each row must contain a different value. |
| A field that will be used to group your locations. | None | Climate Physical Risk Insights | String or integer values. Up to five categories. |
Select the layer and export it as CSV with geometries.
Open the downloaded CSV file with a spreadsheet application and add these columns as needed:
location_id– Optional for all dashboards. To retain a connection to your data, include unique IDs for each location.location_type– Required for Climate Physical Risk Insights. Identify up to five location types, such as retail, office, warehouse, or another meaningful category for your set of locations. If you don't have a preference, choose a generic category, such as any, many, or location. If you don't add this column, the Climate Physical Risk Insights option will be disabled, and you won't be able to select it. If you already have a column with these details, you can rename it and verify that it includes a maximum of five.
Add the details to each location row included in the file.
Save the file and upload it to Analyst.
Open your project in Analyst.
From the Layers list, click the layer on which you would like to get additional insights.
The dashboard's name will use the layer name as its display name. If you're using a layer you added to Analyst, you can rename it to your preferred name before running the analysis.
Select Insights.
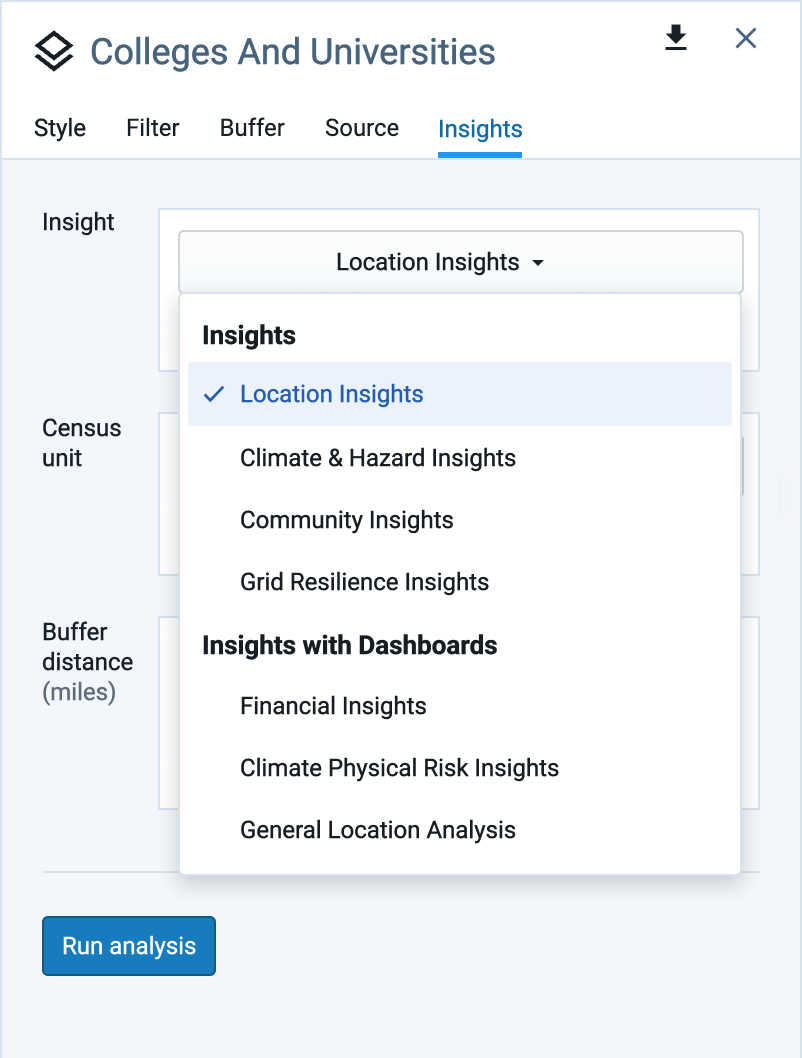
Select one of the available Insights from Insights with Dashboards:
Financial Insights – Track progress towards compliance with government regulations and prepare for climate disclosure.
General Location Analysis – Conduct site evaluation or selection for a portfolio of sites.
Climate Physical Risk Insights – Conduct a physical risk assessment for a business or portfolio of locations.
If you don't see these options, contact us if you want to access them.
Click Run analysis.
The analysis starts immediately, and the time varies depending on the type of Insight and project size, but it can take up to several hours. When finished, you can analyze your locations' Insights in dashboards and visually on maps.