Review Dashboard Insights
When your analysis is complete, you'll see a message at the bottom of the Analyst window with a link to VIEW the dashboard. You'll also receive an email with a direct link to view the dashboard. When you click the link, you'll be prompted to sign in if you haven't already done so. You should bookmark this link so you can use it to review future dashboards created by anyone in your organization.
With this link, you can easily navigate the organization's dashboards.
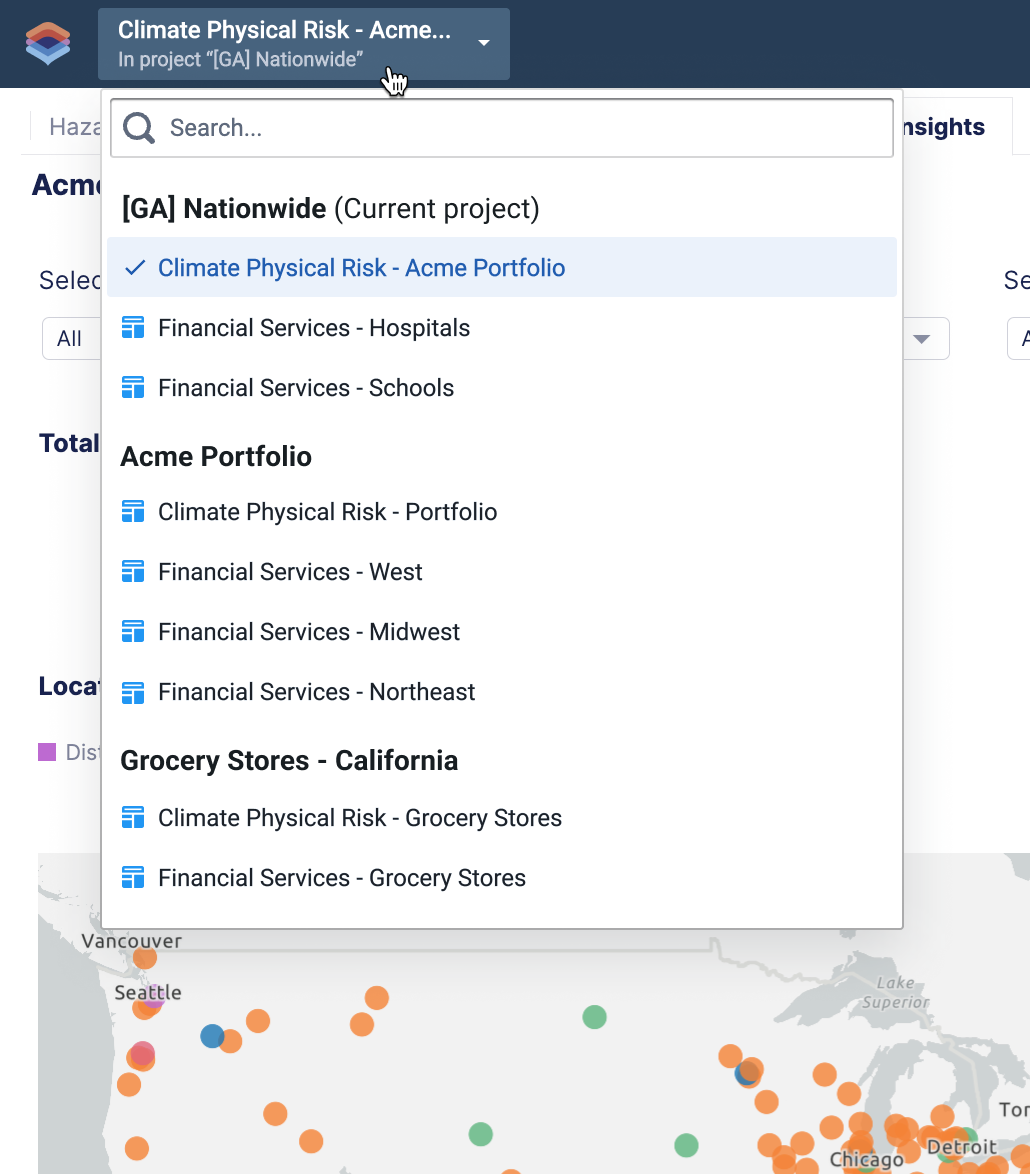 |
Click the drop-down
 next to the dashboard name to see all projects with their associated dashboards.
The list shows projects first, followed by their dashboards, all in alphabetical order. If a project doesn't include a dashboard, it doesn't appear in this list.
Type a name or phrase into the Search field for a specific dashboard.
The dashboards that match your search appear automatically.
Scroll and select a dashboard.
Using the dashboards, you can visualize hazards and sociodemographic information in the areas where your locations are. You can also see how your locations perform according to climate and hazard risk models, compare subsets of your locations, and more.
See these templates for examples of the information available in each dashboard:
After reviewing the high-level details on the dashboard, you can examine more information about specific locations in Analyst. See Review Insights in Analyst to get started.