Nationwide Project (example)
Follow this example to set up a national portfolio project, using nationwide hospitals as an example. This workflow helps you understand how to:
Load and symbolize Insights layers.
Filter Insights layers to focus on a portfolio.
Buffer Insights layers to review the community context surrounding a portfolio.
Set up a National Project
Follow these steps to set up a national project, using nationwide hospitals as an example.
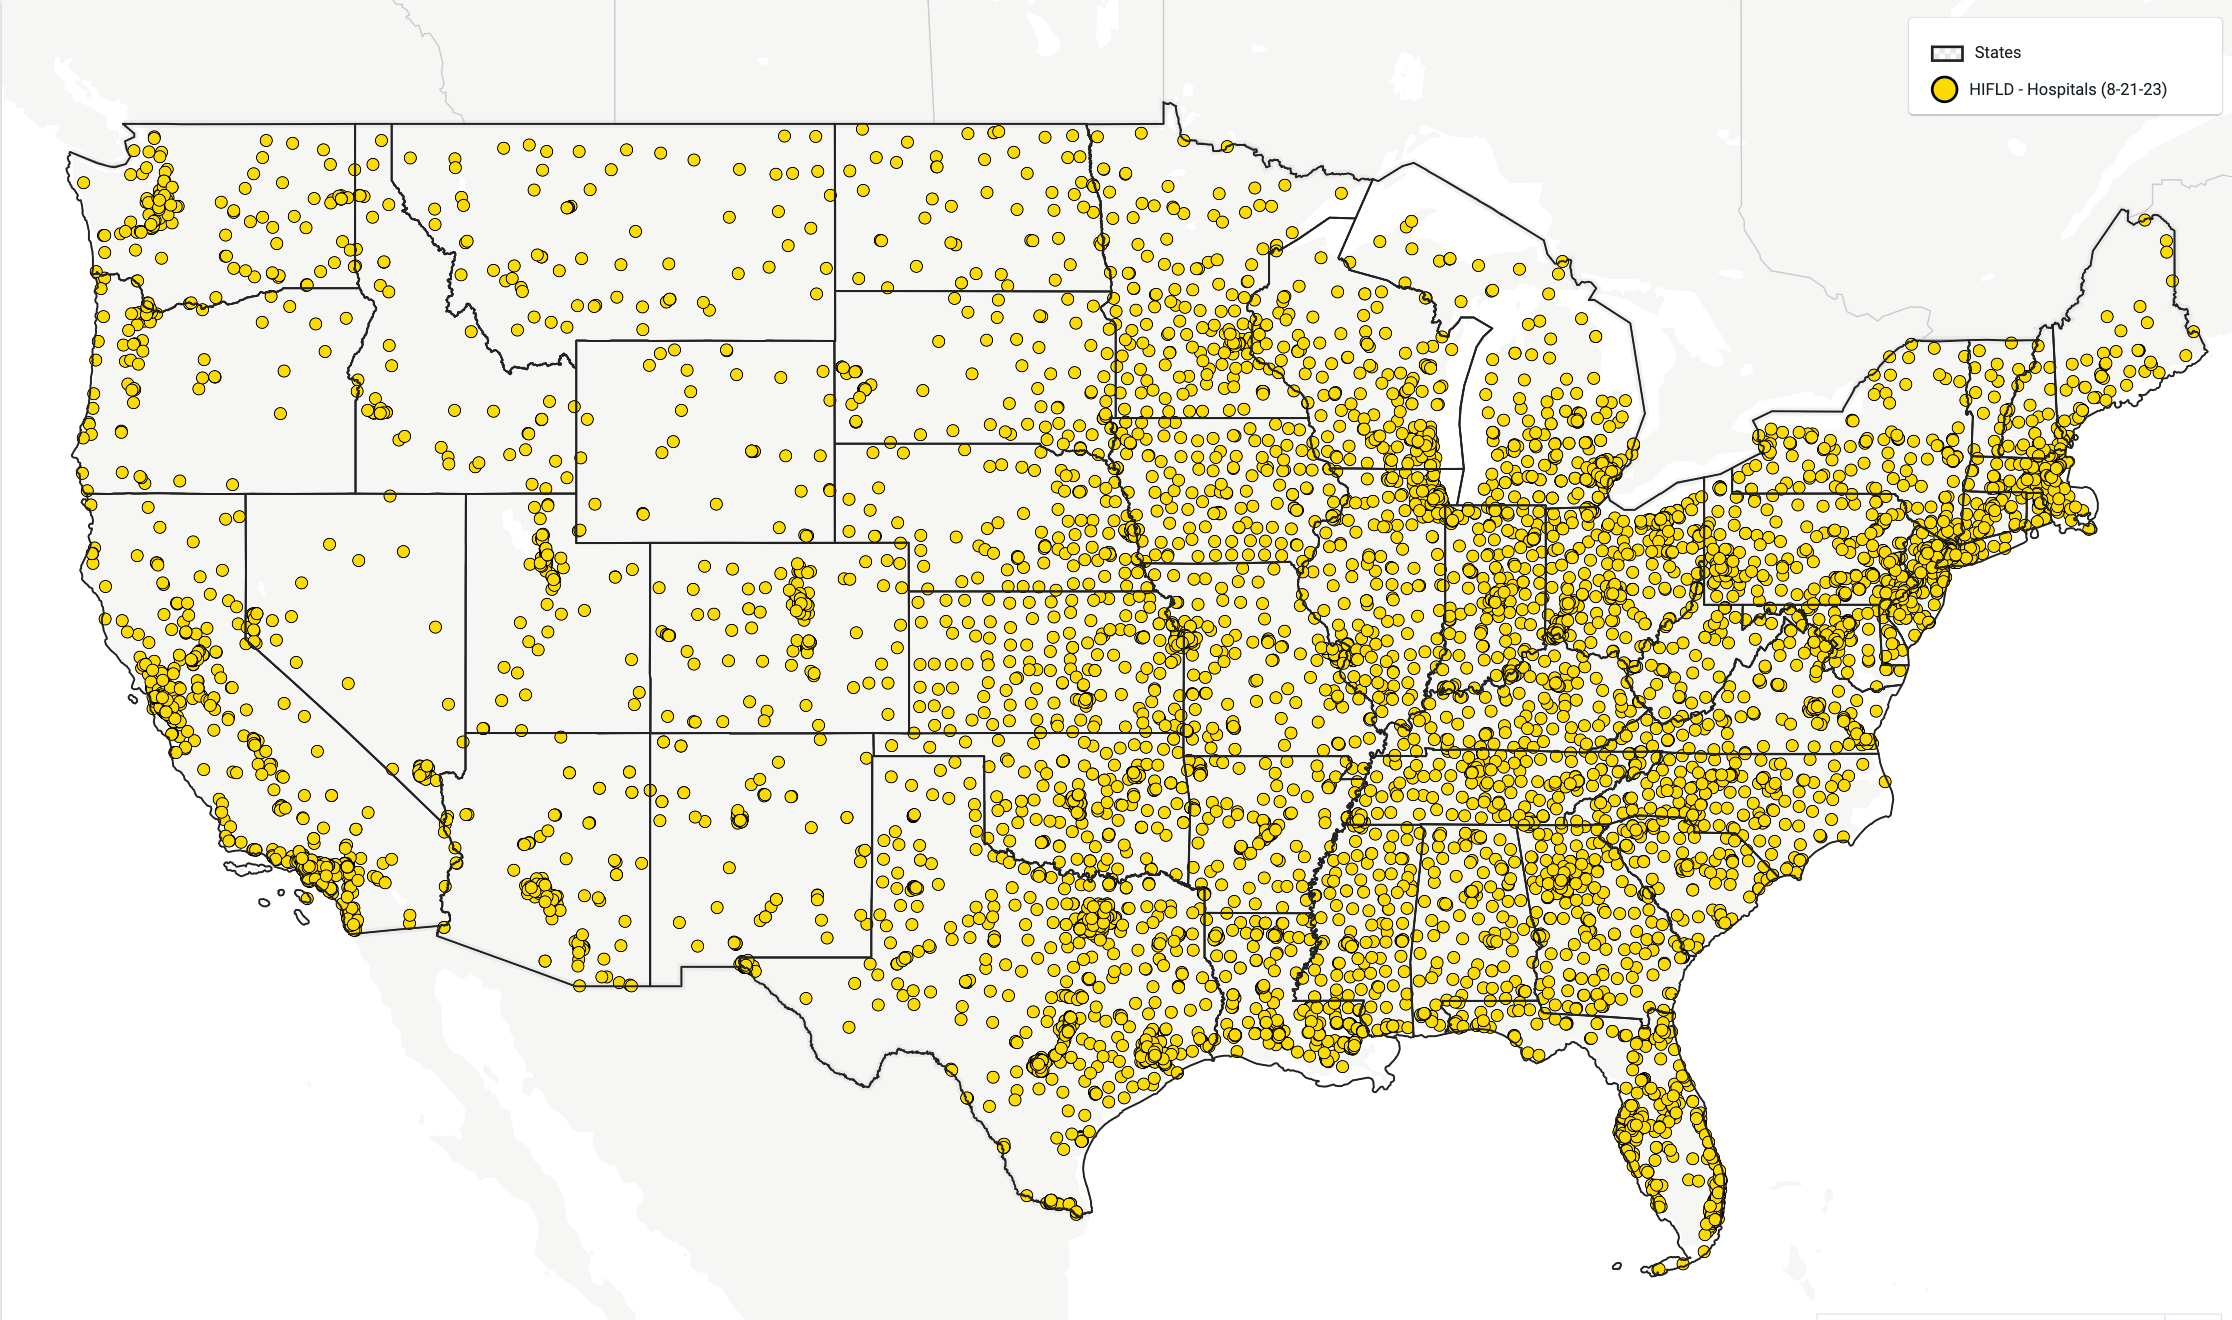
Create a General Analysis project using the Select from available boundaries option. Type "48 States" in the Location field to create a project focusing just on the contiguous United States. Name the project Resilience Insights - Nationwide Hospital Portfolio Assessment.
In this example, you are focusing on hospitals across multiple states, so add these layers by searching the Layer Manager using their names:
Hospitals
States
Add these Resilience Insights layers at the tract level, including:
Location Insights - Tract
Community Insights - Tract (2021)
Climate & Hazards Insights - Tract
Customize the symbology to make maps more useful and legible.
Option
Hospitals
States
Column
No column (single symbol)
No column (single symbol)
Size
3px
N/A
Fill
#FCC400 (yellow)
transparent
Stroke
0.5px width and #000000 (black) color
0.5px width and #000000 (black) color
Set up the base map features to stylize the map. Click to remove all the labels to simplify the map and allow the hospital points to stand out.
Save the map to a position that you want to present, for example, 1:12,000,000 scale.
Narrow the Project Focus
As you continue working with the portfolio project, follow these steps to begin filtering and working with data columns to help narrow your project's focus. Then, add and save buffers around these filtered datasets. In this example, we're moving from the broad set of nationwide hospitals to a narrower group of hospitals identified as Level III or higher trauma centers.
Continue with the project you created in Set up a National Project (Resilience Insights - Nationwide Hospital Portfolio Assessment).
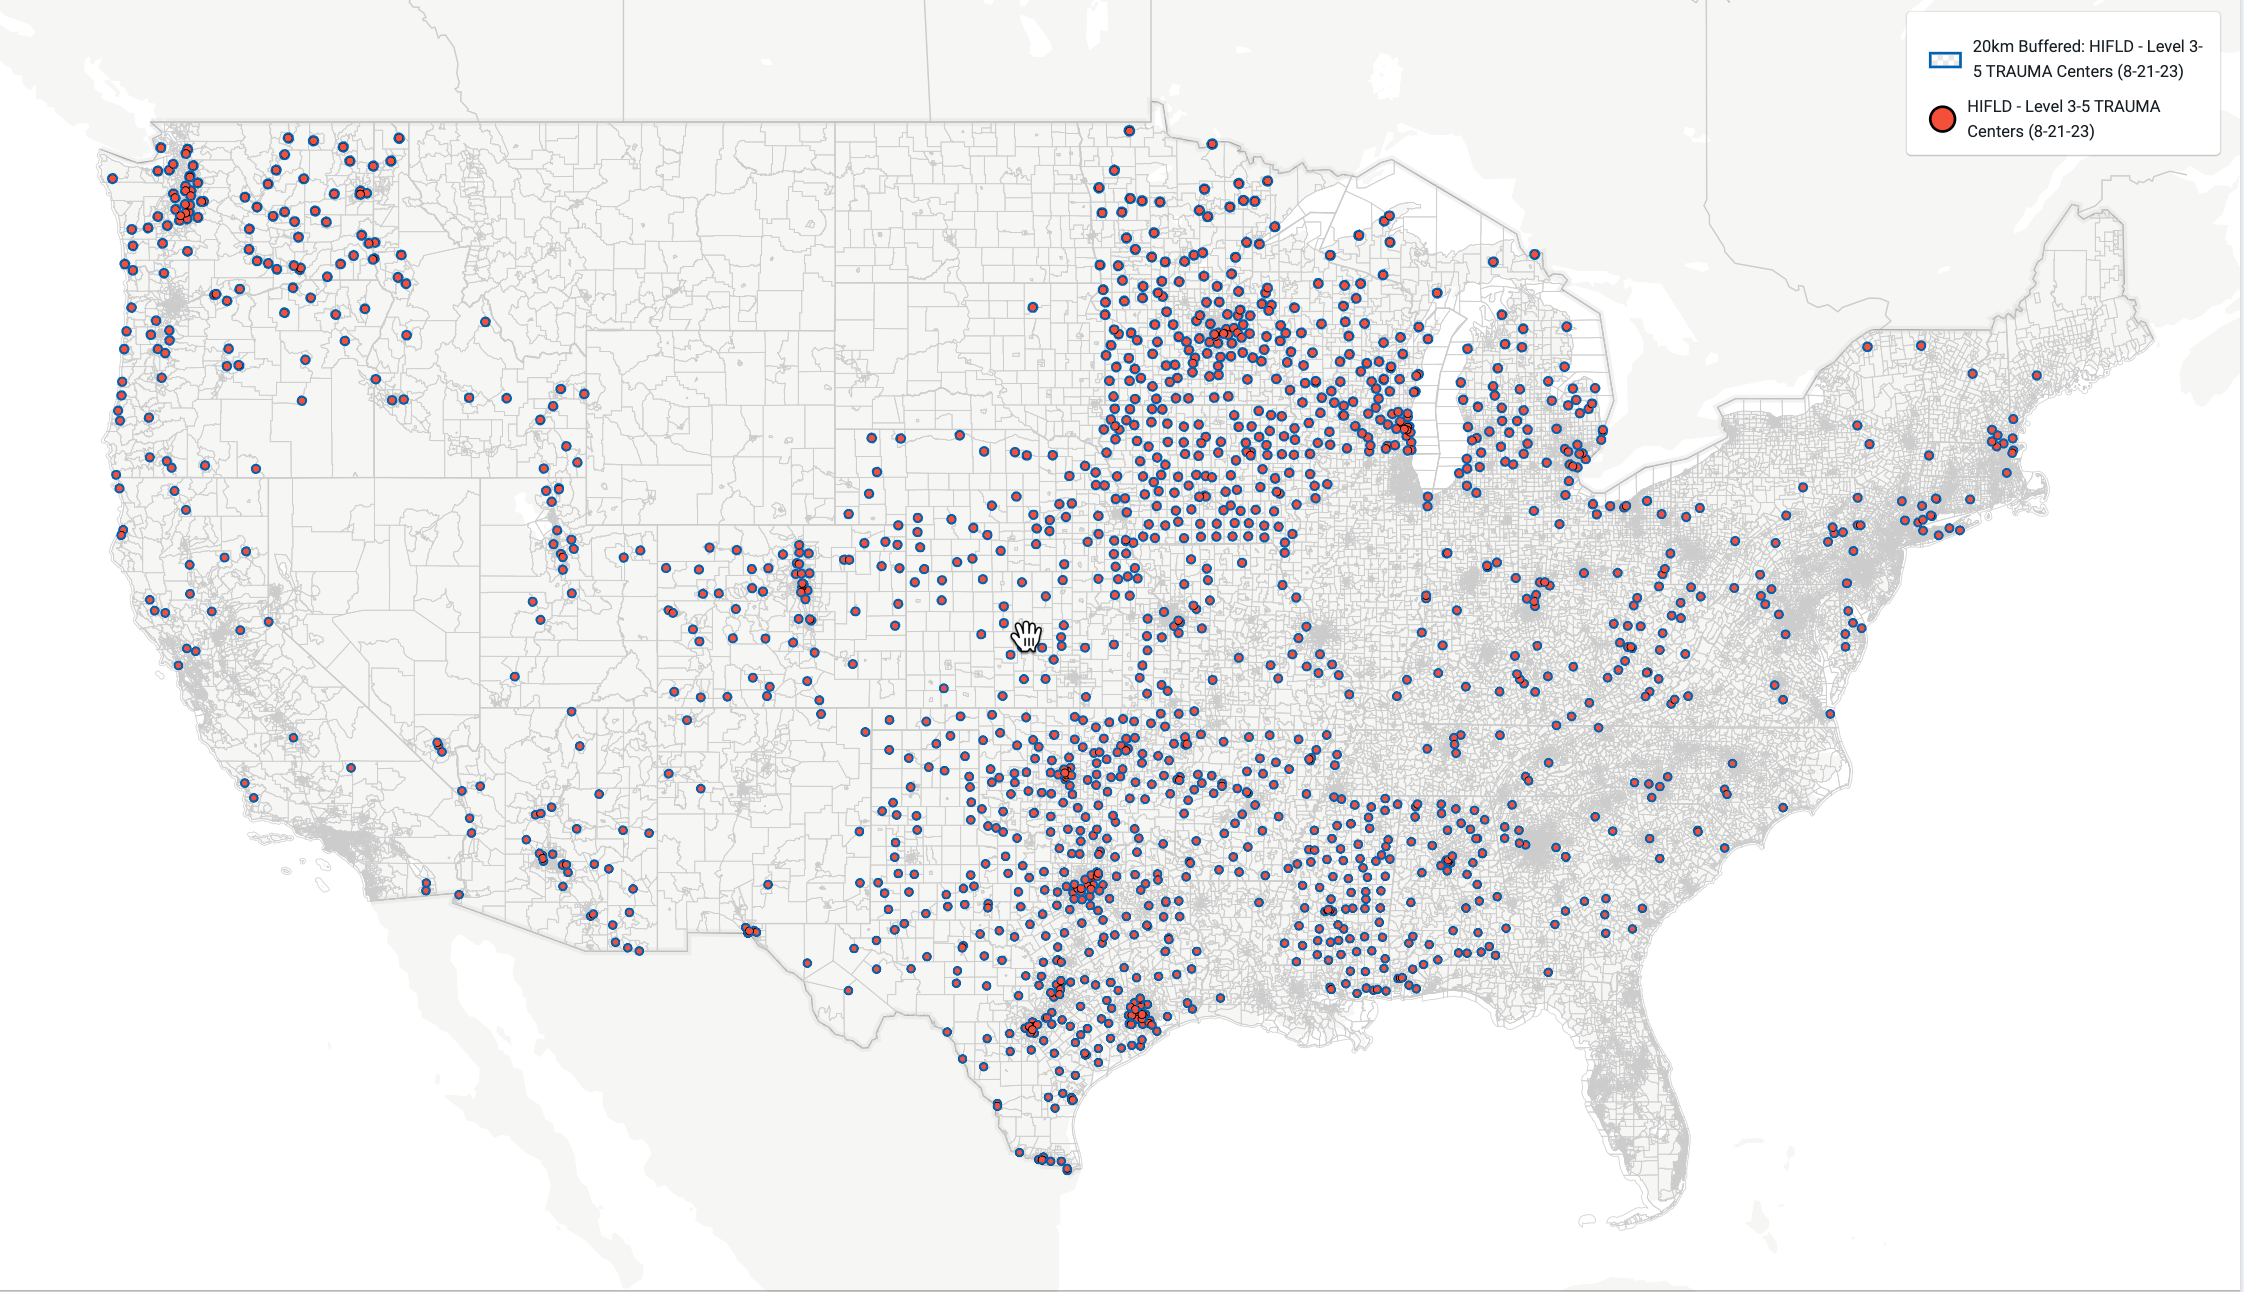
Filter by data columns within a layer by highlighting a layer and selecting Filter > Add filter. Select the Hospitals layer, filter by Trauma, and choose all hospitals with Level III, IV, or V in their Trauma fields.
Look up key information for selected areas using the data tables. For example, you can use this information to compare the total number of trauma centers to all hospitals.
Select Filter and Save as to save this filter as a separate layer. For example, you can use: National Hospitals with Level 3,4,5 Trauma Centers. Also, you can edit the symbology to differentiate this layer from the previous one.
Add a buffer to this layer of 20 kilometers and save it as: 20km Buffered: Hospital Points - With Level 3 Through 5 Trauma Units.
Edit the symbology to represent this buffer differently.
Evaluate Insights in the Surrounding Areas
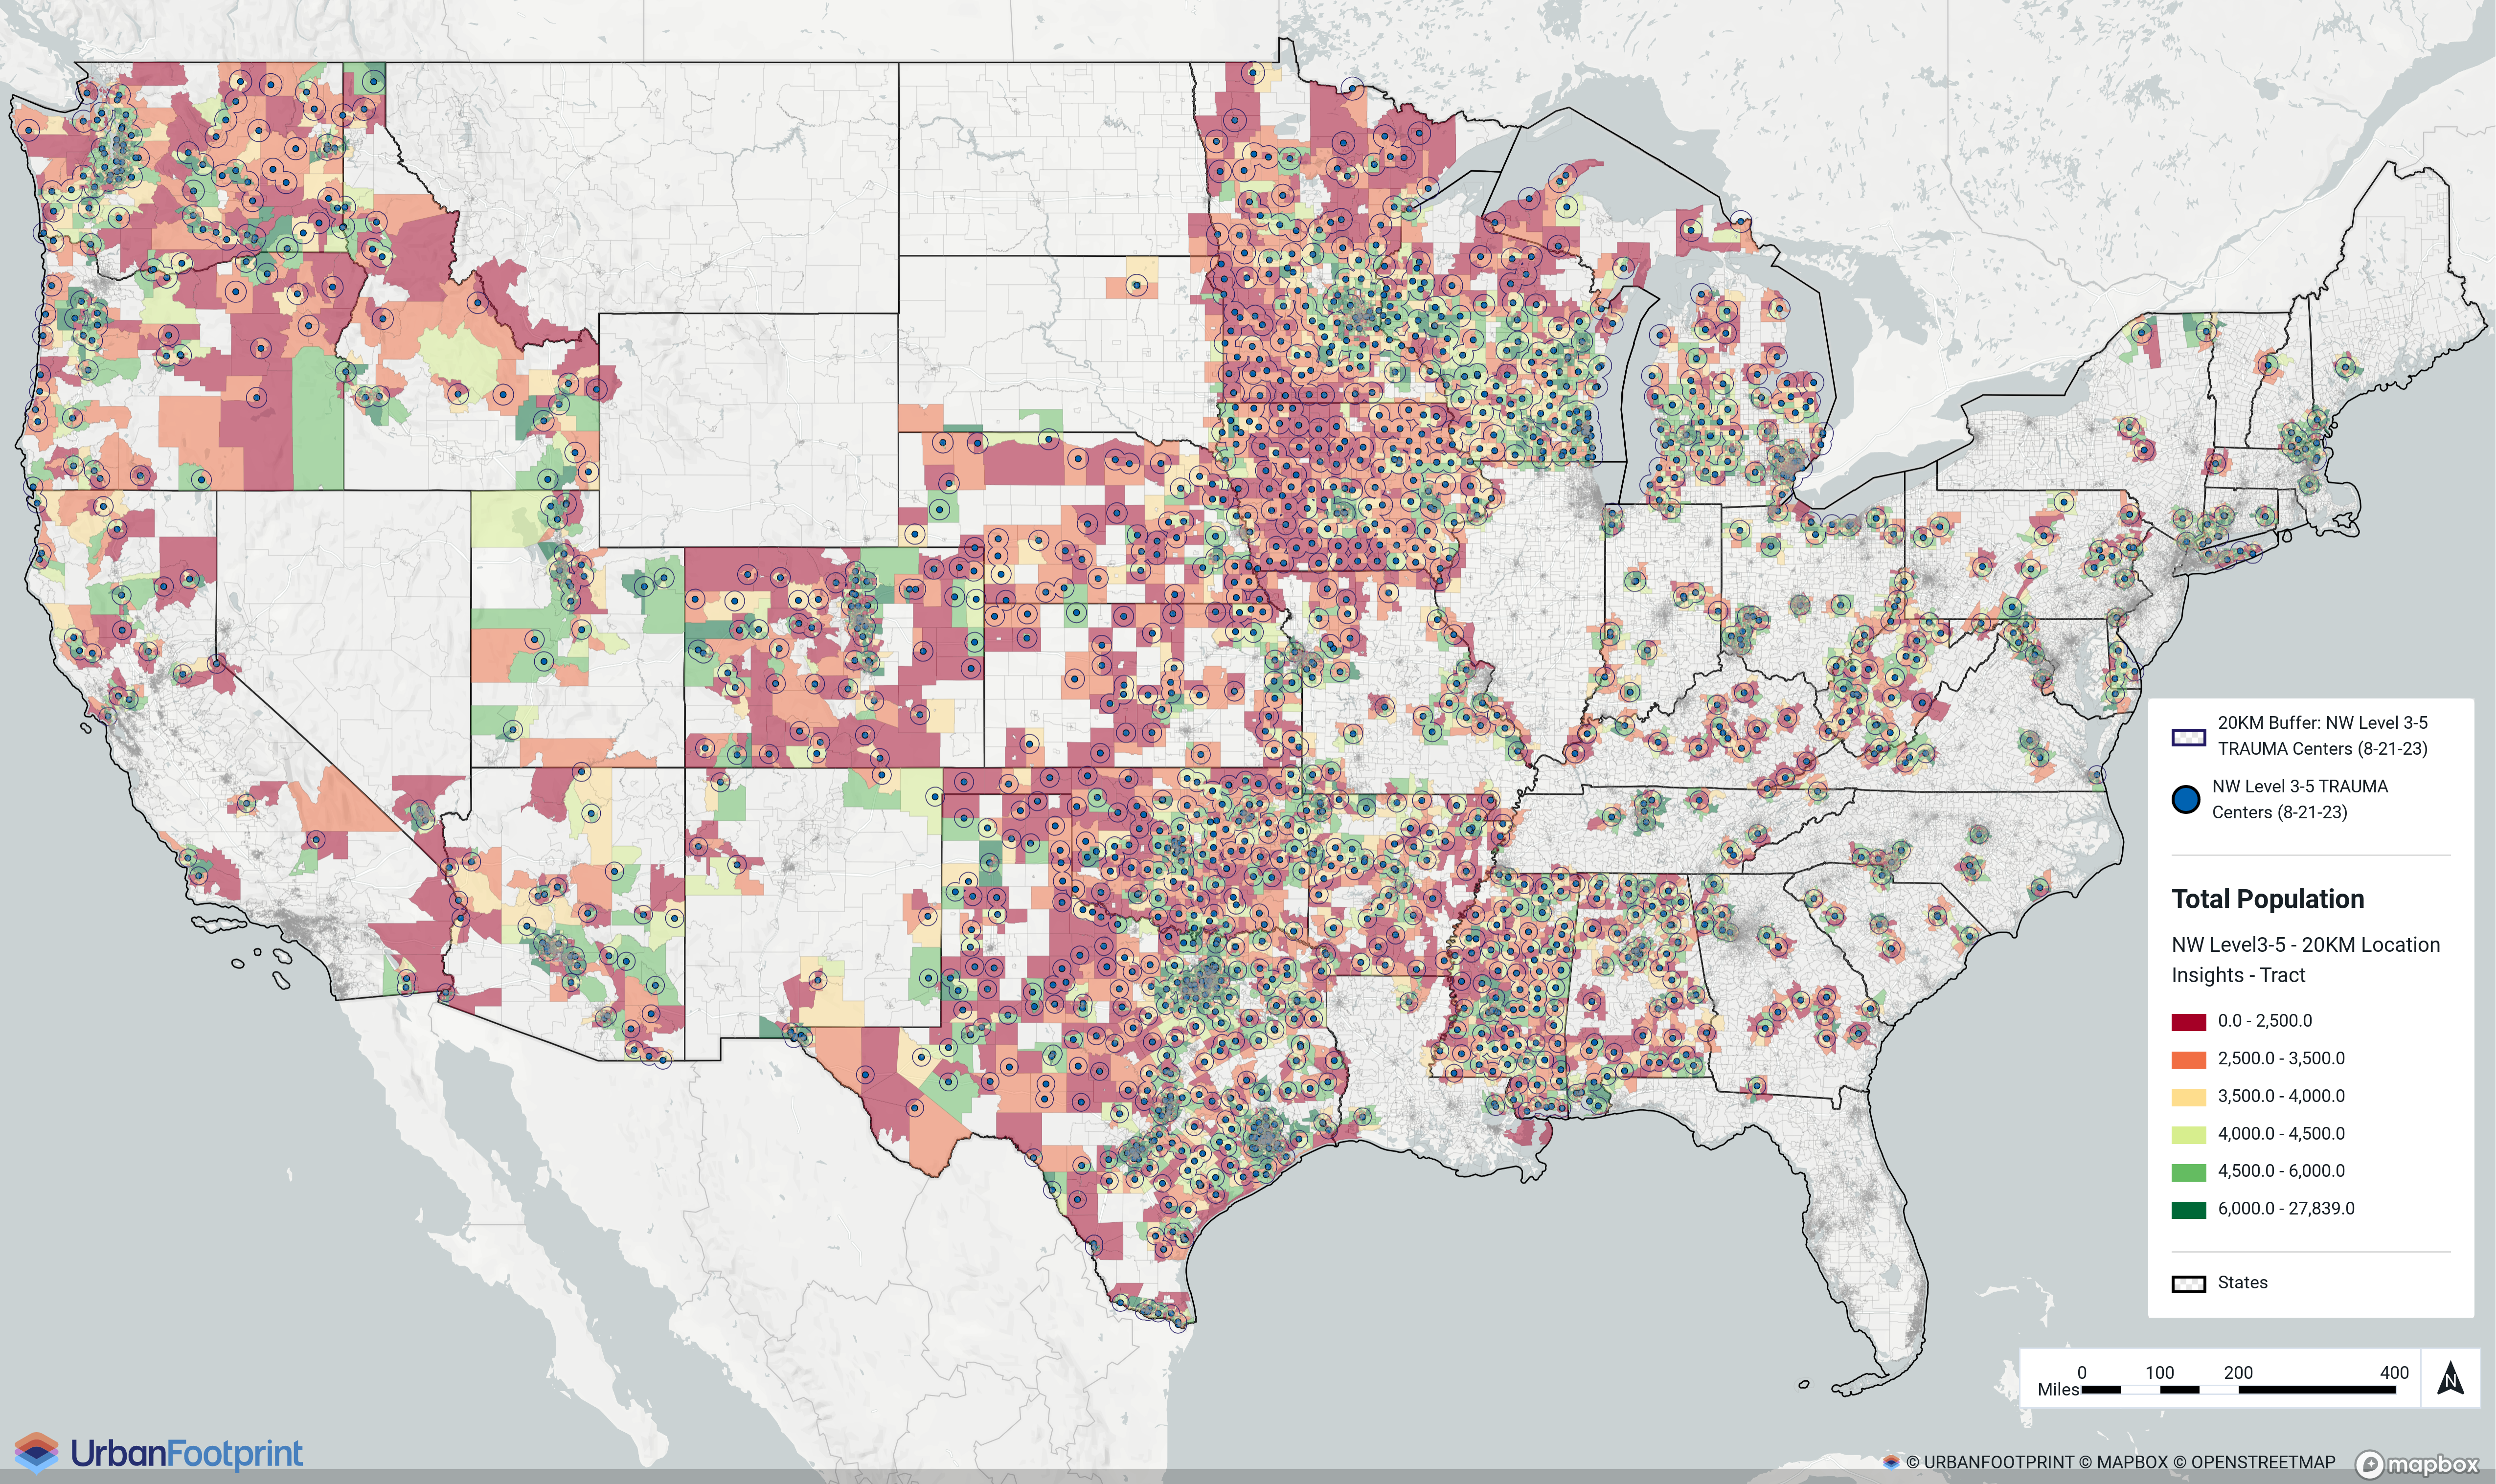
Now that you've identified the areas around these trauma centers, you can start to evaluate the surrounding environment, community, and potential hazard exposure. You do this by joining the buffered layers to the Resilience Insights layers you've already added to the project when you first set it up.
Open the Location Insights - Tract layer that you imported previously.
Join that layer to the 20km Buffered: Hospital Points - With the Level 3 Through 5 Trauma units layer you created.
Save this layer as: Focus Area Analysis - Location Insights within 20km of Level 3-5 Trauma Centers.
Use the information in the data table to identify summary statistics, such as those highlighted in the summary statistics.
Summary Statistics for the National Portfolio
Using the data table from Focus Area Analysis - Location Insights within 20km of Level 3-5 Trauma Centers layer, you learned about the built environment, climate & hazards, and community near Level 3-5 Trauma Centers.
For additional information on Climate & Hazards and Community beyond what is included in Location Insights, you can repeat the Portfolio Analysis workflow but join to Climate & Hazards Insights or Community Insights instead of Location Insights.
Built Environment Takeaways
Total housing units – 57M.
Housing units built before 1970 – 19.0M (33.4%).
Population per household – 2.65.
Climate & Hazard Takeaways
Exposed to 0.5+m of recurring inundation under 2-foot SLR scenario – ~411.8K (0.30%) of the population.
Exposed to a FEMA 1% flood zone (100-year floodplain) – ~10.9M (14.8%) of the population.
Exposed to 3+ feet of storm surge under Category 4 scenario – or ~2.62M (1.94%) of the population.
Community Takeaways
Population over 65 – 20.7M of 135M (15.3%).
Population between 18 and 64 – 82.8M of 135M (61.3%).
Average median household income – $72,800.
Median median household income – $65,029.
 |
Filter on Specific States
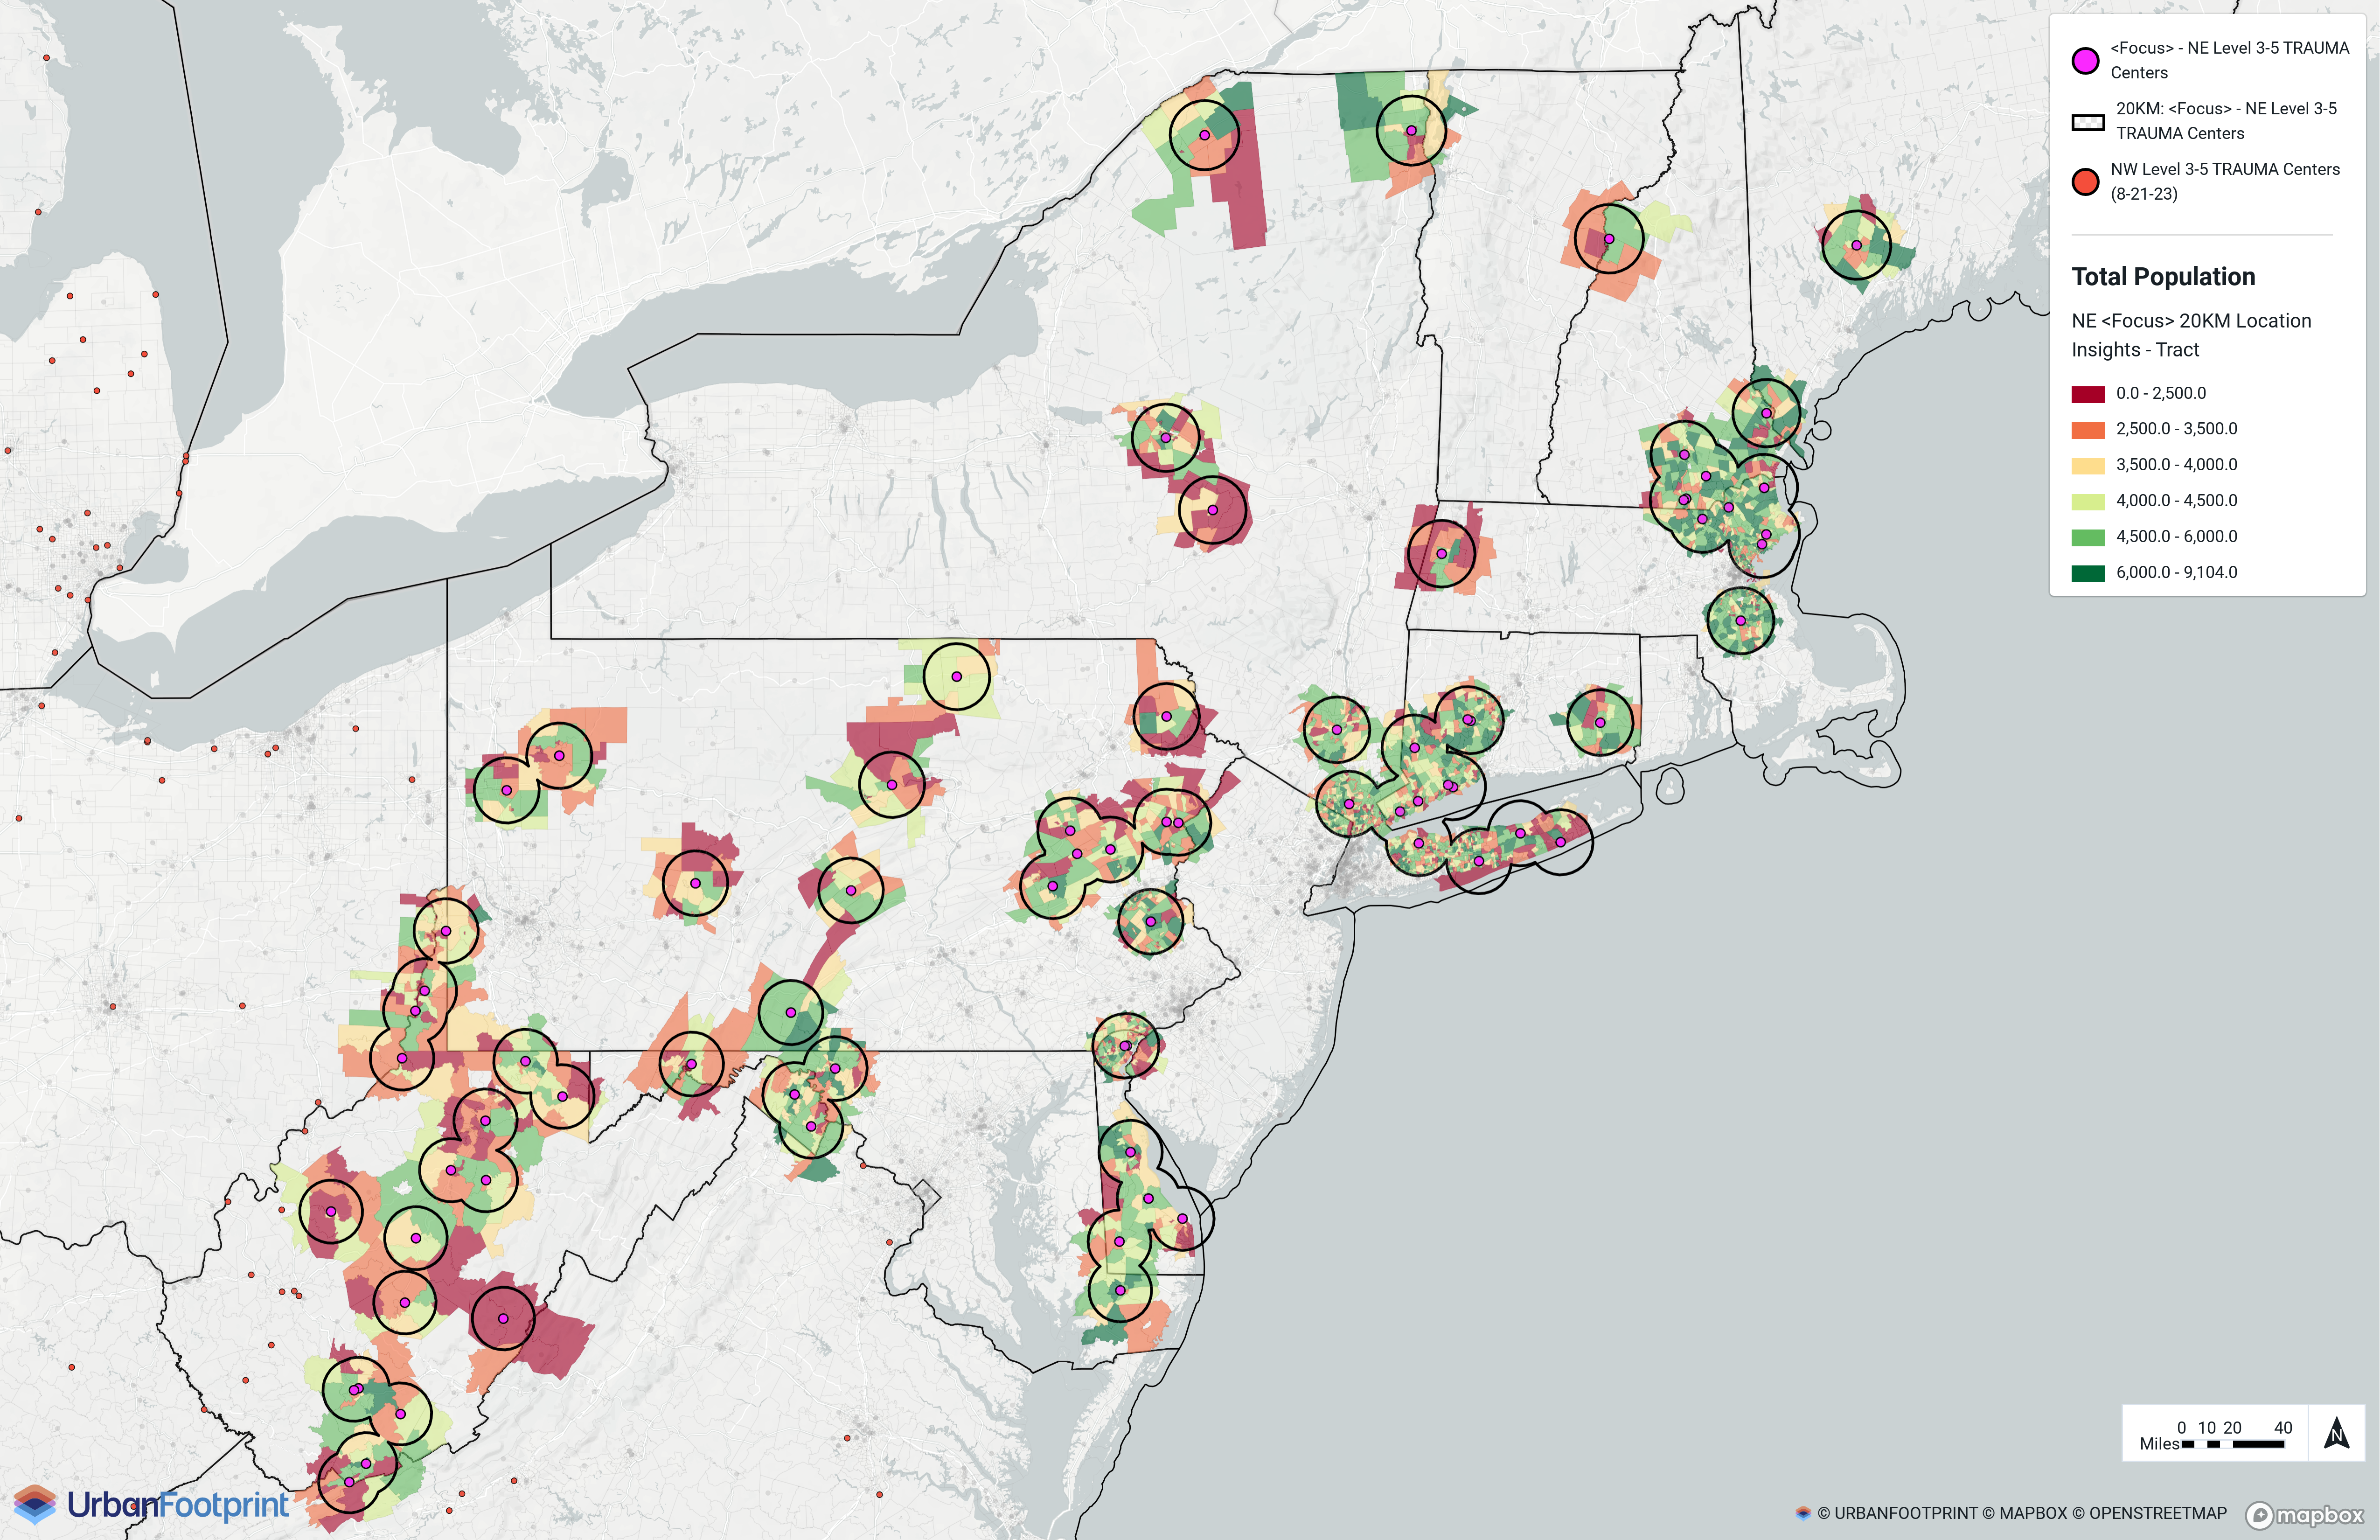
After evaluating a nationwide set of locations, you can now narrow our focus to a specific region or group of states, such as those in the northeastern United States. If you need help doing any of these tasks in Analyst, refer to Get Started.
Open the National Hospitals with Level 3,4,5 Trauma Centers layer.
Add a filter for State.
Select only these states: CT, DE, MA, MD, ME, NH, NJ, PA, and WV. If you don't see any of these states listed, it means the state doesn't have any Level 3-5 trauma centers.
Click Save as and name this layer: NE - Level 3-5 Trauma Centers.
Open the NE - Level 3-5 Trauma Centers layer you created and add a 20-kilometer buffer.
Select Save as and name the layer: 20km Buffer - Focus Area Analysis Zone.
Open the Location Insights - Tract layer that is already in your project.
Join that layer to the 20km Buffer - Focus Area Analysis Zone layer.
Name this layer: NE Hospitals Analysis - Hazard Insights within 20km.
Use the information in the data table to identify summary statistics.
Summary Statistics for the Northeastern States
Using the data table from the NE Hospitals Analysis - Hazard Insights within 20km layer, you learned about the built environment, climate & hazards, and community near Level 3-5 Trauma Centers in the Northeastern States.
For additional information on Climate & Hazards and Community, beyond what is included in Location Insights, you can repeat the Filter on Specific States workflow but join to Climate & Hazards Insights or Community Insights instead of Location Insights.
Built Environment Insights
Total housing units – ~5.9M.
Housing units built before 1970 – 2.8M (48.2%).
Climate & Hazard Insights
Exposed to 0.5+m of recurring inundation under 2-foot SLR scenario – ~115.3K (0.81%) of the population.
Exposed to a FEMA 1% flood zone (100-year floodplain – ~1.4M (9.5%) of the population.
Exposed to 3+ feet of storm surge under Category 4 scenario – ~782K (5.5%) of the population.
Community Insights
Population over 65 – 2.5M of 14.2M (18%).
Population between 18 and 64 – 8.7M of 14.2M (61.3%).
Average median household income – $89,637.
Median median household income – $80,560.
 |
Focus on Local Region
To narrow the focus of this analysis, you can use New York County to filter the data to just Manhattan. If you need help doing any of these tasks in Analyst, refer to Get Started.
Within the layer manager, search for and add this layer (included in the Administrative Boundaries layer category): Census County (2020).
Search for New York on the map, then click
 Point selection at the top of the screen to focus on New York.
Save and name this as New York County.
Open the Hospitals layer.
Add a filter for Status to select the open hospitals.
Join that filtered layer to the New York County layer.
Click Save as and name this layer: Hospitals in New York County.
 |
Open the Hospitals in New York County layer you created and add a 20-kilometer buffer.
Select Save as and name the layer: 20km Buffer: New York County Hospitals. The 20-kilometer buffer provides a regional overview of the area served by the hospitals.
Repeat to create a 10-kilometer buffer and name it: 10km Buffer: New York County Hospitals. The 10-kilometer buffer provides more focus on the population that would be likely to use these hospitals during a hazard.
 |
Open the Location Insights - Tract layer already in your project.
Join that layer to the 20km Buffer: New York County Hospitals layer.
Name this layer: 20km Buffer of New York County Hospitals - Location Insights - Tract.
Use the information in the data table to identify summary statistics such as those highlighted in the summary statistics.
 |
Summary Statistics for New York County
Using the data table from the 20km Buffer of New York County Hospitals - Location Insights - Tract layer, you learned about the built environment, climate & hazards, and community near Level 3-5 Trauma Centers in New York County.
For additional information on Climate & Hazards and Community, beyond what is included in Location Insights, you can repeat the Focus on Local Region workflow but join to Climate & Hazards Insights or Community Insights instead of Location Insights.
Built Environment Takeaways
Total housing units – ~4.8M.
Housing units built before 1970 – 3.5M (73%).
Population per household – 2.69.
Climate & Hazard Takeaways
Exposed to 0.5+m of recurring inundation under 2 foot SLR scenario – ~79.2K (0.67%) of the population.
Exposed to a FEMA 1% flood zone (100-year floodplain – ~647K (5.5%) of the population.
Exposed to 3+ feet of storm surge under Category 4 scenario – ~3.2M (27.3%) of the population.
Community Takeaways
Population over 65 years of age – 1.75 of 11.77M (14.9%).
Population between 18 and 64 years of age – 7.5M of 11.77M (63.9%).
Average median household income – $73,921.
Median median household income – $82,076.
 |